Simba Position Manager

  • 指标
  • Emmanuel Ndacyayisenga
    Emmanuel Ndacyayisenga
    • Founder & Lead Developer | Quant Trader & MQL5 Developer 在  ShieldNexus
    • 卢旺达
    • 1037
    NDACYAYISENGA Emmanuel is a quantitative trader and MQL5 Expert Advisor developer focused on transforming practical trading concepts into systematic and automated trading solutions.
  • 版本: 3.10
  • 激活: 10
SIMBA POSITION MANAGER

Trade Your Setup. Understand Your Position.

You found the setup.
You opened the trade.

Now what?

This is where many traders struggle.

Finding an entry is only one part of trading. Once a position is open, you still need to understand whether the trade is progressing, how much risk remains, when the position reaches important R-multiples, whether momentum is strengthening or weakening, and whether market conditions continue to support the trade.

SIMBA Position Manager is designed to help with that part of the trading process.

It is an MT5 monitoring and analysis indicator with a professional dashboard designed to analyze open positions, market conditions and potential management levels.

SIMBA does not open, close, modify or manage trades.

You remain in control of every trade. SIMBA provides the information and analysis to help you make better management decisions.

WHAT DOES SIMBA DO?

SIMBA continuously analyzes the market and your open positions and presents the information through a structured dashboard.

The indicator combines concepts such as:

  • R-multiples

  • ATR

  • PSAR

  • DEMA

  • Fibonacci levels

  • Market direction

  • Momentum

  • Volatility

  • Multi-timeframe conditions

  • Risk and reward

  • Position progress

Instead of constantly calculating these conditions manually, SIMBA brings them together into one workspace.

The core philosophy is:

MONITOR → ANALYZE → PROTECT → MANAGE → DECIDE

SIMBA provides the analysis.

You make the decision.

IMPORTANT: SIMBA DOES NOT MODIFY TRADES

SIMBA Position Manager is an analysis and monitoring indicator.

It does not:

  • Open trades

  • Close trades

  • Modify Stop Loss

  • Modify Take Profit

  • Move positions to Break-Even

  • Execute partial profits

  • Trail positions

  • Change your lot size

  • Send trade-management orders

The indicator simply monitors and analyzes the position and displays management information, levels and conditions on the dashboard.

This means you can use SIMBA alongside your existing trading strategy while maintaining complete manual control. if your want the indicator which can do all that check Simba Position Manager Pro

YOUR TRADE. YOUR DECISION.

Many traders know how to find entries.

The difficult part often comes afterward.

You may ask:

Is my trade progressing normally?

How much have I made in R?

Where is my potential break-even level?

Has the market reached a meaningful profit area?

Is momentum still supporting the position?

Is the trend becoming exhausted?

Should I protect more profit?

Should I allow the trade to continue?

SIMBA is designed to help answer these questions through live market analysis.

R-BASED POSITION ANALYSIS

SIMBA uses the initial risk of the position as a reference point.

Your initial risk represents:

1R

From there, the dashboard can help you understand the position's progress through stages such as:

INITIAL → +1R → +2R → +3R → RUNNER

For example, the dashboard can help identify when a position has reached:

  • +1R

  • +2R

  • +3R

  • Other configured R-multiples

This allows you to evaluate the trade based on its original risk rather than simply looking at raw currency profit.

Instead of thinking:

"I am up $150."

You can think:

"The position has reached +2R."

That provides a more consistent framework for comparing trades.

POSITION PROTECTION ANALYSIS

SIMBA can calculate and display potential protection levels based on its analytical logic.

Depending on the configuration and market conditions, the dashboard can reference:

  • ATR

  • PSAR

  • Initial risk

  • Entry price

  • Current price

  • R-multiple

  • Market structure

  • Fibonacci levels

These levels are presented as analysis and reference information.

The trader decides whether to manually apply any change to the position.

This keeps the trader in control while reducing the amount of calculation required during a live trade.

BREAK-EVEN ANALYSIS

Moving a trade to break-even is an important decision.

Move too early and normal market noise may remove a potentially good trade.

Move too late and an already profitable trade may return toward its original risk.

SIMBA monitors the position's progress and can identify when predefined R-based conditions have been reached.

The dashboard can therefore show when a position has reached a potential break-even management stage.

SIMBA informs. You decide.

PARTIAL PROFIT ANALYSIS

One of the biggest challenges in trading is knowing what to do with a profitable position.

Close everything too early and the market may continue much further.

Hold everything without a plan and a profitable trade may give back a significant portion of its gains.

SIMBA can display R-based and market-based management levels that can help traders evaluate potential partial-profit opportunities.

The trader can then decide whether to:

SECURE → HOLD → REDUCE → CONTINUE

No automatic order is executed.

RUNNER ANALYSIS

Sometimes the best part of a trade happens after the first profit target.

SIMBA helps traders identify when a position has moved sufficiently into profit to consider allowing part of the position to continue.

The dashboard can monitor:

  • Current R

  • Trend direction

  • Momentum

  • PSAR

  • DEMA

  • Volatility

  • Potential target areas

  • Market exhaustion

This gives the trader more information when deciding whether a profitable position should continue running.

Secure information. Protect decisions. Give strong trades room when conditions allow.

R-BASED TRAILING ANALYSIS

SIMBA can calculate and display potential R-based trailing references.

As the position moves further into profit, the trader can see how different protection levels could affect the trade.

For example:

+1R → Protection Zone

+2R → Profit Protection Zone

+3R → Extended Protection Zone

These are analytical references rather than automatic trading commands.

You decide whether and when to adjust your actual Stop Loss.

PSAR MARKET ANALYSIS

Parabolic SAR provides a dynamic view of market direction and trend movement.

SIMBA can use PSAR information to help evaluate whether market conditions continue to support the direction of an open position.

The dashboard can show whether PSAR is:

SUPPORTING

or

CONTRADICTING

the current position direction.

This gives traders another layer of information when deciding whether to continue holding, protect profit or reconsider the position.

DEMA + PSAR ANALYSIS

A single indicator should not always determine what happens to a trade.

For example, a DEMA crossover against a position does not necessarily mean that the entire trend has ended.

SIMBA therefore combines DEMA and PSAR conditions to provide a broader analytical picture.

A potential DEMA change can be evaluated together with PSAR conditions.

The dashboard can help identify situations such as:

DEMA CHANGE + PSAR SUPPORT

The trend may still have strength.

Or:

DEMA CHANGE + PSAR CONTRADICTION

The position may require closer attention.

SIMBA does not make the final decision.

It gives the trader more information before making it.

FIBONACCI MARKET LEVELS

SIMBA can also use Fibonacci-based calculations as reference points for trade analysis.

These levels can help traders evaluate:

  • Potential profit zones

  • Retracement areas

  • Extension levels

  • Market reaction areas

  • Potential target locations

Fibonacci levels are presented as analytical references and should be interpreted together with the broader market conditions.

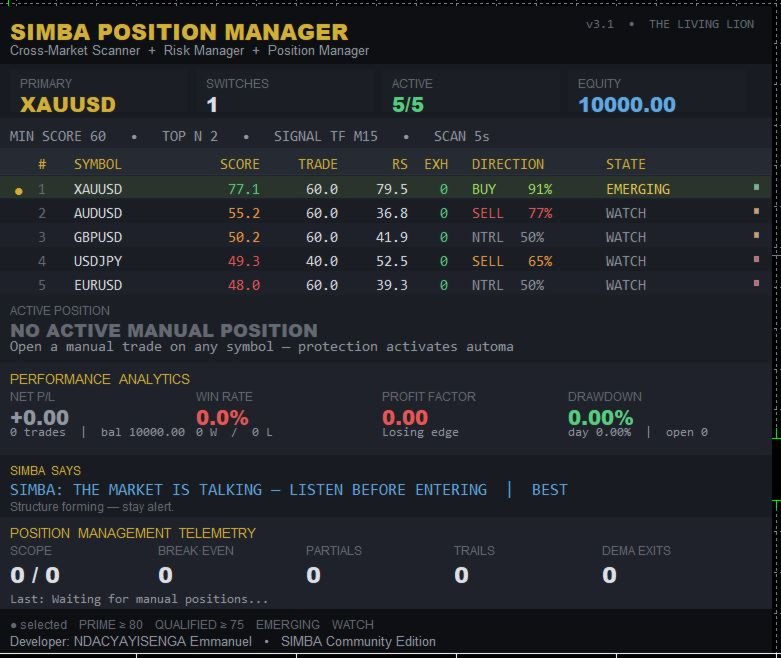
PROFESSIONAL LIVE DASHBOARD

The heart of SIMBA Position Manager is its dashboard.

Instead of manually checking multiple calculations, the trader can see important information in one workspace.

The dashboard can display information such as:

  • Open position

  • Direction

  • Entry price

  • Current price

  • Current profit/loss

  • Current R

  • Initial risk

  • Potential management levels

  • Market direction

  • Market strength

  • Momentum

  • PSAR condition

  • DEMA condition

  • ATR information

  • Fibonacci levels

  • Market state

  • Position status

The objective is simple:

Less calculation. More awareness. Better decisions.

SIMBA MARKET STATUS

SIMBA can also monitor the broader market environment.

The dashboard can communicate different market states such as:

PRIME

The monitored market currently meets stronger internal conditions.

WATCH

The market is being monitored but does not currently meet the stronger conditions.

DECAYING

The market is showing signs of weakening, exhaustion or deteriorating conditions.

WAIT

Additional confirmation may be required.

PROTECTED

The position has reached a condition where profit protection may deserve attention.

These states are designed to make complex market information easier to understand at a glance.

MARKET SCANNER

SIMBA can monitor multiple markets from one dashboard.

Instead of manually switching between charts, traders can compare the monitored instruments and see which markets currently deserve attention.

The analysis can consider factors such as:

  • Trend

  • Momentum

  • Volatility

  • Multi-timeframe alignment

  • Market strength

  • Tradeability

  • Exhaustion

  • Risk/reward conditions

  • Setup quality

The result is a ranked view of the markets being monitored.

SCAN → SCORE → FILTER → RANK → ANALYZE

MULTI-TIMEFRAME ANALYSIS

Markets can look bullish on one timeframe and bearish on another.

SIMBA helps traders see these relationships more clearly.

The dashboard can compare conditions across multiple timeframes to help identify:

  • Higher-timeframe direction

  • Intermediate trend

  • Entry-timeframe conditions

  • Momentum alignment

  • Potential conflicts

This helps answer an important question:

Is my position moving with the broader market or against it?

BUILT FOR MANUAL TRADERS

SIMBA Position Manager is designed for traders who want analytical assistance without giving up control.

DISCRETIONARY TRADERS

You choose the setup.

You choose the entry.

SIMBA helps you monitor what happens afterward.

DAY TRADERS

Monitor several positions and markets without repeatedly performing the same calculations.

SCALPERS

Use the dashboard to quickly understand position progress and changing market conditions.

SWING TRADERS

Continue monitoring positions while keeping important management information visible.

PROP FIRM TRADERS

Use the analytical framework to monitor R, position progress and market conditions while following your own firm's risk rules.

Always verify your firm's current rules before using any trading-management workflow.

WHAT MAKES SIMBA DIFFERENT?

SIMBA is not designed to replace your trading strategy.

It does not tell you that every market must be traded.

It does not claim to predict the future.

It does not promise profitable trades.

Instead, it focuses on something that is often overlooked:

WHAT HAPPENS AFTER THE ENTRY?

SIMBA brings together:

MARKET AWARENESS

Understand the current condition of the market.

POSITION AWARENESS

Understand what is happening to your open position.

RISK AWARENESS

Understand how far the position has moved relative to its initial risk.

MANAGEMENT AWARENESS

Identify potential protection, profit and trailing reference levels.

All inside one dashboard.

SIMBA IS YOUR SECOND SET OF EYES

You do not need another indicator telling you simply:

BUY

or

SELL

You need information that helps you understand what is happening after you have made the decision to trade.

SIMBA can help you see:

  • Is the position profitable?

  • How many R have I achieved?

  • Has the position reached a management milestone?

  • Is momentum still supporting the trade?

  • Is PSAR supporting the direction?

  • What is DEMA showing?

  • Where are potential protection levels?

  • Where are potential profit areas?

  • Is the market becoming exhausted?

  • Should I pay closer attention?

The final decision remains yours.

KEY FEATURES
Feature Purpose
Live Position Monitoring Monitor open positions in real time
R-Multiple Analysis Measure position performance relative to initial risk
Break-Even Reference Identify potential break-even management stages
Partial-Profit Analysis Highlight potential profit-management areas
Runner Analysis Help evaluate whether a position may have room to continue
R-Based Trailing Analysis Display potential R-based protection references
PSAR Analysis Monitor dynamic market direction
DEMA Analysis Monitor trend and momentum changes
DEMA + PSAR Logic Combine conditions for deeper analysis
ATR Analysis Evaluate volatility and potential protection references
Fibonacci Analysis Display potential retracement and extension areas
Market Scanner Monitor multiple instruments
Multi-Timeframe Analysis Compare conditions across timeframes
Market Ranking Identify markets meeting stronger analytical conditions
Market State Quickly understand current market conditions
Live Dashboard Bring market and position information together
Manual Control Trader remains responsible for all trading actions
WHAT SIMBA DOES NOT DO

SIMBA Position Manager is intentionally designed as a monitoring and analysis indicator.

It does not:

❌ Open trades
❌ Close trades
❌ Modify existing trades
❌ Move Stop Loss automatically
❌ Move Take Profit automatically
❌ Execute partial closes
❌ Automatically trail positions
❌ Automatically change lot sizes
❌ Guarantee profitable trades
❌ Predict the market

The indicator provides information and analytical references. check Simba Position Manager Pro

The trader makes the final decision and executes any desired trade action manually.

WHY MANUAL CONTROL MATTERS

Trading is not only about calculations.

It is also about context.

A technical calculation can identify a potential level, but the trader may have additional information about:

  • News

  • Session conditions

  • Liquidity

  • Market structure

  • Correlation

  • Account exposure

  • Personal risk tolerance

  • Trading plan

  • Prop-firm restrictions

SIMBA therefore does not attempt to take control away from the trader.

Instead:

SIMBA calculates.

SIMBA monitors.

SIMBA displays.

YOU DECIDE.

WHO SHOULD USE SIMBA?

SIMBA Position Manager may be suitable for traders who:

  • Already have their own trading strategy

  • Prefer manual entries

  • Want better post-entry analysis

  • Trade multiple markets

  • Want R-based position monitoring

  • Want to understand trade progress more clearly

  • Want potential management levels displayed automatically

  • Want market conditions and positions in one dashboard

  • Want to reduce repetitive calculations

  • Want more structured decision-making

It may not be suitable for traders looking for a simple buy/sell signal or a fully automated trading system.

GETTING STARTED
  1. Install SIMBA Position Manager on MetaTrader 5.

  2. Attach the indicator to your preferred chart.

  3. Configure the markets and analytical settings.

  4. Open your trade using your own strategy.

  5. Allow SIMBA to monitor the position.

  6. Review the dashboard as the market develops.

  7. Use the displayed information to evaluate your management decisions.

  8. Execute any desired trade adjustment manually through MT5.

SIMBA does not take control of your account.

You remain the trader.

THE SIMBA APPROACH

SCAN THE MARKET.

UNDERSTAND THE CONDITION.

ENTER WITH YOUR STRATEGY.

MONITOR THE POSITION.

MEASURE THE TRADE IN R.

IDENTIFY PROTECTION LEVELS.

WATCH MOMENTUM AND TREND.

SECURE PROFIT WHEN YOUR PLAN SAYS SO.

LET STRONG TRADES DEVELOP WHEN CONDITIONS ALLOW.

Trading will always involve uncertainty.

SIMBA cannot remove that uncertainty.

What it can do is help transform post-entry monitoring from a collection of manual calculations into a structured visual process.

YOU BRING THE STRATEGY.

YOU MAKE THE ENTRY.

SIMBA MONITORS THE POSITION.

YOU MAKE THE FINAL DECISION.

SIMBA POSITION MANAGER

Monitor. Analyze. Decide.

PRODUCT IDENTITY

Developed by: ShieldNexus
Developer: NDACYAYISENGA Emmanuel
Trading Engine: SIMBA Trading Engine
Product Edition: SIMBA Community Edition

SIMBA Position Manager
Powered by the SIMBA Trading Engine

© NDACYAYISENGA Emmanuel / ShieldNexus

Product version and features may be updated over time.

Risk Warning: Trading financial markets involves substantial risk. Past or simulated performance does not guarantee future results. Use appropriate risk management and test the EA on a demo account before live deployment.

推荐产品
CosmiCLab FIBO
Kirils Subins
CosmiCLab SMC FIBO CosmiCLab SMC FIBO is a professional trading indicator designed for traders who use Smart Money Concepts (SMC), market structure analysis and Fibonacci retracement levels. The indicator automatically detects market swings and builds Fibonacci levels based on the latest impulse movement. It also identifies market structure changes such as BOS (Break of Structure) and CHOCH (Change of Character), helping traders understand the current market direction. CosmiCLab SMC FIBO also pr
Confluence Meter:26 个指标,一个综合评级 Confluence Meter 会计算 26 个常用指标的信号,并将它们汇总为简洁的"卖出 / 中性 / 买入"评级。无需打开几十个窗口,也不必手动比对读数。看一眼面板,就能知道所选周期上市场偏向哪一边。 MT4-version:  https://www.mql5.com/en/market/product/199466 Our products: https://www.mql5.com/en/users/trendhunter/seller 图表上显示的内容 **Oscillators 仪表盘。**由 11 个震荡指标组成的评级:RSI、Stochastic、CCI、ADX、Awesome Oscillator、Momentum、MACD、Stochastic RSI、Williams %R、Bulls/Bears Power 和 Ultimate Oscillator。 **Moving Averages 仪表盘。**由 15 个趋势指标组成的评级:周期为 10、20、30、50、100、200 的 SMA 和
RBreaker
Zhong Long Wu
RBreaker Gold Indicators 是黄金期货一种短线日内交易策略,它结合了趋势跟踪和日内反转两种交易方式,既能捕捉趋势行情的利润,又能在行情反转时及时止盈并顺势反手。 该策略曾连续15年被美国《Futures Truth》杂志评选为前十大最赚钱的交易策略之一,具有很长的生命周期,至今仍在国内外普遍使用与研究。 本指标结合了2026年期货黄金的走势,依据14日ATR指标,分别定义了突破系数A,观察系数B,反转系数R更合理的数值,非常不错的指标,已实现年稳定盈利,值得推荐~ 以上指标适合高波动品种,参数适合期货黄金,股指期货等,如果需要其他品种行情,需要单独设定 突破系数A,观察系数B,反转系数R,进行回测才能使用。 欢迎指标售后有问题可以加+V:504282029
Noize Absorption Index
Ekaterina Saltykova
Noize Absorption Index - is the manual trading system that measures the difference of pressure between bears forces and bulls forces. Green line - is a noize free index that showing curent situation. Zero value of index shows totally choppy/flat market.Values above zero level shows how powerfull bullish wave is and values below zero measures bearish forces.Up arrow appears on bearish market when it's ready to reverse, dn arrow appears on weak bullish market, as a result of reverse expectation.
Fabii Half Trend Baseline
Fabien Georges Andre Guillemaud
不要再逆着更高周期的趋势交易。两条基准线,一张图表。不重绘。 任何品种,任何周期。2 分钟内用在您的图表上。可在 Strategy Tester 中免费试用演示。 Get more indicators here Baselines, volatility filters and oscillators. No repaint. 为什么需要它 您因为图表上的线变绿而入场。随后您打开更高周期,发现大趋势指向相反方向。信号是真实的,但信号背后的趋势并不站在您这一边。 每一笔逆着大趋势的交易,都会削弱您入场时的优势。 您将获得 Fabii Half Trend Baseline 在一张图表上同时显示您当前周期的趋势和更高周期的趋势,您不必再切换窗口去确认大方向。 来自更高周期的第二条基准线绘制在主线后方,因此您无需打开另一张图表就能看到大趋势。 基准线只随趋势移动,不会后退,因此您一眼就能看到趋势会在哪里被打破。 在已确认的反转处显示 Buy 和 Sell 箭头,因此趋势改变的那一刻您会得到清晰的标记。 可选的 K 线着色跟随趋势,因此您可以直接从 K 线读出趋势。 趋势转换和更高周期
Trend Master V2
Oratile Pitsoane
What Is Trend Master Pro? Trend Master Pro   is a professional-grade trend trading indicator built for MetaTrader 5. It was designed with one goal in mind — to keep you on the right side of the market at all times by combining three powerful technical tools into a single, clean, easy-to-read display directly on your price chart. Instead of cluttering your screen with multiple separate indicators, Trend Master Pro fuses an   EMA Ribbon trend filter , a   ZigZag swing point engine , and a   breako
Trading Utility for Forex Currency Pairs Only not for Gold  Functions Auto Lot Calculation based on Risk Auto stoploss  Auto TakeProfit Breakeven Auto Close Half % Close in percentage with respect to the PIPs Pending Orders BuyLimit Sell Limit with distances BuyStop Sell Stop    with distances Trading Informations Risk in percentage For Multiple trades Combine Takeprofit and Combine Stoplosses
Price Magnet — Price Density and Attraction Levels Indicator Price Magnet is a professional analytical tool designed to identify key support and resistance levels based on statistical Price Density. The indicator analyzes a specified historical period and detects price levels where the market spent the most time. These zones act as “magnets,” attracting price action or forming a structural base for potential reversals. Unlike traditional Volume Profile tools, Price Magnet focuses on price-time d
Pro Gold System Indicator
PEDRO JOAQUIM GONCALVES GOMES
ADVANCED FUNCTIONALITIES: Trend Score (0-100) with visual bar Intelligent signals with adjustable strength (1-10) Risk management with automatic TP/SL Audible and visual alerts Price zones with smooth filling Multi-indicator analysis (RSI, ATR, BB, EMAs) DESIGN FEATURES Modern Visual: Smooth and well-spaced lines (EMA with 2-3px width) Vibrant and professional colors (Sky Blue, Orange, Gold) Modern arrows (code 233/234) for buy/sell signals Configurable dark/light theme Adjustable transparency f
Auto Trade Journal with Screenshots 在准确的那一刻自动截图,记录每一笔交易 交易日志是每位导师都会推荐、却几乎没人能坚持的习惯,因为手动记录费时又容易被跳过。文字日记可以记下数字,却永远无法呈现你入场或出场那一刻图表的真实模样,而经验教训恰恰就藏在那里。 Auto Trade Journal with Screenshots 会自动为整个账户完成这项工作。每当交易开仓、平仓、部分平仓,或止损、止盈被修改时,它都会在那一刻为图表截图,并将完整细节和图片路径写入一行CSV记录。无论是手动交易还是任何智能交易系统的交易,都能一并记录。 兼容 MetaTrader 4 和 MetaTrader 5,在市场中作为独立产品分别销售,请选择与你的终端匹配的版本。适用于任何品种和任何时间周期。 为了在任意品种上截取到合适的图表,它会重复使用你已打开的图表,或临时打开一个新图表,完成截图后再关闭,绝不会影响你自己的图表。它还可以同时在多个时间周期上捕捉同一时刻的画面。CSV文件可直接在Excel、Google表格或任何日志工具中打开,分隔符可自由选择。它绝不会开仓或
NQX Smooth Trend Flip Weekly Bias 是一款适用于 MetaTrader 5 的信号指标:平滑趋势翻转信号(仅顺周线偏向方向发出信号)。 NQX 专有逻辑:检测一段行情后平滑K线的颜色翻转。仅顺周线偏向方向发出信号。它会绘制建议入场位、较短的止损和较远的目标(3:1、5:1、10:1,波段最高可达 20:1);由您决定。 图表上显示的内容 - 在已收盘的信号K线上显示箭头(已收盘的信号绝不重绘)。 - 建议入场位、较短的止损和较远的建议目标(默认为风险的 6 倍),以及 3 x 1、5 x 1 和 10 x 1 参考线。 - 价格触及某一水平时,图表上会显示标签(目标或止损)。 - 显示最近一次信号以及可见历史中出现的信号数量的面板。 - 新信号的弹窗提醒和推送通知(可选)。 NQX 独家逻辑:没有其他任何 NQX 指标使用相同的入场信号与市场过滤器组合,因此其信号为本指标所独有。 设置 - 主要建议目标(风险倍数)及额外目标线(默认为 3 x 1、5 x 1 和 10 x 1)。 - 最小和最大止损距离(ATR 倍数),以及信号保持开启的最大K线数。 -
JTC Smart Gold Indicator is a professional trading indicator designed exclusively for the XAUUSD (Gold) 5-minute timeframe on MetaTrader 5. It focuses on identifying high-quality trading opportunities during the New York session while helping traders maintain a disciplined and structured trading approach. Unlike indicators that generate excessive signals, JTC is designed to prioritise quality over quantity, typically highlighting a small number of carefully selected opportunities during active
Blahtech Market Profile MT5
Blahtech Limited
5 (10)
Was: $249  Now: $99   Market Profile defines a number of day types that can help the trader to determine market behaviour. A key feature is the Value Area, representing the range of price action where 70% of trading took place. Understanding the Value Area can give traders valuable insight into market direction and establish the higher odds trade. It is an excellent addition to any system you may be using. Inspired by Jim Dalton’s book “Mind Over Markets”, this indicator is designed to suit the
Passband Filter Pro Passband Filter Pro is a trend and cycle oscillator for MetaTrader 5. It is built on the Ehlers Super Passband Filter, a band pass filter that removes long term trend drift and short term noise so that only the dominant market cycle remains. The result is a clean oscillator with a color cloud that shows overbought and oversold conditions, cycle turns, and momentum on forex, gold, indices, stocks and crypto. Most traders enter too early or too late. Simple moving averages la
Smart Support And Resistance Indicator See the Market Levels That Matter. Make your chart clearer and your technical analysis more organized with Smart Support And Resistance Indicator — a powerful trading tool designed to help traders identify important support and resistance levels directly on their MetaTrader 5 charts. Whether you trade Forex, Gold, Indices, or other available markets, this indicator helps you focus on key price areas, monitor potential market reactions, and analyze price act
Crash 1000 Scalping Indicator for the Crash 1000 Deriv Synthetic Index. Introduction The Crash 1000 Scalping Indicator is a specialized tool designed for the Crash 1000 index on the Deriv Synthetic market. This indicator is particularly useful for scalping on the M1 timeframe, helping traders to identify precise entry and exit points for buy positions. It is designed to be non-repainting, providing clear signals with audible alerts and push notifications, and is compatible with mobile devices th
概述 RealCost Risk Governor MT5 是一款用于 MetaTrader 5 的账户和交易风控监控工具。它不预测价格方向,也不提供买入或卖出信号。它会根据用户设置的风险规则进行监控,并在图表上显示每日盈亏、浮动盈亏、权益回撤、交易次数、持仓数量、挂单数量、总手数和当前图表点差。 默认模式为仅提醒。只有当用户主动把规则触发后的动作改为保护动作时,工具才会在规则被触发后平掉指定范围的持仓、删除指定范围的挂单,或同时执行这两类操作。保护范围由品种范围和 Magic number 过滤条件控制。 典型使用场景 - 监控账户的每日亏损规则。 - 手动交易时在图表旁边保留一个外部风险面板。 - 在其他 EA 运行时观察浮动亏损、总手数和持仓风险。 - 在一个面板里查看点差、交易次数、持仓和挂单。 - 将风险状态和事件写入本地 CSV 文件,便于之后复盘。 主要功能 - 按账户货币和百分比监控每日亏损。 - 按账户货币和百分比监控浮动亏损。 - 从挂载工具开始计算本次会话的权益回撤。 - 每日新交易次数限制。 - 持仓数量限制。 - 挂单数量显示。 - 总开仓手数限制
GOLD TRACK — MT5 Gold Track is a technical analysis indicator designed primarily for XAUUSD / GOLD trading on MetaTrader 5. It combines multiple market conditions into a structured signal system, helping traders identify potential bullish and bearish setups without relying on a single indicator. Key Features EMA Trend Analysis RSI Momentum Confirmation ️ ATR Volatility Analysis ️ Candle Confirmation ️ H1 Multi-Timeframe Confirmation Market Structure Analysis Liquidity Anal
Equity Sculper EA
Christopher Calmerin
Put your trading profits to work. Equity Sculptor EA is an MT5 trade-management tool that uses new closed profits to gradually reduce losing positions across your account. Account-wide management: All symbols and magic numbers, including manual trades. Two funding modes: Rescue Wallet or Legacy Balance. Flexible settings: Customize profit allocation, trim size and trade selection. Clear dashboard: View your funds, performance and configurations. Persistent tracking: Saved accounting continues af
TradeManager Control Suite Manual trading with structured planning and controlled risk TradeManager Control Suite is a comprehensive trading panel for MetaTrader 5. It helps you prepare trades directly on the chart, calculate position size, place orders and manage open positions according to a plan defined in advance. You remain responsible for every entry. The application does not trade independently and does not use an automated trading strategy. It performs the calculations, sends the orde
GoldPro Max
Taher Ahmed Mohamed Taha Elshafei
GOLDPRO MAX Advanced Multi-Timeframe and Smart Money Market Analysis for MetaTrader 5 GoldPro Max is a professional market analysis indicator for MetaTrader 5 designed to help traders study market direction, price structure, liquidity, market imbalance and potential trading areas from multiple perspectives. The indicator combines Multi-Timeframe Analysis, Smart Money Concepts, Market Structure, Liquidity Analysis, Order Blocks, Fair Value Gaps, Premium and Discount analysis, Smart Analytical Eng
If you've ever stared at a gold chart, done the math in your head three times, and still second-guessed your lot size right before entry - this tool was built for you. Current price: $39 - increases by $10 after every 20 purchases until reaching the final price of $89 . Next price: $49 . Complete Buyer Kit: 34 Professional Resources included at no additional cost. MT5 Presets, PDF Guides, Checklists, Mindmaps, Reference Cards, and Excel Workbooks - built from 8 years of developing structured XAU
VELOS Trading Indicator Precision. Speed. Confidence. The VELOS Trading Indicator is a professional, non-repainting MT5 trading system developed by DC Trading to help traders identify high-probability trading opportunities with confidence. Designed for both beginner and experienced traders, VELOS combines trend analysis, momentum confirmation, and volatility filtering into one intelligent indicator, delivering precise entry and exit signals while reducing false setups. Built for fast-moving m
Laguerre SuperTrend Clouds   adds an Adaptive Laguerre averaging algorithm and alerts to the widely popular SuperTrend indicator. As the name suggests,   Laguerre SuperTrend Clouds (LSC)   is a trending indicator which works best in trendy (not choppy) markets. The SuperTrend is an extremely popular indicator for intraday and daily trading, and can be used on any timeframe. Incorporating Laguerre's equation to this can facilitate more robust trend detection and smoother filters. The LSC uses the
Inverted_Chart_EA Utility Expert Advisor Inverted_Chart_EA creates and maintains a mirror-inverted chart of any symbol and timeframe. It automatically generates a custom instrument (e.g. US30_INV ) and keeps its price history updated in real time, with bars mirrored around a chosen pivot. This utility gives traders a new way to analyze the market from a different perspective by flipping the chart upside down. Why use an inverted chart? Highlight hidden patterns – price formations that look ordin
Structure King AI Signal
Shingala Gautamkumar
Structure King AI Signal Structure King AI Signal is a professional MetaTrader 5 trading indicator designed to help traders analyze market structure, trend direction, multi-timeframe confirmation and trade management from one clean dashboard. Key Features • Market Structure & Trend Analysis • BUY / SELL Signals • Multi-Timeframe (HTF) Confirmation • Entry Price Levels • Dynamic Stop Loss (SL) • TP1 / TP2 / TP3 Levels • ATR Volatility Analysis • ADX Trend Strength Filter • Adaptive Market Filter
可以说,这是您可以为MetaTrader平台找到的最完整的谐波价格形成自动识别指标。它检测19种不同的模式,像您一样认真对待斐波那契投影,显示潜在的反转区域(PRZ),并找到合适的止损和获利水平。 [ 安装指南 | 更新指南 | 故障排除 | 常见问题 | 所有产品 ] 它检测19种不同的谐波价格形态 它绘制了主要,衍生和互补的斐波那契投影(PRZ) 它评估过去的价格走势并显示每个过去的形态 该指标分析其自身的质量和性能 它显示合适的止损和获利水平 它使用突破来表明合适的交易 它在图表上绘制所有样式比率 它实现了电子邮件/声音/视觉警报 受斯科特·M·卡尼(Scott M. Carney)的书的启发,该指标旨在满足最纯粹和最熟练的交易者的需求。但是,它采取了一种使交易更容易的方式:在向交易发出信号之前,它会等待Donchian朝正确方向突破,从而使交易信号非常可靠。 斐波那契投影与向量无关 它实现了电子邮件/声音/推送警报 它绘制了ABCD投影 重要提示: 为了符合 Scott M. Carney先生 的商标申诉,某些图案名称已重命名为不言自明的替代方式, Scott M.
Enhanced Elliott Wave Pro
Magdy Khames Aly Hasan
Enhanced Elliott Wave Pro – Advanced Market Structure & Wave Analysis   Enhanced Elliott Wave Pro is a lightweight, institutional-grade MT5 indicator that eliminates chart clutter by detecting and displaying only the current, active market structure: the 1-2-3-4-5 Impulse wave and the subsequent A-B-C Correction.   Built with classic Prechter wave rules and ATR-adaptive pivot detection, it delivers clean, real-time wave counts without bogging down your terminal.   ――――――――――――――――――――――――――――
NQX Oscillator Hook London
Marcel De Oliveira Farias
NQX Oscillator Hook London 是一款适用于 MetaTrader 5 的信号指标:振荡器钩形信号(仅在伦敦时段发出信号(日内图表))。 NQX 专有逻辑:检测从极端区域拐出的振荡器钩形。仅在伦敦时段发出信号(日内图表)。它会绘制建议入场位、较短的止损和较远的目标(3:1、5:1、10:1,波段最高可达 20:1);由您决定。 图表上显示的内容 - 在已收盘的信号K线上显示箭头(已收盘的信号绝不重绘)。 - 建议入场位、较短的止损和较远的建议目标(默认为风险的 5 倍),以及 3 x 1、5 x 1 和 10 x 1 参考线。 - 价格触及某一水平时,图表上会显示标签(目标或止损)。 - 显示最近一次信号以及可见历史中出现的信号数量的面板。 - 新信号的弹窗提醒和推送通知(可选)。 NQX 独家逻辑:没有其他任何 NQX 指标使用相同的入场信号与市场过滤器组合,因此其信号为本指标所独有。 设置 - 主要建议目标(风险倍数)及额外目标线(默认为 3 x 1、5 x 1 和 10 x 1)。 - 最小和最大止损距离(ATR 倍数),以及信号保持开启的最大K线数。 -
该产品的买家也购买
Trend Sniper X
Sarvarbek Abduvoxobov
4.86 (44)
Trend Sniper X 是一款适用于 MetaTrader 5 的多周期趋势跟踪指标,可帮助交易者清晰精准地识别趋势方向和潜在的反转点。 适用于 MT4: https://www.mql5.com/en/market/product/193245 价格信息: 当前价格为促销价,随着后续更新和新功能的推出,价格可能会有所变动。 赠品优惠: 购买后联系作者,即可免费获取该指标的 Auto-Trade Assistant EA(自动交易助手 EA)。 Code2Profit 频道 通过多时间框架分析掌控市场! 如何使用 Trend Sniper X 最大化您的胜率:核心规则与交易时段技巧 技术规格 平台 MetaTrader 5 指标类型 多时间周期趋势指标 运行时间周期 任何图表时间周期,可独立选择更高的时间周期 (M1–MN1) 主要交易品种 外汇、黄金 (XAUUSD) 及其他差价合约 (CFD) 推荐账户 任何账户类型 可视化 彩色趋势蜡烛 (买入/卖出/微弱/变化) + 买入/卖出箭头 附加模块 交易时段方框 (悉尼、东京、伦敦、纽约) 主要功能 多时间周期趋势分析: 直接在
全新王者降临 - 指标 + 订单管理提示(TP1 + TP2 + TP3)+ 可选 Telegram 信号发送器 INCLUDED(免费) (完整交易与信号系统) 我们最强的黄金 EA: Gold Slayer 该指标包含先进的交易策略、可自定义订单管理系统,以及结合 Envelope 扩展的均值回归系统,并通过 RSI 等多重智能确认过滤器进行验证,以捕捉高概率反转入场机会,提供 BUY 与 SELL 信号。 你不仅能够学习如何交易,还能学会如何高效管理多个仓位,并利用之前盈利的持仓来覆盖亏损交易。 专为 M5 周期打造并优化,在 BTCUSD 和 XAUUSD 上表现尤为出色,因为这些市场的流动性能够让信号更加干净、可靠。 该指标会自动生成清晰的多头(Long)与空头(Short)信号,同时基于 ATR 自动计算入场位、止损位和止盈位,让风险管理从一开始就融入系统之中。 多 TP 系统设有三个渐进式目标位,你可以在 TP1 锁定部分利润、在 TP2 继续持仓,并在更大的行情中将仓位持有至 TP3,而这正是平均风险回报比真正开始大放异彩的地方。 默认参数开箱即用,已经针对稳定表现进行
Smart Trend Trading System — MetaTrader 5 购买后,请在 MQL5 上给我发消息,即可免费获得 Smart Universal Expert Advisor,以及在线课程、PDF 手册和私人群组访问权限。 STTS 将趋势方向、入场和出场信号、反转区域及重要价格水平集中呈现在图表上。您可以根据系统手动交易,也可以连接单独的兼容 EA,按照您选择的设置自动执行交易。 一套系统,四种交易思路 STTS 将交易方法分为四大类: • 剥头皮交易 — 跟踪短期信号和市场波动。 • 趋势交易 — 评估方向,寻找趋势中的交易机会。 • 反转交易 — 识别潜在的转折区域和方向变化。 • 成交量交易 — 利用成交量相关信息评估市场活跃程度。 入场和出场箭头、趋势信息、支撑与阻力位及反转区域,帮助您直接在图表上分析交易形态。 先从一种方法开始。了解其信号和设置后,再探索其他方法。 从信号到自动化 Smart Universal Expert Advisor 可连接 STTS,让您自动执行受支持的交易信号。 启用自动交易前,请配置指标连接、仓位大小和交易管理设置
Entry Points Pro for MT5
Yury Orlov
4.55 (152)
Entry Points Pro 会在您下单之前,告诉您在哪里入场、止损放在哪里、用多大的手数交易。 价格 现在 199 USD,按此价格出售 8 份,之后为 249 USD。最终价格为 349 USD。 我靠交易市场赚钱,并公开展示,所以我不需要把这个指标卖给所有人。它是为独立思考的交易者准备的工具,而不是一个神奇按钮。 没有突破,就没有交易。灰色箭头表示信号已取消:价格没有突破信号K线,因此没有入场,也没有亏损。 箭头在 K 线收盘时出现,并且不会重绘。只有两项设置:您的本金和每笔交易的风险。 付款前先验证:免费演示版可在 MT5 策略测试器中运行,只需两分钟。购买后,我会亲自帮您完成设置。 2019 年,我向全世界展示了这款指标的能力。我按它的信号手动交易,用的是真实账户,全程公开——账户在 Myfxbook 上接受监控,我还在 Facebook 上详细记录了这次实验。结果:10,000 美元在四个月内变成了 941,411 美元。风险是我有意设得极高的——回撤一度达到 54%,因为在我们这一行,利润和风险总是相伴而行。Myfxbook 的截图就是图库中的第一张图片。 看来
M5 Sniper
MeanFX
5 (4)
让您的交易优势尽在视野之中! M5 Sniper 是 MeanFX 推出的一款全新指标。它将 精准的交易信号 与 自适应 TP/SL 水平 相结合——从而创造出最佳的统计交易机会! 每售出 5 份,价格上涨一次,下一价格为 69$ 购买后请给我发消息,以获取技巧/指南和奖励 EA 它有哪些突出优势? 经过验证的统计表现 ,适用于 Gold XAUUSD( 几乎适用于每一种资产 ,专注于掌握一个时间周期,而不是试图面面俱到却无法获得稳定的结果) 每天每个交易品种 1 至 8 笔交易 ,具有较高的胜率百分比,并让所有统计优势站在我们这一边 图表上 仅显示已确认的 BUY 和 SELL 信号 自适应 TP 和 SL 水平 ,由指标针对每笔交易生成 平均胜率 75%+ 平均 Signal Ratio 最低 1.1+ 警报 和通知也会发送至 手机 **适合 Prop Firm(资金管理公司)**的交易方式 易于理解——适合 所有经验水平 的交易者 创作者提供的个人支持 100% 不重绘、不重新绘制、不滞后 奖励自动化 Expert Advisor(EA) 背后的策略: M5 Sniper 基于
Zoryk Gold
Reda El Koutbane
4.79 (19)
折扣将在 24 小时后结束——下一价格为 69 美元 ZORYK — MetaTrader 5 专用高级 XAUUSD 黄金信号系统 你一定熟悉这种感觉。 你花了很多时间分析黄金,等待合适的入场机会。终于开仓后,价格却立刻朝相反方向移动。你过早平仓、移动止损,或者只犹豫了几秒钟。随后,市场却在没有你的情况下到达了你原本预期的目标。 问题并不总是方向判断错误。 真正的问题是缺乏确定性。 你不知道准确的入场位置在哪里。 你不知道什么时候交易逻辑已经失效。 你不知道应该先锁定较近的利润,还是继续等待更大的行情。 你也不知道当前信号是否足够强,还是自己只是在强行寻找交易机会。 黄金市场变化非常快。一个没有明确计划的好想法,可能在几秒钟内变成错误的交易决定。 ZORYK 正是为了解决这个问题而开发。 什么是 ZORYK ZORYK 是一套完整的 XAUUSD 黄金信号与交易计划系统,专门为 MetaTrader 5  和 M5 时间周期 开发。 它不是一个只显示 BUY 或 SELL 箭头,然后让你独自决定其余所有内容的简单指标。 每个确认后的信号都可以在图表上显示完整的可视化交易计划,包
Gann Made Easy MT5
Oleg Rodin
5 (13)
Gann Made Easy   是一个专业且易于使用的外汇交易系统,它基于使用先生理论的最佳交易原则。 W.D.江恩。该指标提供准确的买入和卖出信号,包括止损和获利水平。您甚至可以使用推送通知在旅途中进行交易。 购买后请联系我,即可免费获得交易指导和超棒的额外指标! 您可能已经多次听说过江恩交易方法。通常 Gann 的理论不仅对于新手交易者而且对于那些已经有一定交易经验的人来说都是非常复杂的东西。这是因为江恩的交易方法在理论上并不那么容易应用。我花了几年时间来完善这些知识,并将最好的原则应用到我的外汇指标中。 该指标非常易于应用。您所需要的只是将其附加到您的图表并遵循简单的交易建议。该指标不断进行市场分析工作并寻找交易机会。当它检测到一个好的入口点时,它会为您提供一个箭头信号。该指标还显示止损和获利水平。 换句话说,当您像先生一样进行交易时,该指标会为您提供最佳江恩建议。江恩亲自告诉你此时此刻该做什么。但最好的部分是您不需要了解任何有关江恩交易原则的知识,因为该指标会为您完成整个市场分析工作。
Ultra Indicator
Ihor Otkydach
5 (1)
ULTRA 是一項採用「一站式」運作模式的技術指標——它能獨立分析市場、產生交易訊號、顯示設定停損單的價位,並建議何時平倉以鎖定獲利或將損失降至最低。 換句話說,無論您是否懂得分析市場、判定價位(該將停損設在哪裡),或是對資金管理感到棘手,都無妨。ULTRA 會為您處理所有這些事情! 買家專屬好禮 : 購買 ULTRA 指標後,請透過私訊聯繫我,即可免費獲贈「ULTRA BOT」。這是一款特別設計的工具,能協助您根據該指標發出的訊號來管理已開倉的交易(它會為每筆交易設定停損點,並依照策略規則自動平倉,以爭取最佳交易結果)。 我還會為買家提供各種資產的預設參數,讓該指標能發揮最大效能。請透過私訊聯繫我,免費獲得這些超級好處! ULTRA 策略的運作方式 ULTRA 指標會分析歷史價格數據(涵蓋約過去 4 年),並自動學習辨識波段反轉,以便在實際交易中為您創造最大利潤。 該指標的訊號絕不會重新繪製!!一切都盡可能做到真實且直觀! ULTRA 指標運用特殊的虛擬化演算法,根據歷史數據計算所有訊號的結果,並將其交易成果顯示於儀表板上。這意味著您甚至在開始交易之前,就能預先了解 ULTRA 指標
SuperScalp Pro
Van Minh Nguyen
4.54 (37)
SuperScalp Pro - Professional Multi-Layer Confluence Scalping System SuperScalp Pro 是一款先进的剥头皮交易指标,在经典 Supertrend 的基础上加入了多种智能确认过滤器。它可以帮助您识别成功概率更高的 Buy/Sell 交易机会,同时显著减少虚假信号。 清晰的 Buy 和 Sell 箭头会直接显示在图表上,并实时自动计算基于 ATR 的 Stop Loss 和 Take Profit 水平。 购买后,请通过 MQL5 给我发送消息,即可免费获取 SuperScalp Pro Auto Trader EA、用户指南以及私人群组的访问权限。 下载推荐的设置文件: [Set File] 完整文档请参阅产品博客: [User Guide] 加入官方频道,获取最新更新: [Official Channel] SuperScalp Pro 如何工作? 只有当多个确认层同时满足条件时,指标才会生成信号(趋势 + 动量 + 成交量 + 波动率 + 高时间周期趋势)。 Multi-Timeframe (MTF)
SMC Intraday Formula
VividMind Digital Solutions
5 (26)
让我们先坦诚一点。 没有任何一个指标可以单独让你实现盈利。如果有人告诉你可以,那他是在向你兜售一个梦想。任何显示完美买卖箭头的指标都可以被做得看起来毫无瑕疵——只需要放大历史中的某一段并截取成功交易的截图。我们不会这样做。 SMC Intraday Formula 是一个工具。 它为你读取市场结构,标记出概率最高的价格区域,并用简单直白的语言准确告诉你当前智能资金的行为轨迹。你仍然需要做决定。你仍然需要执行交易。但现在,你是带着精确性执行,而不是靠希望。 我们已经在黄金(XAUUSD)以及主要外汇货币对的日内剥头皮交易中使用该指标将近三年。这是我们在 M1、M5、M15 和 M30 上的日常主力工具。它之所以有效,是因为它不试图预测未来——它展示的是当前正在形成的高概率交易机会,并解释 为什么 。 它与其他所有指标有什么不同? 大多数交易指标只做一件事。移动平均线交叉。振荡指标触及某个水平。出现一个箭头。你进场交易。你亏损。你责怪指标。重复。 SMC Intraday Formula 将多个机构级概念整合为一个统一的市场解读: - 斐波那契共振引擎 不只是普通的斐波那契水平——该指标
GoldenX Entry MT5
VividMind Digital Solutions
5 (17)
GoldenX Entry 是一款用于 MT5 的指标,包含自适应 Smart Entry Trend 算法、信号评分系统、市场状态识别器以及波动率过滤器。每个信号都包含计算得出的入场位、三个止盈位(TP1、TP2、TP3)以及止损位。它基于多个分析层构建,旨在适应不同市场条件,将多层分析系统与内置优化器及统计跟踪系统相结合。该指标基于风险收益比(RR)指标和历史交易行为提供量化分析。 开始使用非常简单——在所选时间周期上运行优化器,然后在图表上开始使用该指标。 核心功能 GoldenX Entry 将信号引擎与内置交易管理及历史统计跟踪整合在同一图表中: - 内置优化器: 优化器可在图表上单击运行。它通过两阶段搜索流程测试200种参数组合——先进行探索,再进行优化——并在完成后自动应用选定配置。结果会按时间周期缓存,因此当返回已优化的周期时,会立即恢复相同设置。 - 黄金品种自动周期识别: 将指标加载到任何 XAUUSD 图表(M1 到月线)。系统会自动识别当前周期并加载对应预设。共包含9个时间周期配置文件,专为黄金在标准周期上优化设计。切换周期时,参数会自动调整。 - 资金参考面
Gold Trend Coach MT5
Cristhian Alexander Gaibor Cuasquer
4.27 (11)
MetaTrader 5 黄金(XAUUSD)买卖信号,不重绘。每个信号都自带止损和三个止盈。Smart Money Concepts 过滤,实时标出 BOS 和 CHoCH,让你顺着结构交易,而不是逆势硬扛。面板上的实时导师,从入场到 TP3 一步步带着你走。信号直接推送到你的手机和你自己的 Telegram 频道。这就是 Gold Trend Coach。从此不再孤军奋战。 购买即送买家礼包: 1. Telegram Alert Bridge: 信号推送到你自己的 Telegram 频道,附图表截图和每日报告。 2. 使用手册和安装设置指南。 如何领取: 礼包不在下载文件里。购买后通过 MQL5 站内信联系我,当天发给你。 $39 和 $45 的首发份额已售罄。现价 $59,仅限接下来 10 份,之后 $79。 先说实话。 我自己不用的指标,绝不会拿出来卖。我每天都用 Gold Trend Coach 手动交易黄金,周期 M1、M5 和 M15,只在出现顺我方向的 CHoCH 或 BOS 之后才接信号。 你大概已经试过几十个黄金指标。大多数只给你一个箭头,然后把最难的部分丢给你:
Boba Analysis Suite
Trade Ready Solutions LLC
5 (2)
Boba Analysis Suite Boba Analysis Suite 是一款适用于 MetaTrader 5 的分析指标。它将市场结构、关键价格区域和整体市场背景整合到同一图表视图中。 该指标源于交易及交易教学的实践经验,旨在帮助用户建立有条理的分析流程:评估市场方向、识别重要价位,并结合多个时间周期进行分析。 结合市场背景进行分析 单个信号的意义取决于市场背景。Boba Analysis Suite 帮助用户将当前图表状况与更大范围的市场结构相结合,并根据预先制定的规则评估交易思路。 分析功能包括: **趋势与市场结构:**评估市场方向及相关结构背景。 **关键价格区域与价位:**在图表上直观标示值得进一步分析的重要区域。 **多时间周期:**整合不同时间周期的信息,评估整体市场背景。 **可视化分析流程:**直接在图表上查看分析信息。 自主做出交易决策 Boba Analysis Suite 适合希望系统分析图表并结合多个时间周期信息的交易者。 该指标用于辅助分析,不会开仓或平仓,也不能替代交易策略或风险管理。每一笔交易的决策均由用户自行做出。 使用与许可 平台:Meta
FX Power MT5 NG
Daniel Stein
5 (33)
FX Power:分析货币强度,助您做出更明智的交易决策 概述 FX Power 是一款专业工具,帮助您全面了解主要货币和黄金在任何市场条件下的真实强度。通过识别强势货币用于买入,弱势货币用于卖出, FX Power 简化了交易决策,并帮助您发现高概率的交易机会。不论您是想跟随趋势还是通过极端的 Delta 值预测反转,这款工具都能完美适应您的交易风格。别再盲目交易——用 FX Power 让您的交易更加智慧。 1. 为什么 FX Power 对交易者极具价值 实时货币和黄金强度分析 • FX Power 实时计算并显示主要货币和黄金的相对强度,助您全面了解市场动态。 • 监控领先或落后资产,轻松识别值得交易的货币对。 全面的多时间框架视图 • 跟踪短期、中期和长期时间框架的货币和黄金强度,以便将您的交易策略与市场趋势保持一致。 • 无论是快进快出的短线交易还是更长期的投资策略, FX Power 都能为您提供所需的信息。 Delta 动态分析用于趋势和反转 • 极端 Delta 值常常预示反转机会,而平缓的 Delta 变化则确认趋势延续。 • 使用 Delta 分析,轻
FiboSniper Pro
Van Minh Nguyen
5 (4)
FiboSniper Pro – Multi-Filter Fibonacci System with Auto SL/TP and Control Panel FiboSniper Pro 是一款技术指标,将动态 Fibonacci Envelopes 与多个确认过滤器相结合,以生成经过筛选的 Buy 和 Sell 信号。Fibonacci 水平基于 Moving Average 和 ATR 计算,然后通过 ADX、EMA、RSI、ATR、Volume、Time 和 Candle 结构进行过滤。该指标直接在图表上显示基于 ATR 自动计算的 Stop Loss 和 Take Profit 水平,并提供交互式控制面板,以便快速调整参数。 购买后,请通过 MQL5 给我发送消息,即可免费获取 Auto Trader X,以及有关如何将该指标的交易信号自动化的说明。 用户指南和设置文件: [Click here] 完整文档请参阅产品博客: [Click here] 加入官方频道获取最新更新: [Click here] 专为偏好结构化入场和清晰风险管理的交易者设计,适用于 Gold (XAU
M1 Sniper MT5
Oleg Rodin
5 (7)
M1 SNIPER   是一款易于使用的交易指标系统。它是一个专为 M1 时间框架设计的箭头指标。该指标可以作为独立的系统在 M1 时间框架下进行剥头皮交易,也可以作为您现有交易系统的一部分使用。虽然该交易系统专为 M1 时间框架交易而设计,但它也可以用于其他时间框架。我最初设计此方法是为了交易 XAUUSD 和 BTCUSD。但我发现这种方法在其他市场交易中也同样有用。 指标信号既可以顺势交易,也可以逆势交易。我教授一种特殊的交易技巧,帮助您利用指标信号进行双向交易。该方法基于使用特殊的动态支撑位和阻力位区域。 购买后,您可以立即下载 M1 SNIPER 箭头指标。此外,我还为所有 M1 SNIPER 工具用户免费提供下方屏幕截图所示的 Apollo Dynamic SR 指标!这两个指标的组合可以帮助您更轻松、更准确地利用 M1 时间框架进行交易。 购买后请联系我,免费获取交易提示和奖励指标! 祝您交易成功!
Apex Patterns PRO 购买指标 — 免费获取基于该指标的 Expert Advisor。 自我优化的图表形态与突破分析智能 传统的形态扫描器依赖固定输入,在市场波动和结构发生变化时通常表现不佳。 Apex Patterns PRO 旨在适应不断变化的市场条件,将结构性图表形态识别、动量过滤和统计自我优化结合到一个分析框架中。 适应性扫描引擎 自我优化形态模式 在近期历史数据中自动搜索合适的形态参数,使指标能够根据当前市场行为调整其结构检测,而不是使用静态配置。 智能突破过滤 将经典形态识别与动量、成交量和价格行为指标相结合。引擎不会同等对待每次突破,而是评估潜在的市场结构,以识别符合当前统计环境的交易设置。 主要功能 固定的、不重绘的实时信号 自我优化的形态检测参数 丰富的图表结构库(顶部/底部、头肩顶/底、三角形、楔形) 基于动量和成交量的突破过滤 基于市场结构的动态止损和止盈水平 图表信号和实时性能指标 标准的推送、电子邮件和平台提醒 专为适应不断变化的市场条件而设计,而非依赖永久固定的参数 核心理念 目标不是将静态的几何形状强加于动态的市场。 目标是让历史市场数据
SQN Max indicator for MT5 by ITC
Renaud Herve Francois Candel
Sqn Max Indicator Sqn Max is an exclusive indicator to trade the market with high effectiveness. The indicator is based on price action, volatility and trend. This indicator is as simple as possible but not too simple. The indicator can generate alerts to ease the trading process. You don't have to stay all day in front of your screen. The indicator can be used with any class of assets and with any time frame. It is possible to achieve better results trading our list of selected assets. We achi
Adaptive Price Action Engine 买指标,免费送EA 自适应多时间框架趋势与K线形态智能分析系统 市场环境始终在变化,不同的市场阶段中,并非所有 Price Action 形态都具有相同的参考价值。 Adaptive Price Action Engine 旨在适应不断变化的市场条件,将 趋势结构、多时间框架分析、K线形态与统计优化 整合到一个统一的分析框架中。 两种自适应模式 Dual Alpha Trend Mode(双 Alpha Trend 模式) 自动搜索适合的 Alpha Trend 参数,并结合低周期与高周期市场结构,使指标能够根据近期市场行为动态调整趋势识别。 Candlestick + Alpha Mode(K线 + Alpha 模式) 将 Alpha Trend 市场状态与 22种多空K线形态 相结合。系统不会简单地对所有形态一视同仁,而是对不同的形态组合进行统计评估,并识别在特定市场环境下表现出更强历史统计特征的配置。 主要功能 趋势参数自动优化 多时间框架市场状态分析 22种多头与空头 Price Action K线形态 对数千种可能
Atomic Analyst MT5
Issam Kassas
4.51 (65)
Atomic Analyst — MetaTrader 5 购买后,请在 MQL5 上给我发消息,即可免费获得 Smart Universal Expert Advisor,以及在线课程、PDF 手册和私人群组访问权限。 Atomic Analyst 将价格行为、趋势方向、入场和出场信号、止损位及多个止盈位集中呈现在图表上。 看清信号,理解交易形态 Atomic Analyst 将分析结果整理为清晰的可视化信息: • 买入和卖出箭头,用于识别潜在的入场机会。 • 止损位和多个止盈位,帮助规划交易。 • 趋势、强度和动量读数,用于评估市场方向。 • 多时间周期分析,用于比较更广泛的市场背景。 • 彩色K线和提醒,帮助您跟踪变化的市场条件。 结合辅助分析查看信号,再判断该交易形态是否符合您的交易规则。 从短期形态到更大级别的行情 您可以将 Atomic Analyst 用于剥头皮交易、日内交易,或跟踪持续时间更长的市场走势。 建议从 H1 时间周期开始。建议交易品种包括 EURUSD、AUDUSD 和 XAUUSD。 从信号到自动化 Smart Universal Expert A
Tokyo mt5 Indicator
Vasiliy Strukov
5 (15)
Tokyo Indicator(东京指标)直观地展示了趋势方向、潜在交易信号及市场状况。 其采用颜色编码的阶梯式趋势线,以蓝色标识看涨阶段,以洋红色标识看跌阶段。配套的方向箭头会在趋势发生变化时,标示出潜在的买入与卖出机会。 内置的综合仪表盘将当前信号、市场倾向、动能、波动率及信号质量整合于同一视图中,方便交易者在观察价格走势的同时评估指标数据,无需在不同面板间切换。 凭借清晰的图表显示和简洁的市场概览,Tokyo Indicator 支持以系统化的方式进行趋势分析与交易确认。 适用于任何时间周期及各类交易品种,尤其适合黄金交易。 购买后请立即联系我,以获取专属赠品!您可以免费获得我们的“强力支撑与趋势扫描”(Strong Support and Trend Scanner)指标,请私信我! 设置说明与使用手册请见此处。 请注意:我不会在 Telegram 上出售我的 EA 或特殊参数设置(set files);我的 EA 仅在 Mql5 平台上提供,而参数设置文件仅在我的博客(此处链接)上发布。请务必警惕诈骗,切勿从他人处购买任何参数设置! 设置 ShowHUD —— 在图表上显示
下一次更新 — 版本 2.52 即将推出![全新功能] 准备迎接 4 项重大新功能,全面提升您的市场分析能力与交易流程! 我们将通过 4 项全新功能,进一步提升市场分析水平,满足您的交易需求。现为您介绍: 1. TRADE OVERVIEW DASHBOARD 2. CONFLUENCE AT ZONE 3. STRONG & WEAK HIGH/LOW 4. OTE 1. TRADE OVERVIEW DASHBOARD 一个帮助您更轻松地了解整体市场状况的仪表盘,为您的交易决策提供参考指引,帮助您系统地分析市场并规划交易,所有信息尽在一个屏幕中。 多时间周期市场概览(Multi-Timeframe Market Overview) 更清晰地了解市场方向与价格结构 快速查看市场状况 为系统化市场分析和入场规划提供指引。 2. CONFLUENCE AT ZONE 当价格进入关键区域时……您将了解有多少项支持因素相互吻合。 关键区域是交易决策至关重要的地方。但仅仅是价格进入某个区域还不够。此功能可帮助您在入场交易前,识别相互吻合的因素,包括信号及其他相关因素,从而进行更全面的分析,并
Divergence Bomber
Ihor Otkydach
4.89 (94)
购买该指标的每位用户将额外免费获得以下内容: 原创工具“Bomber Utility”,该工具会自动跟踪每一笔交易,设置止损和止盈点,并根据策略规则自动平仓; 适用于不同交易品种的指标设置文件(Set 文件); 三种不同风险模式下的 Bomber Utility 设置文件:“最低风险”、“平衡风险” 和 “观望策略”; 一套详细的 视频操作手册,帮助您快速完成安装、配置并开始使用本交易系统。 注意: 要获取以上所有赠品,请通过 MQL5 的私人消息系统联系卖家。 我为您介绍原创的自定义指标 “Divergence Bomber”(背离轰炸机),它是一套基于 MACD 背离交易策略 的“全功能”交易系统。 该技术指标的主要任务是识别 价格与 MACD 指标之间的背离,并发出交易信号(包括推送通知),指示未来价格可能的运动方向。平均而言,这些信号的准确率超过 98%。有关该指标如何工作的详细说明,请观看本页面上的视频演示。 该系统使用 止损订单 和 动态回撤平仓机制 来管理交易。 Divergence Bomber 指标的主要特点: 支持交易的品种: AUDCAD、AUDCHF、AUDS
Power Candles MT5
Daniel Stein
4.58 (12)
Power Candles V3 - 自我优化的强度指标 Power Candles V3 把货币与品种的强度直接转化为图表上可执行的交易方案。指标不再仅根据强度给K线着色,而是在后台持续运行实时自动优化,为您正面对的品种给出最佳 Stop Loss、Take Profit 与信号阈值。一键采用,Entry、Stop Loss、Take Profit 线就以精确价格绘制在图表上,提醒消息中直接包含方向。 本工具是 Stein Investments 生态系统的一部分 - 18+ 款工具,加上 Max,您的一对一 AI 交易导师。  随时在线,深入了解每一款指标,在您需要梳理思路的那一刻就在那里。  立即认识他: https://stein.investments 每根收盘K线运行 3,000+ 次交易模拟。9 种强度状态。2 种策略并行测试。一键采用最优配置。 为什么需要这个 大多数强度指标只给您一个数值,然后留下三个问题:相信哪个阈值、用哪个 Stop Loss、走哪个交易方向。Power Candles V3 在每根收盘K线上自动回答这些问题。结果就是一个完整的交易方案 -
货币强度向导是一个非常强大的指标,为您提供成功交易的一体化解决方案。该指标使用多个时间范围内所有货币的数据来计算这个或那个外汇对的力量。此数据以易于使用的货币指数和货币电力线的形式表示,您可以使用它们来查看这种或那种货币的力量。 您所需要的只是将指标附加到您要交易的图表上,该指标将向您显示您交易的货币的真实强度。该指标还向您显示买卖量压力的极值,您可以在顺势交易时利用这些压力。该指标还显示了基于斐波那契的可能目标。该指标可用于各种交易时间范围。该指标支持各种货币对的交易。   该指标为您提供所有类型的警报,包括推送通知。 购买后请联系我。我将与您分享我的交易技巧,并免费为您提供丰厚的红利指标! 祝您交易愉快,获利丰厚!
Unix Scalper
Issam Kassas
4 (4)
Unix Scalper — MetaTrader 5 购买后,请在 MQL5 上给我发消息,即可免费获得 Smart Universal Expert Advisor,以及在线课程、PDF 手册和私人群组访问权限。 发现交易形态,看清交易计划,选择执行方式。 UNIX Scalper 将市场分析、BUY/SELL/WAIT 决策以及 Entry、Stop Loss、TP1 和 TP2 水平集中在一个清晰的面板中。 看清信号与交易计划 • 明确的决策:BUY、SELL 或 WAIT。 • 明确的价格水平:Entry、Stop Loss、TP1 和 TP2。 • 多时间周期概览:比较面板中各时间周期的信号。 • 辅助分析:趋势、动量、成交量、波动率、支撑与阻力,以及市场质量。 • 灵活的布局:Minimized、Compact、Standard 或 Full。 查看信号,检查价格水平,再判断该交易形态是否符合您的交易规则。 从黄金和比特币开始 建议首先使用的交易品种:XAUUSD 和 BTCUSD。 探索短期剥头皮交易和较高时间周期分析。选择历史K线范围,通过表现曲线查看所选设置
Crystal Heikin Ashi Signals
Muhammad Jawad Shabir
5 (5)
Crystal Heikin Ashi Signals—Professional Trend & Signal Detection Indicator Advanced Heikin Ashi Visualization with Intelligent Signal System for Manual & Automated Trading Final Price: $149 ---------> Price goes up $10 after every 10 sales . Limited slots available — act fast . Overview User Guide PDF Crystal Heikin Ashi Signals is a professional-grade MetaTrader 5 indicator that combines pure Heikin Ashi candle visualization with an advanced momentum-shift detection system. Designed for both m
Auto Optimized SpeedAngle 是一款机构级的动量向量化系统,通过持续的前瞻优化(Walk-Forward Optimization, WFO)彻底消除了曲线拟合(curve-fitting)。该指标没有采用在市场 状态转换时容易失效的静态输入参数,而是利用出样外验证(Out-of-Sample, OOS) dynamically 动态重新校准设置,从而确保显示的 信号代表真正的统计优势,而非历史巧合。 核心机构级架构 前瞻优化引擎(Walk-Forward Optimization Engine): 核心算法持续扫描数千种回溯周期(lookback)与阈值组合,严格将数据划分为样本内(in-sample)和样本外(out-of-sample)。只有当参数配置在未知数据环境中证明具备数学优越性时,系统才会对其进行 adoption。 量化目标函数(Quantitative Objective Functions): 优化引擎不一味追求绝对毛利,而是聚焦于机构级的稳定性指标。用户可针对系统质量数(SQN)、期望值(每笔交易的平均 R 倍数)或净 R 值进行优化,从而优
Smc Pro ToolKit
Talal N Z Aljarusha
5 (14)
SMC PRO TOOLKIT — 智能资金分析与结构化交易规划 SMC Pro ToolKit 是一款面向 MetaTrader 5 的专业智能资金概念(Smart Money Concepts / SMC)分析工作空间。 它将市场结构、多周期分析、机构级价格区域、交易机会评估、确认工具、成交量背景、提醒系统和风险规划整合在一个结构清晰的图表环境中。 一个工作空间,多层确认,一套结构化交易计划。 打开完整用户指南 多条件交易机会引擎 SMC Pro ToolKit 的核心是一套 多条件交易机会引擎 。 该引擎不会依赖单一指标或单一市场事件,而是通过多个层面的市场信息,对潜在交易机会进行综合评估。 系统会分析市场结构和背景条件,将各项结果整合为 交易机会质量评分 ,并且只有在所需确认框架完整成立后,才会展示相应的交易思路。 市场背景 → 多周期一致性 → 智能资金区域 → 确认信号 → 质量评分 → 交易计划 当交易机会满足条件时,SMC Pro ToolKit 可以直接在图表上生成完整的交易计划,包括: 买入 / 卖出方向 入场价 止损价 止盈价 风险回报比 交易机会质量
Dynamic Forex28 Navigator MT5
Bernhard Schweigert
5 (1)
多货币强度与动量指标 MT5 Dynamic Forex28 Navigator 是我们长期受欢迎的指标的演进,把五种力量合而为一: Advanced Currency Strength28 Indicator(700 条评价) Advanced Currency IMPULSE with ALERT(530 条评价) Currency Strength EXOTICS GOLD Impulse with Alert CS28 Combo Signals(当前赠品) 无需购买四个指标并把它们堆在图表上。一切都合并在一个强大的指标中:28 个 Forex 货币对的强度、引领它们的市场动量,以及两者的警报——在一个窗口中,在一张图表上。 上述程序在 MQL5 Market 上合计获得超过 1,200 条评价,自 2016 年以来一直是 MT4 社区的一部分。Dynamic Forex28 Navigator MT5 延续同样经过验证的逻辑。 为 MetaTrader 5 完全重建——专为利用 MT5 原生多品种架构而设计。 用户手册: https://www.mql5.com/en/blo
作者的更多信息
Simba Gravity Signal
Emmanuel Ndacyayisenga
SIMBA GRAVITY SIGNAL Find Where Price Has Weight Every trader has experienced it. You open a chart and begin marking levels. Support. Resistance. Previous highs. Previous lows. VWAP. Higher timeframe structure. Before long, the chart is covered with lines. The real challenge is no longer finding information. The challenge is knowing which information actually matters. SIMBA GRAVITY SIGNAL was built to solve that problem. Instead of treating every level equally, SIMBA analyzes multiple layers of
FREE
Simba Prop Firm EA
Emmanuel Ndacyayisenga
SIMBA PROP FIRM EA  A Smarter Approach to Prop Firm Challenges and Funded Account Management Trade with a Plan. Manage Risk with Precision. Protect Every Opportunity. Passing a prop firm challenge is one objective. Keeping the funded account, managing drawdown, and building consistent trading performance is another. SIMBA PROP FIRM EA is designed to help you approach both with a structured, risk-first trading system. Built for MetaTrader 5, SIMBA combines multi-factor trade selection, automated
Simba Market Picker
Emmanuel Ndacyayisenga
SIMBA MarketPicker SIMBA MarketPicker is a MetaTrader 5 indicator designed for market scanning, comparison, and market selection . It is provided free of charge and is intended to help traders organize multiple instruments in one view, compare their current technical conditions, and identify markets that may deserve further analysis. iInstead of examining every symbol individually, MarketPicker provides a structured view of configured markets and applies the same analytical framework across them
FREE
Simba Bot Scanner
Emmanuel Ndacyayisenga
SIMBA BOT SCANNER EA : Multi-Symbol MT5 Expert Advisor Scan Multiple Markets. Identify Opportunities. Automate Your Trading. One EA. Multiple Markets. Complete Trading Management. SIMBA BOT SCANNER is a powerful multi-symbol Expert Advisor for MetaTrader 5, designed for traders who want to identify trading opportunities across multiple markets without spending hours monitoring charts manually. Combining intelligent setup scoring, multi-timeframe analysis, automated execution, risk-based positio
SIMBA Manual Assistant Pro You Already Know How to Enter. Now Manage the Trade With a Plan. You already have a trading strategy. Maybe you trade support and resistance. Maybe breakouts, price action, moving averages, market structure, supply and demand, or something completely different. You know how you want to enter. But what happens after you enter? Should you move your stop-loss to break-even? Should you take partial profit? Should you let the trade run? Is that pullback normal, or is the m
Simba Price Navigator
Emmanuel Ndacyayisenga
SIMBA Price Navigator Stop asking “Buy or Sell?” — start asking “Where is price going, and what would prove me wrong?” You can have a great trading strategy and still struggle with one simple question: Where is price likely to go next? Your strategy may tell you when to enter. Your indicators may tell you the trend. Your Fibonacci levels may show important areas. But what about the destination ? That is where SIMBA Price Navigator comes in. SIMBA Price Navigator is an MT5 analysis indicator desi
SIMBA POSITION MANAGER PRO You already know how to enter. SIMBA helps you manage what happens next. After more than 5 years of trading, I have learned something that many traders discover the hard way: Finding an entry is not the hardest part of trading. Managing the position after you enter is. There is almost nothing more frustrating than closing a good trade too early... Only to watch price continue directly toward the take-profit you originally planned. And there is almost nothing worse than
Simba Cloud EA
Emmanuel Ndacyayisenga
SIMBA CLOUD EA Automated Trading and Position Management for MetaTrader 5 Developed by ShieldNexus | Powered by the SIMBA Trading System SIMBA CLOUD EA is designed for traders who want more than basic trade execution. It combines automated market evaluation, configurable trading logic, and active position management in one integrated system. Whether you are developing your trading routine or looking to automate an established approach, SIMBA CLOUD EA provides a systematic framework for evaluati
SIMBA MARKET FORECAST MACHINE Stop Chasing BUY/SELL Signals. Start Forecasting the Market. You probably already have enough indicators. RSI. MACD. Moving averages. Stochastic. Trend indicators. Buy arrows. Sell arrows. The problem is not finding another indicator. The problem is understanding what the market is actually doing . A normal indicator may tell you: BUY But what happens next? Where is price likely to go? How strong is the setup? What market regime are you in? What could invalidate the
Simba Price Signal
Emmanuel Ndacyayisenga
SIMBA Price Signal  Rule of Seven + DeMark Forecast & Market Structure Dashboard See the market. Plan the trade. Track the outcome. SIMBA Price Signal is a non-trading analytical indicator for MetaTrader 5 designed to help traders analyze market direction, potential price targets, supply and demand zones, market exhaustion, risk-to-reward, and overall setup quality from one dashboard. The indicator combines Rule of Seven projections, DeMark Sequential analysis, H1 supply and demand zones, Fibona
Simba Guardian EA
Emmanuel Ndacyayisenga
SIMBA GUARDIAN EA Automated Trend-Following Expert Advisor for MetaTrader 5 Identify opportunities. Execute systematically. Manage trades with discipline. A Smarter, More Structured Way to Trade Meet SIMBA GUARDIAN EA , an automated trading solution for MetaTrader 5 built around trend-following, systematic trade execution, and structured position management. Designed for traders who value a rules-based approach, SIMBA GUARDIAN EA evaluates market conditions, identifies qualifying trading opport
Simba Prop Fim Manager
Emmanuel Ndacyayisenga
SIMBA PROP FIRM MANAGER: Professional Risk & Trade Management for MT5 Trade Your Strategy. Manage Your Risk. Protect Your Progress. You may already have a profitable trading strategy. You understand market structure, identify quality setups, and know when to enter the market. Yet, challenges can still fail because of inconsistent risk management, emotional decisions, excessive trading, or poorly managed open positions. SIMBA PROP FIRM MANAGER is designed for traders who want to approach prop fir
筛选:
无评论
回复评论