Simba Position Manager

  • インディケータ
  • Emmanuel Ndacyayisenga
    Emmanuel Ndacyayisenga
    • Founder & Lead Developer | Quant Trader & MQL5 Developer において  ShieldNexus
    • ルワンダ
    • 1037
    NDACYAYISENGA Emmanuel is a quantitative trader and MQL5 Expert Advisor developer focused on transforming practical trading concepts into systematic and automated trading solutions.
  • バージョン: 3.10
  • アクティベーション: 10
SIMBA POSITION MANAGER

Trade Your Setup. Understand Your Position.

You found the setup.
You opened the trade.

Now what?

This is where many traders struggle.

Finding an entry is only one part of trading. Once a position is open, you still need to understand whether the trade is progressing, how much risk remains, when the position reaches important R-multiples, whether momentum is strengthening or weakening, and whether market conditions continue to support the trade.

SIMBA Position Manager is designed to help with that part of the trading process.

It is an MT5 monitoring and analysis indicator with a professional dashboard designed to analyze open positions, market conditions and potential management levels.

SIMBA does not open, close, modify or manage trades.

You remain in control of every trade. SIMBA provides the information and analysis to help you make better management decisions.

WHAT DOES SIMBA DO?

SIMBA continuously analyzes the market and your open positions and presents the information through a structured dashboard.

The indicator combines concepts such as:

  • R-multiples

  • ATR

  • PSAR

  • DEMA

  • Fibonacci levels

  • Market direction

  • Momentum

  • Volatility

  • Multi-timeframe conditions

  • Risk and reward

  • Position progress

Instead of constantly calculating these conditions manually, SIMBA brings them together into one workspace.

The core philosophy is:

MONITOR → ANALYZE → PROTECT → MANAGE → DECIDE

SIMBA provides the analysis.

You make the decision.

IMPORTANT: SIMBA DOES NOT MODIFY TRADES

SIMBA Position Manager is an analysis and monitoring indicator.

It does not:

  • Open trades

  • Close trades

  • Modify Stop Loss

  • Modify Take Profit

  • Move positions to Break-Even

  • Execute partial profits

  • Trail positions

  • Change your lot size

  • Send trade-management orders

The indicator simply monitors and analyzes the position and displays management information, levels and conditions on the dashboard.

This means you can use SIMBA alongside your existing trading strategy while maintaining complete manual control. if your want the indicator which can do all that check Simba Position Manager Pro

YOUR TRADE. YOUR DECISION.

Many traders know how to find entries.

The difficult part often comes afterward.

You may ask:

Is my trade progressing normally?

How much have I made in R?

Where is my potential break-even level?

Has the market reached a meaningful profit area?

Is momentum still supporting the position?

Is the trend becoming exhausted?

Should I protect more profit?

Should I allow the trade to continue?

SIMBA is designed to help answer these questions through live market analysis.

R-BASED POSITION ANALYSIS

SIMBA uses the initial risk of the position as a reference point.

Your initial risk represents:

1R

From there, the dashboard can help you understand the position's progress through stages such as:

INITIAL → +1R → +2R → +3R → RUNNER

For example, the dashboard can help identify when a position has reached:

  • +1R

  • +2R

  • +3R

  • Other configured R-multiples

This allows you to evaluate the trade based on its original risk rather than simply looking at raw currency profit.

Instead of thinking:

"I am up $150."

You can think:

"The position has reached +2R."

That provides a more consistent framework for comparing trades.

POSITION PROTECTION ANALYSIS

SIMBA can calculate and display potential protection levels based on its analytical logic.

Depending on the configuration and market conditions, the dashboard can reference:

  • ATR

  • PSAR

  • Initial risk

  • Entry price

  • Current price

  • R-multiple

  • Market structure

  • Fibonacci levels

These levels are presented as analysis and reference information.

The trader decides whether to manually apply any change to the position.

This keeps the trader in control while reducing the amount of calculation required during a live trade.

BREAK-EVEN ANALYSIS

Moving a trade to break-even is an important decision.

Move too early and normal market noise may remove a potentially good trade.

Move too late and an already profitable trade may return toward its original risk.

SIMBA monitors the position's progress and can identify when predefined R-based conditions have been reached.

The dashboard can therefore show when a position has reached a potential break-even management stage.

SIMBA informs. You decide.

PARTIAL PROFIT ANALYSIS

One of the biggest challenges in trading is knowing what to do with a profitable position.

Close everything too early and the market may continue much further.

Hold everything without a plan and a profitable trade may give back a significant portion of its gains.

SIMBA can display R-based and market-based management levels that can help traders evaluate potential partial-profit opportunities.

The trader can then decide whether to:

SECURE → HOLD → REDUCE → CONTINUE

No automatic order is executed.

RUNNER ANALYSIS

Sometimes the best part of a trade happens after the first profit target.

SIMBA helps traders identify when a position has moved sufficiently into profit to consider allowing part of the position to continue.

The dashboard can monitor:

  • Current R

  • Trend direction

  • Momentum

  • PSAR

  • DEMA

  • Volatility

  • Potential target areas

  • Market exhaustion

This gives the trader more information when deciding whether a profitable position should continue running.

Secure information. Protect decisions. Give strong trades room when conditions allow.

R-BASED TRAILING ANALYSIS

SIMBA can calculate and display potential R-based trailing references.

As the position moves further into profit, the trader can see how different protection levels could affect the trade.

For example:

+1R → Protection Zone

+2R → Profit Protection Zone

+3R → Extended Protection Zone

These are analytical references rather than automatic trading commands.

You decide whether and when to adjust your actual Stop Loss.

PSAR MARKET ANALYSIS

Parabolic SAR provides a dynamic view of market direction and trend movement.

SIMBA can use PSAR information to help evaluate whether market conditions continue to support the direction of an open position.

The dashboard can show whether PSAR is:

SUPPORTING

or

CONTRADICTING

the current position direction.

This gives traders another layer of information when deciding whether to continue holding, protect profit or reconsider the position.

DEMA + PSAR ANALYSIS

A single indicator should not always determine what happens to a trade.

For example, a DEMA crossover against a position does not necessarily mean that the entire trend has ended.

SIMBA therefore combines DEMA and PSAR conditions to provide a broader analytical picture.

A potential DEMA change can be evaluated together with PSAR conditions.

The dashboard can help identify situations such as:

DEMA CHANGE + PSAR SUPPORT

The trend may still have strength.

Or:

DEMA CHANGE + PSAR CONTRADICTION

The position may require closer attention.

SIMBA does not make the final decision.

It gives the trader more information before making it.

FIBONACCI MARKET LEVELS

SIMBA can also use Fibonacci-based calculations as reference points for trade analysis.

These levels can help traders evaluate:

  • Potential profit zones

  • Retracement areas

  • Extension levels

  • Market reaction areas

  • Potential target locations

Fibonacci levels are presented as analytical references and should be interpreted together with the broader market conditions.

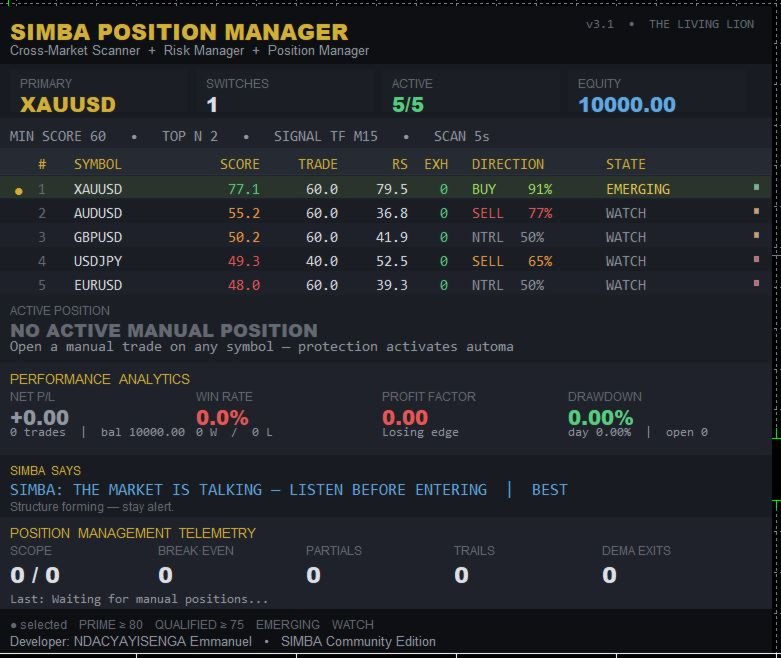
PROFESSIONAL LIVE DASHBOARD

The heart of SIMBA Position Manager is its dashboard.

Instead of manually checking multiple calculations, the trader can see important information in one workspace.

The dashboard can display information such as:

  • Open position

  • Direction

  • Entry price

  • Current price

  • Current profit/loss

  • Current R

  • Initial risk

  • Potential management levels

  • Market direction

  • Market strength

  • Momentum

  • PSAR condition

  • DEMA condition

  • ATR information

  • Fibonacci levels

  • Market state

  • Position status

The objective is simple:

Less calculation. More awareness. Better decisions.

SIMBA MARKET STATUS

SIMBA can also monitor the broader market environment.

The dashboard can communicate different market states such as:

PRIME

The monitored market currently meets stronger internal conditions.

WATCH

The market is being monitored but does not currently meet the stronger conditions.

DECAYING

The market is showing signs of weakening, exhaustion or deteriorating conditions.

WAIT

Additional confirmation may be required.

PROTECTED

The position has reached a condition where profit protection may deserve attention.

These states are designed to make complex market information easier to understand at a glance.

MARKET SCANNER

SIMBA can monitor multiple markets from one dashboard.

Instead of manually switching between charts, traders can compare the monitored instruments and see which markets currently deserve attention.

The analysis can consider factors such as:

  • Trend

  • Momentum

  • Volatility

  • Multi-timeframe alignment

  • Market strength

  • Tradeability

  • Exhaustion

  • Risk/reward conditions

  • Setup quality

The result is a ranked view of the markets being monitored.

SCAN → SCORE → FILTER → RANK → ANALYZE

MULTI-TIMEFRAME ANALYSIS

Markets can look bullish on one timeframe and bearish on another.

SIMBA helps traders see these relationships more clearly.

The dashboard can compare conditions across multiple timeframes to help identify:

  • Higher-timeframe direction

  • Intermediate trend

  • Entry-timeframe conditions

  • Momentum alignment

  • Potential conflicts

This helps answer an important question:

Is my position moving with the broader market or against it?

BUILT FOR MANUAL TRADERS

SIMBA Position Manager is designed for traders who want analytical assistance without giving up control.

DISCRETIONARY TRADERS

You choose the setup.

You choose the entry.

SIMBA helps you monitor what happens afterward.

DAY TRADERS

Monitor several positions and markets without repeatedly performing the same calculations.

SCALPERS

Use the dashboard to quickly understand position progress and changing market conditions.

SWING TRADERS

Continue monitoring positions while keeping important management information visible.

PROP FIRM TRADERS

Use the analytical framework to monitor R, position progress and market conditions while following your own firm's risk rules.

Always verify your firm's current rules before using any trading-management workflow.

WHAT MAKES SIMBA DIFFERENT?

SIMBA is not designed to replace your trading strategy.

It does not tell you that every market must be traded.

It does not claim to predict the future.

It does not promise profitable trades.

Instead, it focuses on something that is often overlooked:

WHAT HAPPENS AFTER THE ENTRY?

SIMBA brings together:

MARKET AWARENESS

Understand the current condition of the market.

POSITION AWARENESS

Understand what is happening to your open position.

RISK AWARENESS

Understand how far the position has moved relative to its initial risk.

MANAGEMENT AWARENESS

Identify potential protection, profit and trailing reference levels.

All inside one dashboard.

SIMBA IS YOUR SECOND SET OF EYES

You do not need another indicator telling you simply:

BUY

or

SELL

You need information that helps you understand what is happening after you have made the decision to trade.

SIMBA can help you see:

  • Is the position profitable?

  • How many R have I achieved?

  • Has the position reached a management milestone?

  • Is momentum still supporting the trade?

  • Is PSAR supporting the direction?

  • What is DEMA showing?

  • Where are potential protection levels?

  • Where are potential profit areas?

  • Is the market becoming exhausted?

  • Should I pay closer attention?

The final decision remains yours.

KEY FEATURES
Feature Purpose
Live Position Monitoring Monitor open positions in real time
R-Multiple Analysis Measure position performance relative to initial risk
Break-Even Reference Identify potential break-even management stages
Partial-Profit Analysis Highlight potential profit-management areas
Runner Analysis Help evaluate whether a position may have room to continue
R-Based Trailing Analysis Display potential R-based protection references
PSAR Analysis Monitor dynamic market direction
DEMA Analysis Monitor trend and momentum changes
DEMA + PSAR Logic Combine conditions for deeper analysis
ATR Analysis Evaluate volatility and potential protection references
Fibonacci Analysis Display potential retracement and extension areas
Market Scanner Monitor multiple instruments
Multi-Timeframe Analysis Compare conditions across timeframes
Market Ranking Identify markets meeting stronger analytical conditions
Market State Quickly understand current market conditions
Live Dashboard Bring market and position information together
Manual Control Trader remains responsible for all trading actions
WHAT SIMBA DOES NOT DO

SIMBA Position Manager is intentionally designed as a monitoring and analysis indicator.

It does not:

❌ Open trades
❌ Close trades
❌ Modify existing trades
❌ Move Stop Loss automatically
❌ Move Take Profit automatically
❌ Execute partial closes
❌ Automatically trail positions
❌ Automatically change lot sizes
❌ Guarantee profitable trades
❌ Predict the market

The indicator provides information and analytical references. check Simba Position Manager Pro

The trader makes the final decision and executes any desired trade action manually.

WHY MANUAL CONTROL MATTERS

Trading is not only about calculations.

It is also about context.

A technical calculation can identify a potential level, but the trader may have additional information about:

  • News

  • Session conditions

  • Liquidity

  • Market structure

  • Correlation

  • Account exposure

  • Personal risk tolerance

  • Trading plan

  • Prop-firm restrictions

SIMBA therefore does not attempt to take control away from the trader.

Instead:

SIMBA calculates.

SIMBA monitors.

SIMBA displays.

YOU DECIDE.

WHO SHOULD USE SIMBA?

SIMBA Position Manager may be suitable for traders who:

  • Already have their own trading strategy

  • Prefer manual entries

  • Want better post-entry analysis

  • Trade multiple markets

  • Want R-based position monitoring

  • Want to understand trade progress more clearly

  • Want potential management levels displayed automatically

  • Want market conditions and positions in one dashboard

  • Want to reduce repetitive calculations

  • Want more structured decision-making

It may not be suitable for traders looking for a simple buy/sell signal or a fully automated trading system.

GETTING STARTED
  1. Install SIMBA Position Manager on MetaTrader 5.

  2. Attach the indicator to your preferred chart.

  3. Configure the markets and analytical settings.

  4. Open your trade using your own strategy.

  5. Allow SIMBA to monitor the position.

  6. Review the dashboard as the market develops.

  7. Use the displayed information to evaluate your management decisions.

  8. Execute any desired trade adjustment manually through MT5.

SIMBA does not take control of your account.

You remain the trader.

THE SIMBA APPROACH

SCAN THE MARKET.

UNDERSTAND THE CONDITION.

ENTER WITH YOUR STRATEGY.

MONITOR THE POSITION.

MEASURE THE TRADE IN R.

IDENTIFY PROTECTION LEVELS.

WATCH MOMENTUM AND TREND.

SECURE PROFIT WHEN YOUR PLAN SAYS SO.

LET STRONG TRADES DEVELOP WHEN CONDITIONS ALLOW.

Trading will always involve uncertainty.

SIMBA cannot remove that uncertainty.

What it can do is help transform post-entry monitoring from a collection of manual calculations into a structured visual process.

YOU BRING THE STRATEGY.

YOU MAKE THE ENTRY.

SIMBA MONITORS THE POSITION.

YOU MAKE THE FINAL DECISION.

SIMBA POSITION MANAGER

Monitor. Analyze. Decide.

PRODUCT IDENTITY

Developed by: ShieldNexus
Developer: NDACYAYISENGA Emmanuel
Trading Engine: SIMBA Trading Engine
Product Edition: SIMBA Community Edition

SIMBA Position Manager
Powered by the SIMBA Trading Engine

© NDACYAYISENGA Emmanuel / ShieldNexus

Product version and features may be updated over time.

Risk Warning: Trading financial markets involves substantial risk. Past or simulated performance does not guarantee future results. Use appropriate risk management and test the EA on a demo account before live deployment.

おすすめのプロダクト
CosmiCLab SMC FIBO CosmiCLab SMC FIBO is a professional trading indicator designed for traders who use Smart Money Concepts (SMC), market structure analysis and Fibonacci retracement levels. The indicator automatically detects market swings and builds Fibonacci levels based on the latest impulse movement. It also identifies market structure changes such as BOS (Break of Structure) and CHOCH (Change of Character), helping traders understand the current market direction. CosmiCLab SMC FIBO also pr
Confluence Meter:26本のインジケーターを1つの総合レーティングに Confluence Meter は、人気の高い26本のインジケーターのシグナルを計算し、「売り/中立/買い」というシンプルなレーティングにまとめます。何十ものウィンドウを開いて数値を手作業で見比べる必要はありません。パネルをひと目見るだけで、選択した時間足で相場がどちらに傾いているかが分かります。 MT4-version:  https://www.mql5.com/en/market/product/199466 Our products: https://www.mql5.com/en/users/trendhunter/seller チャートに表示される内容 **Oscillators ゲージ。**11本のオシレーターのレーティングです。RSI、Stochastic、CCI、ADX、Awesome Oscillator、Momentum、MACD、Stochastic RSI、Williams %R、Bulls/Bears Power、Ultimate Oscillator が含まれます。 *
RBreaker Gold Indicatorsは、金先物の短期日内取引戦略であり、トレンドフォローと日内反転の2つの取引手法を組み合わせたものです。トレンド相場での利益を捉えるだけでなく、相場が反転した際には迅速に利確し、その流れに沿ってポジションを反転させることができます。 この戦略は、アメリカの雑誌『Futures Truth』において、15年連続で最も収益性の高い取引戦略トップ10に選ばれた実績を持ち、非常に長いライフサイクルを誇り、現在も国内外で広く使用・研究されています。 本インディケーターは、2026年の金先物の値動きに対応し、14日間のATR指標に基づいて、ブレイクアウト係数A、観察係数B、リバーサル係数Rをより合理的な値で定義しています。非常に優れたインディケーターであり、安定的な年間収益を実現しています。ぜひおすすめします〜
Noize Absorption Index - is the manual trading system that measures the difference of pressure between bears forces and bulls forces. Green line - is a noize free index that showing curent situation. Zero value of index shows totally choppy/flat market.Values above zero level shows how powerfull bullish wave is and values below zero measures bearish forces.Up arrow appears on bearish market when it's ready to reverse, dn arrow appears on weak bullish market, as a result of reverse expectation.
Fabii Half Trend Baseline
Fabien Georges Andre Guillemaud
上位足のトレンドに逆らう取引をやめましょう。2本のベースライン、1つのチャート。リペイントなし。 どの通貨ペアでも、どの時間足でも。2分でチャートに表示。Strategy Tester で無料デモを試せます。 Get more indicators here Baselines, volatility filters and oscillators. No repaint. 必要な理由 チャート上のラインが緑になったので、あなたはエントリーします。その後、上位足を開くと、大きなトレンドは逆方向を向いています。シグナルは本物でした。しかし、その背景のトレンドはあなたの味方ではありませんでした。 大きなトレンドに逆らう取引は、そのたびにエントリーの優位性を失わせます。 得られるもの Fabii Half Trend Baseline は、現在の時間足のトレンドと上位足のトレンドを1つのチャートに表示します。ウィンドウを切り替えて全体像を確認する必要がなくなります。 上位足の2本目のベースラインがメインのラインの後ろに描かれるため、別のチャートを開かずに大きなトレンドが分かります。 ベ
What Is Trend Master Pro? Trend Master Pro   is a professional-grade trend trading indicator built for MetaTrader 5. It was designed with one goal in mind — to keep you on the right side of the market at all times by combining three powerful technical tools into a single, clean, easy-to-read display directly on your price chart. Instead of cluttering your screen with multiple separate indicators, Trend Master Pro fuses an   EMA Ribbon trend filter , a   ZigZag swing point engine , and a   breako
Trading Utility for Forex Currency Pairs Only not for Gold  Functions Auto Lot Calculation based on Risk Auto stoploss  Auto TakeProfit Breakeven Auto Close Half % Close in percentage with respect to the PIPs Pending Orders BuyLimit Sell Limit with distances BuyStop Sell Stop    with distances Trading Informations Risk in percentage For Multiple trades Combine Takeprofit and Combine Stoplosses
Price Magnet — Price Density and Attraction Levels Indicator Price Magnet is a professional analytical tool designed to identify key support and resistance levels based on statistical Price Density. The indicator analyzes a specified historical period and detects price levels where the market spent the most time. These zones act as “magnets,” attracting price action or forming a structural base for potential reversals. Unlike traditional Volume Profile tools, Price Magnet focuses on price-time d
プレミアムレベルは、正しい予測の精度が80%を超える独自の指標です。 この指標は、最高のトレーディングスペシャリストによって2か月以上テストされています。 あなたが他のどこにも見つけられない作者の指標! スクリーンショットから、このツールの正確さを自分で確認できます。 1は、1キャンドルの有効期限を持つバイナリーオプションの取引に最適です。 2はすべての通貨ペア、株式、商品、暗号通貨で機能します 手順: 赤い矢印が表示されたらすぐにダウントレードを開き、青い矢印が表示されたら閉じます。青い矢印の後に開くこともできます。 試してテストしてください!推奨設定はデフォルトです! 日足チャートで最高の精度を示します! インディケータは、2600 Pipsの収益性に対して、約10Pipsという非常に小さなマージンを使用します。
ADVANCED FUNCTIONALITIES: Trend Score (0-100) with visual bar Intelligent signals with adjustable strength (1-10) Risk management with automatic TP/SL Audible and visual alerts Price zones with smooth filling Multi-indicator analysis (RSI, ATR, BB, EMAs) DESIGN FEATURES Modern Visual: Smooth and well-spaced lines (EMA with 2-3px width) Vibrant and professional colors (Sky Blue, Orange, Gold) Modern arrows (code 233/234) for buy/sell signals Configurable dark/light theme Adjustable transparency f
Auto Trade Journal with Screenshots 取引の瞬間を自動でスクリーンショットに記録 取引日誌をつけることは、あらゆるメンターが勧めながらも、ほとんど誰も続けられない習慣です。手作業では時間がかかり、つい省略してしまうからです。手書きの記録は数値を残すことはできても、エントリーやエグジットのその瞬間にチャートが実際どう見えていたかを示すことは決してできません。しかし、学びはまさにそこにあります。 Auto Trade Journal with Screenshots は、これを口座全体に対して自動で行います。取引が開始、決済、部分決済されるたび、あるいは損切りや利食いの水準が変更されるたびに、その瞬間のチャートのスクリーンショットを保存し、詳細情報と画像パスをCSVの1行として記録します。手動取引でも、どのExpertによる取引でも区別なく記録します。 MetaTrader 4 と MetaTrader 5 の両方に対応しており、Market上ではそれぞれ別製品として販売されていますので、ご使用の端末に合ったバージョンをお選びください。あらゆる銘柄、あら
NQX Smooth Trend Flip Weekly BiasはMetaTrader 5用のシグナルインジケーターです:平滑化トレンド転換のシグナル(週足のバイアス方向にのみシグナルを出します)。 値動きの後の平滑化ローソク足の色の転換を検出するNQX独自のロジックです。週足のバイアス方向にのみシグナルを出します。推奨エントリー、短いストップ、遠めのターゲット(3:1、5:1、10:1、スイングでは最大20:1)を表示します。判断するのはあなたです。 チャート上に表示されるもの - 確定したシグナル足に矢印を表示します(確定したシグナルがリペイントされることはありません)。 - 推奨エントリー、短いストップ、遠めの推奨ターゲット(デフォルトはリスクの6倍)、さらに3 x 1、5 x 1、10 x 1の参考ライン。 - レベルに到達すると、チャート上にラベル(ターゲットまたはストップ)が表示されます。 - 最新のシグナルと、表示中の履歴に出現したシグナル数を示すパネル。 - 新しいシグナルのポップアップ通知とプッシュ通知(オプション)。 NQX独占ロジック:他のどのNQXインジケータ
JTC Smart Gold Indicator is a professional trading indicator designed exclusively for the XAUUSD (Gold) 5-minute timeframe on MetaTrader 5. It focuses on identifying high-quality trading opportunities during the New York session while helping traders maintain a disciplined and structured trading approach. Unlike indicators that generate excessive signals, JTC is designed to prioritise quality over quantity, typically highlighting a small number of carefully selected opportunities during active
Was: $249  Now: $99   Market Profile defines a number of day types that can help the trader to determine market behaviour. A key feature is the Value Area, representing the range of price action where 70% of trading took place. Understanding the Value Area can give traders valuable insight into market direction and establish the higher odds trade. It is an excellent addition to any system you may be using. Inspired by Jim Dalton’s book “Mind Over Markets”, this indicator is designed to suit the
Passband Filter Pro Passband Filter Pro is a trend and cycle oscillator for MetaTrader 5. It is built on the Ehlers Super Passband Filter, a band pass filter that removes long term trend drift and short term noise so that only the dominant market cycle remains. The result is a clean oscillator with a color cloud that shows overbought and oversold conditions, cycle turns, and momentum on forex, gold, indices, stocks and crypto. Most traders enter too early or too late. Simple moving averages la
Smart Support And Resistance Indicator See the Market Levels That Matter. Make your chart clearer and your technical analysis more organized with Smart Support And Resistance Indicator — a powerful trading tool designed to help traders identify important support and resistance levels directly on their MetaTrader 5 charts. Whether you trade Forex, Gold, Indices, or other available markets, this indicator helps you focus on key price areas, monitor potential market reactions, and analyze price act
Crash 1000 Scalping Indicator for the Crash 1000 Deriv Synthetic Index. Introduction The Crash 1000 Scalping Indicator is a specialized tool designed for the Crash 1000 index on the Deriv Synthetic market. This indicator is particularly useful for scalping on the M1 timeframe, helping traders to identify precise entry and exit points for buy positions. It is designed to be non-repainting, providing clear signals with audible alerts and push notifications, and is compatible with mobile devices th
Overview RealCost Risk Governor MT5 is an account and trade-risk monitoring utility for MetaTrader 5. It does not predict price movement and does not provide buy or sell signals. It watches configured risk limits and shows a compact on-chart panel for daily P/L, floating P/L, equity drawdown, trade count, open positions, pending orders, total lots, and chart spread. The default mode is alert-only. If the trader explicitly enables protection actions, the utility can close scoped positions, del
GOLD TRACK — MT5 Gold Track is a technical analysis indicator designed primarily for XAUUSD / GOLD trading on MetaTrader 5. It combines multiple market conditions into a structured signal system, helping traders identify potential bullish and bearish setups without relying on a single indicator. Key Features EMA Trend Analysis RSI Momentum Confirmation ️ ATR Volatility Analysis ️ Candle Confirmation ️ H1 Multi-Timeframe Confirmation Market Structure Analysis Liquidity Anal
Put your trading profits to work. Equity Sculptor EA is an MT5 trade-management tool that uses new closed profits to gradually reduce losing positions across your account. Account-wide management: All symbols and magic numbers, including manual trades. Two funding modes: Rescue Wallet or Legacy Balance. Flexible settings: Customize profit allocation, trim size and trade selection. Clear dashboard: View your funds, performance and configurations. Persistent tracking: Saved accounting continues af
TradeManager Control Suite Manual trading with structured planning and controlled risk TradeManager Control Suite is a comprehensive trading panel for MetaTrader 5. It helps you prepare trades directly on the chart, calculate position size, place orders and manage open positions according to a plan defined in advance. You remain responsible for every entry. The application does not trade independently and does not use an automated trading strategy. It performs the calculations, sends the orde
GoldPro Max
Taher Ahmed Mohamed Taha Elshafei
GOLDPRO MAX Advanced Multi-Timeframe and Smart Money Market Analysis for MetaTrader 5 GoldPro Max is a professional market analysis indicator for MetaTrader 5 designed to help traders study market direction, price structure, liquidity, market imbalance and potential trading areas from multiple perspectives. The indicator combines Multi-Timeframe Analysis, Smart Money Concepts, Market Structure, Liquidity Analysis, Order Blocks, Fair Value Gaps, Premium and Discount analysis, Smart Analytical Eng
If you've ever stared at a gold chart, done the math in your head three times, and still second-guessed your lot size right before entry - this tool was built for you. Current price: $39 - increases by $10 after every 20 purchases until reaching the final price of $89 . Next price: $49 . Complete Buyer Kit: 34 Professional Resources included at no additional cost. MT5 Presets, PDF Guides, Checklists, Mindmaps, Reference Cards, and Excel Workbooks - built from 8 years of developing structured XAU
VELOS Trading Indicator Precision. Speed. Confidence. The VELOS Trading Indicator is a professional, non-repainting MT5 trading system developed by DC Trading to help traders identify high-probability trading opportunities with confidence. Designed for both beginner and experienced traders, VELOS combines trend analysis, momentum confirmation, and volatility filtering into one intelligent indicator, delivering precise entry and exit signals while reducing false setups. Built for fast-moving m
Laguerre SuperTrend Clouds   adds an Adaptive Laguerre averaging algorithm and alerts to the widely popular SuperTrend indicator. As the name suggests,   Laguerre SuperTrend Clouds (LSC)   is a trending indicator which works best in trendy (not choppy) markets. The SuperTrend is an extremely popular indicator for intraday and daily trading, and can be used on any timeframe. Incorporating Laguerre's equation to this can facilitate more robust trend detection and smoother filters. The LSC uses the
Inverted_Chart_EA Utility Expert Advisor Inverted_Chart_EA creates and maintains a mirror-inverted chart of any symbol and timeframe. It automatically generates a custom instrument (e.g. US30_INV ) and keeps its price history updated in real time, with bars mirrored around a chosen pivot. This utility gives traders a new way to analyze the market from a different perspective by flipping the chart upside down. Why use an inverted chart? Highlight hidden patterns – price formations that look ordin
Structure King AI Signal Structure King AI Signal is a professional MetaTrader 5 trading indicator designed to help traders analyze market structure, trend direction, multi-timeframe confirmation and trade management from one clean dashboard. Key Features • Market Structure & Trend Analysis • BUY / SELL Signals • Multi-Timeframe (HTF) Confirmation • Entry Price Levels • Dynamic Stop Loss (SL) • TP1 / TP2 / TP3 Levels • ATR Volatility Analysis • ADX Trend Strength Filter • Adaptive Market Filter
これはほぼ間違いなく、MetaTraderプラットフォームで見つけることができる最も完全な調和価格形成自動認識インジケーターです。 19種類のパターンを検出し、フィボナッチプロジェクションをあなたと同じように真剣に受け止め、潜在的逆転ゾーン(PRZ)を表示し、適切なストップロスとテイクプロフィットレベルを見つけます。 [ インストールガイド | 更新ガイド | トラブルシューティング | よくある質問 | すべての製品 ] 19の異なる調和価格形成を検出します プライマリ、派生および補完フィボナッチ投影(PRZ)をプロットします 過去の価格行動を評価し、過去のすべてのパターンを表示します この指標は、独自の品質とパフォーマンスを分析します 適切なストップロスとテイクプロフィットのレベルを表示します ブレイクアウトを使用して適切な取引を通知します すべてのパターン比をグラフにプロットします 電子メール/音声/視覚アラートを実装します スコット・M・カーニーの本に着想を得て、この指標は最も純粋で急を要するトレーダーのニーズを満たすように設計されています。ただし、トレードを容易にする
Enhanced Elliott Wave Pro – Advanced Market Structure & Wave Analysis   Enhanced Elliott Wave Pro is a lightweight, institutional-grade MT5 indicator that eliminates chart clutter by detecting and displaying only the current, active market structure: the 1-2-3-4-5 Impulse wave and the subsequent A-B-C Correction.   Built with classic Prechter wave rules and ATR-adaptive pivot detection, it delivers clean, real-time wave counts without bogging down your terminal.   ――――――――――――――――――――――――――――
NQX Oscillator Hook LondonはMetaTrader 5用のシグナルインジケーターです:オシレーターフックのシグナル(ロンドン時間中にのみシグナルを出します(日中チャート))。 極端なゾーンから抜け出すオシレーターのフックを検出するNQX独自のロジックです。ロンドン時間中にのみシグナルを出します(日中チャート)。推奨エントリー、短いストップ、遠めのターゲット(3:1、5:1、10:1、スイングでは最大20:1)を表示します。判断するのはあなたです。 チャート上に表示されるもの - 確定したシグナル足に矢印を表示します(確定したシグナルがリペイントされることはありません)。 - 推奨エントリー、短いストップ、遠めの推奨ターゲット(デフォルトはリスクの5倍)、さらに3 x 1、5 x 1、10 x 1の参考ライン。 - レベルに到達すると、チャート上にラベル(ターゲットまたはストップ)が表示されます。 - 最新のシグナルと、表示中の履歴に出現したシグナル数を示すパネル。 - 新しいシグナルのポップアップ通知とプッシュ通知(オプション)。 NQX独占ロジック:他のどのN
このプロダクトを購入した人は以下も購入しています
Trend Sniper X
Sarvarbek Abduvoxobov
4.86 (44)
Trend Sniper X は、トレードの方向性と潜在的な反転ポイントを明確かつ正確に特定するのに役立つ、MetaTrader 5 用のマルチタイムフレーム・トレンドフォロー指標です。 MT4用: https://www.mql5.com/en/market/product/193245 価格情報: 現在の価格はプロモーション価格であり、今後のアップデートや新機能のリリースに伴い変更される場合があります。 ボーナス特典: このインジケーター用の無料自動売買アシスタントEAを入手するには、購入後に an 著者(開発者)へメッセージをお送りください。 Code2Profit チャンネル マルチタイムフレーム分析で相場をマスターしよう! Trend Sniper X で勝率を最大化する方法:重要なルールとセッションのコツ 技術仕様 プラットフォーム MetaTrader 5 インジケータータイプ マルチタイムフレーム・トレンドインジケーター 操作タイムフレーム あらゆるチャートタイムフレームに対応。個別に選択可能な上位タイムフレーム (M1–MN1) を搭載 主要銘柄 FX、ゴールド (X
新たな王者が登場 - インジケーター + 注文管理表示(TP1 + TP2 + TP3)+ オプションのTelegramシグナル送信機能付き(無料) (完全なトレード&シグナルシステム) ゴールド向け最高のEA: Gold Slayer このインジケーターには、高度な戦略、カスタマイズ可能な注文管理システム、そしてエンベロープ拡張を組み合わせた平均回帰システムが搭載されています。さらに、RSIなど複数のインテリジェントな確認フィルターによって、高確率の反転エントリーをBUY・SELLシグナルとして検出します。 単にトレードを学ぶだけでなく、複数ポジションを効果的に管理し、過去に利益を出しているオープンポジションで損失トレードをカバーする方法も学べます。 M5向けに構築・最適化されており、流動性が高くシグナルの精度が安定しているBTCUSDとXAUUSDで優れたパフォーマンスを発揮します。 このインジケーターは、ATRを基に自動計算されたエントリー、ストップロス、テイクプロフィットレベルを備えた明確なLong・Shortシグナルを提供するため、リスク管理が最初から組み込まれています。 マ
Smart Trend Trading System — MetaTrader 5 ご購入後、MQL5で私にメッセージをお送りいただくと、Smart Universal Expert Advisorを無料で受け取れるほか、オンライン講座、PDFマニュアル、非公開グループへのアクセスもご利用いただけます。 STTSは、トレンドの方向、エントリー・決済シグナル、反転ゾーン、重要な価格水準をチャート上にまとめて表示します。システムを参考に手動で取引することも、別の対応EAを接続し、ご自身で選んだ設定に基づいて自動売買することもできます。 ひとつのシステム、4つのトレードアプローチ STTSのトレードアプローチは、大きく4つのカテゴリーに分かれています。 • スキャルピング — 短期的なシグナルや相場の動きを捉えます。 • トレンドトレード — 方向性を評価し、トレンド内の機会を探します。 • 反転トレード — 反転の可能性があるゾーンや方向の変化を見つけます。 • 出来高トレード — 出来高に基づく情報を使い、市場の活発さを評価します。 エントリー・決済の矢印、トレンド情報、サポート・
Entry Points Proは、注文を出す前に、どこでエントリーし、どこにストップを置き、どのロットで取引するかを示します。 価格 現在 199 USD、この価格での販売は 8 本です。その後は 249 USD、最終価格は 349 USD です。 私は相場のトレードで収入を得ており、それを公開しています。だから、このインジケーターを誰にでも売る必要はありません。自分の頭で考えるトレーダーのためのツールであり、魔法のボタンではありません。 ブレイクがなければ取引もありません。グレーの矢印はキャンセルされたシグナルです。価格がシグナル足をブレイクしなかったため、エントリーも損失もありません。 矢印はローソク足の確定時に表示され、リペイントしません。設定は2つ:あなたの資金と1回のトレードあたりのリスクです。 お支払い前にご確認ください:無料デモはMT5のストラテジーテスターで動作し、2分で済みます。ご購入後は、私が個人的に設定をお手伝いします。 2019年、私はこのインジケーターの実力を世界中に示しました。そのシグナルに従って手動で、リアル口座で、公開の場でトレードしたのです。口座は
あなたのトレード優位性を視界に入れよう! M5 Sniper は MeanFX による新しいインジケーターです。 正確なトレードシグナル と 適応型TP/SLレベル を組み合わせることで、結果として可能な限り最高の統計的トレードを実現します! 5回購入されるごとに価格が上昇し、次の価格は69$です 購入後に私にメッセージを送っていただければ、ヒント/ガイドとボーナスEAをお受け取りいただけます 何が他と違うのでしょうか? Gold XAUUSDにおける 実証済みの統計的パフォーマンス ( ほぼすべてのアセットで機能します 。一貫した結果が得られないまま何でも扱おうとするのではなく、1つの時間足をマスターすることに重点を置いています) 1日あたり1~8回のトレード を各シンボルで実行し、高い勝率と、すべての統計的優位性をこちら側に持つことができます チャート上には 確認済みの BUYおよびSELLシグナルのみを表示 適応型TPおよびSLレベル を各トレードごとにインジケーターが生成 平均Winrate 75%+ 平均 Signal Ratio 最低1.1+ アラーム と通知を 携帯電話
Zoryk Gold
Reda El Koutbane
4.79 (19)
割引は 24 時間後に終了します — 次の価格は$ 69 ZORYK — MetaTrader 5専用 XAUUSDシグナル・トレードプランニングシステム このような経験はありませんか。 ゴールドを分析し、エントリーを待ち、ようやくポジションを持った直後に価格が逆方向へ動く。 早すぎる決済をしてしまったり、Stop Lossを動かしたり、数秒迷っている間にチャンスを逃したりする。 その後、相場は自分が最初に予想していた方向へ進み、目標へ到達する。 問題は常に方向判断ではありません。 本当の問題は、明確な計画がなかったことです。 どこでエントリーすべきか。 どこでトレードの前提が無効になるのか。 近い利益を確保すべきか、より大きな値動きを待つべきか。 現在のsetupが本当に強いのか、それとも無理にトレードを探しているだけなのか。 ゴールドは非常に速く動きます。 正しい分析でも、明確なプランがなければ数秒で悪い判断に変わることがあります。 ZORYKは、その問題を解決するために開発されました。 ZORYKとは ZORYKは、MetaTrader 5とXAU
Gann Made Easy   は、ミスター・ギャンの理論を使用した取引の最良の原則に基づいた、プロフェッショナルで使いやすい外国為替取引システムです。 W・D・ガン。このインジケーターは、ストップロスとテイクプロフィットレベルを含む正確な買いと売りのシグナルを提供します。 PUSH通知を利用して外出先でも取引可能です。 ご購入後、取引方法の説明と優れた追加インジケーターを無料で入手するには、私にご連絡ください! おそらく、ギャンの取引手法についてはすでに何度も聞いたことがあるでしょう。通常、ギャンの理論は初心者のトレーダーだけでなく、すでにある程度の取引経験がある人にとっても非常に複雑なものです。なぜなら、ギャンの取引手法は理論的にはそれほど簡単に適用できるものではないからです。私はその知識を磨き、最良の原則を私の外国為替インジケーターに組み込むために数年を費やしました。 このインジケーターは非常に簡単に適用できます。必要なのは、それをチャートに添付し、簡単な取引推奨事項に従うだけです。このインジケーターは常に市場分析の仕事を行い、取引の機会を探します。適切なエントリーポイントを検
ULTRAは、「オールインワン」方式で機能するテクニカル指標です。市場を独自に分析し、売買シグナルを生成し、ストップロス注文を設定するための水準を表示し、利益を確定したり損失を最小限に抑えたりするためにポジションを決済すべきタイミングを提案します。 つまり、市場の分析方法や、水準(ストップロスをどこに設定すべきか)の見極め方がわからなくても、あるいは資金管理に苦労していても問題ありません。ULTRAがすべて代行してくれます! 購入者限定特典 :「ULTRA」インジケーターをご購入後、私にプライベートメッセージをお送りいただければ、「ULTRA BOT」を無料プレゼントとしてお受け取りいただけます。これは、このインジケーターからのシグナルに基づいて、オープンしたトレードを管理するのに役立つ特別なツールです(各トレードにストップロスを設定し、最適な結果が得られるよう、戦略のルールに従って自動的にトレードを決済します)。  また、インジケーターを最大限に活用できるよう、さまざまな資産向けの既成の設定も購入者の皆様に提供しています。これらの「超お得な特典」を無料で入手するには、私へダイレクトメ
SuperScalp Pro
Van Minh Nguyen
4.54 (37)
SuperScalp Pro - Professional Multi-Layer Confluence Scalping System SuperScalp Proは、複数の高度な確認フィルターを追加することで、従来のSupertrendを強化したスキャルピング向けインジケーターです。誤ったシグナルを大幅に減らしながら、成功する可能性がより高いBuy/Sellの取引機会を見つけるのに役立ちます。 BuyとSellの矢印がチャート上に明確に表示され、ATRに基づくStop LossとTake Profitのレベルもリアルタイムで自動計算されます。 ご購入後、MQL5で私にメッセージを送っていただくと、SuperScalp Pro Auto Trader EAを無料で受け取れるほか、ユーザーガイドとプライベートグループへのアクセスもご利用いただけます。 推奨設定ファイルをダウンロード: [Set File] 詳細なドキュメントは製品ブログでご覧いただけます: [User Guide] 最新情報を受け取るには公式チャンネルにご参加ください: [Official Channel] Sup
SMC Intraday Formula
VividMind Digital Solutions
5 (26)
まず正直に言いましょう。 どんなインジケーターも、それ単体であなたを利益化させることはできません。もしそう言う人がいるなら、それは夢を売っているだけです。完璧な売買シグナル(矢印)を表示するインジケーターは、いくらでも“完璧に見せる”ことができます。正しい過去の区間を拡大して、勝ちトレードだけを切り取ればいいだけです。私たちはそれをしません。 SMC Intraday Formula はツールです。 市場構造を読み取り、最も高い確率の価格ゾーンを特定し、今この瞬間のスマートマネーの痕跡をシンプルな言葉で正確に示します。最終判断はあなたが行います。トレードを実行するのもあなたです。しかし今は「希望」ではなく「精度」でエントリーできます。 私たちはこのインジケーターを、ゴールド(XAUUSD)および主要FX通貨ペアで約3年間、日々のスキャルピングに使用してきました。M1、M5、M15、M30の主要ツールです。これは未来を予測しようとするのではなく、今まさに形成されている高確率セットアップを示し、その理由を説明します。 他のすべてのインジケーターと何が違うのか? ほとんどのトレーディングイ
GoldenX Entry MT5
VividMind Digital Solutions
5 (17)
GoldenX Entryは、MT5向けのインジケーターであり、適応型Smart Entry Trendアルゴリズム、シグナルスコアリングシステム、マーケットレジーム検出機能、およびボラティリティフィルターを備えています。各シグナルには、計算されたエントリーレベル、3つのテイクプロフィット(TP1、TP2、TP3)、およびストップロスレベルが含まれます。本インジケーターは、異なる市場環境に適応するために設計された複数の分析レイヤー上に構築されており、マルチレイヤー分析システムと内蔵オプティマイザーおよび統計トラッキングシステムを組み合わせています。リスク・リワード(RR)指標および過去のトレード履歴に基づく定量分析を提供します。 使い始めは簡単です — 選択した時間足でオプティマイザーを実行し、そのままチャート上でインジケーターを使用します。 コア機能 GoldenX Entryは、シグナルエンジンとトレード管理機能、そして過去統計トラッキングを1つのチャートに統合しています: - 内蔵オプティマイザー: オプティマイザーはチャート上でワンクリックで実行できます。200通りのパラメー
Gold Trend Coach MT5
Cristhian Alexander Gaibor Cuasquer
4.27 (11)
MetaTrader 5 向け、ゴールド(XAUUSD)のリペイントしない売買シグナル。すべてのシグナルに損切りラインと3つの利確ラインが付きます。BOS と CHoCH を使った Smart Money Concepts フィルターで、相場の構造に逆らわず、構造に沿ってトレードできます。パネル上のライブ・メンターが、エントリーから TP3 まで一歩ずつナビゲート。アラートはスマホとあなた自身の Telegram チャンネルに直接届きます。それが Gold Trend Coach。もう一人でトレードすることはありません。 ご購入特典・無料の購入者キット: 1. Telegram Alert Bridge: シグナルをあなた自身の Telegram チャンネルへ。チャートのスクリーンショットと日次レポート付き。 2. ユーザーマニュアルと設定ガイド。 受け取り方: キットはダウンロードファイルには含まれていません。購入後に MQL5 のメッセージでご連絡ください。当日中にお送りします。 $39 と $45 のローンチ価格分は完売しました。現在は次の10本まで $59、その後は $79
Boba Analysis Suite
Trade Ready Solutions LLC
5 (2)
Boba Analysis Suite Boba Analysis Suite は、MetaTrader 5 向けの分析インジケーターです。市場構造、重要な価格帯、相場全体の状況を、一つのチャート画面にまとめて表示します。 トレーダーおよびトレーディング指導者としての実務経験をもとに開発され、市場の方向性の評価、重要な価格水準の特定、複数の時間足を組み合わせた分析など、体系的な分析プロセスを支援します。 相場の背景を踏まえた分析 個々のシグナルの意味は、相場の状況によって変わります。Boba Analysis Suite は、現在のチャート状況をより大きな市場構造と関連付け、あらかじめ定めたルールに沿って取引アイデアを検討するための分析を支援します。 主な分析機能: トレンドと市場構造: 市場の方向性と、その背景にある構造を評価します。 重要な価格帯と価格水準: さらに分析すべき重要な領域を視覚的に表示します。 複数の時間足: 異なる時間足の情報を組み合わせ、相場全体の状況を評価します。 視覚的な分析プロセス: 分析情報をチャート上で直接確認できます。 自主的な取引判断を支援 Boba
FX Power: 通貨の強弱を分析して、より賢い取引を実現 概要 FX Power は主要通貨と金の実際の強弱をあらゆる市場状況で理解するための必須ツールです。強い通貨を買い、弱い通貨を売ることで、 FX Power は取引の意思決定を簡素化し、高い確率の取引機会を見出します。トレンドを追従する場合でも、極端なデルタ値を使用して反転を予測する場合でも、このツールはあなたの取引スタイルに完全に適応します。ただ取引するだけではなく、 FX Power で賢く取引をしましょう。 1. なぜ FX Power がトレーダーにとって非常に有益なのか 通貨と金のリアルタイム強弱分析 • FX Power は主要通貨と金の相対的な強弱を計算し、マーケットダイナミクスに関する明確な洞察を提供します。 • どの資産がリードしているか、または後れを取っているかを監視して、取引するペアを賢く選びましょう。 マルチタイムフレームの包括的なビュー • 短期、中期、長期のタイムフレームで通貨と金の強弱を追跡し、マーケットトレンドに基づいて取引戦略を調整できます。 • スキャルピングからスイングトレード
FiboSniper Pro – Multi-Filter Fibonacci System with Auto SL/TP and Control Panel FiboSniper Proは、動的なFibonacci Envelopesと複数の確認フィルターを組み合わせ、選別されたBuyおよびSellシグナルを生成するテクニカルインジケーターです。FibonacciレベルはMoving AverageとATRを基に計算され、その後ADX、EMA、RSI、ATR、Volume、Time、Candle構造によってフィルタリングされます。インジケーターは、ATRに基づく自動Stop LossおよびTake Profitレベルをチャート上に直接表示し、さらに迅速な調整が可能なインタラクティブControl Panelを提供します。 ご購入後、MQL5で私にメッセージを送っていただくと、Auto Trader Xを無料で受け取れるほか、このインジケーターの取引シグナルを自動化する方法についての説明もご利用いただけます。 User GuideとSet Files: [Click here] 完全
M1 SNIPER は使いやすいトレーディングインジケーターシステムです。M1時間足向けに設計された矢印インジケーターです。M1時間足でのスキャルピングのためのスタンドアロンシステムとして、また既存のトレーディングシステムの一部としても使用できます。このトレーディングシステムはM1時間足での取引に特化して設計されていますが、他の時間足でも使用できます。元々、この手法はXAUUSDとBTCUSDの取引用に設計しましたが、他の市場においても役立つと考えています。 インジケーターのシグナルは、トレンドの方向と逆方向に取引できます。インジケーターのシグナルを利用して両方向に取引するのに役立つ特別な取引テクニックをご紹介します。この手法は、特別な動的なサポートとレジスタンスの価格帯を利用することに基づいています。 ご購入後、M1 SNIPER矢印インジケーターをすぐにダウンロードできます。さらに、M1 SNIPERツールのすべてのユーザーに、以下のスクリーンショットに表示されているApollo Dynamic SRインジケーターを無料で提供しています。この2つのインジケーターを組み合わせることで
Apex Patterns PRO インジケーターをご購入いただくと、それに基づいたExpert Advisorを無料でご提供します。 自己最適化するチャートパターンおよびブレイクアウト分析システム 従来のパターンスキャナーは固定のパラメータに依存しているため、市場のボラティリティや構造が変化するとパフォーマンスが低下することがよくあります。 Apex Patterns PROは、構造的なチャートパターン認識、モメンタムフィルタリング、および統計的な自己最適化を単一の分析フレームワークに統合することで、変化する市場環境に適応するように設計されています。 適応型スキャンエンジン 自己最適化パターンモード 最近の履歴データから適切なパターンパラメータを自動的に検索し、静的な設定を使用するのではなく、現在の市場の動きに合わせてインジケーターの構造検出を適応させます。 スマートブレイクアウトフィルタリング 古典的なパターン認識と、モメンタム、ボリューム、プライスアクションの指標を組み合わせます。すべてのブレイクアウトを同じように扱うのではなく、システムが根底にある市場構造を評価し、現在の統計
Sqn Max Indicator Sqn Max is an exclusive indicator to trade the market with high effectiveness. The indicator is based on price action, volatility and trend. This indicator is as simple as possible but not too simple. The indicator can generate alerts to ease the trading process. You don't have to stay all day in front of your screen. The indicator can be used with any class of assets and with any time frame. It is possible to achieve better results trading our list of selected assets. We achi
Adaptive Price Action Engine インジケーターを購入すると、EAが無料に マルチタイムフレーム対応・自己最適化トレンド&ローソク足パターン分析 市場環境は常に変化しており、すべてのPrice Actionパターンが、あらゆる市場環境で同じ価値を持つわけではありません。 Adaptive Price Action Engine は、変化する市場環境への適応を目的として、 トレンド構造、マルチタイムフレーム分析、ローソク足パターン、統計的最適化 を1つの分析フレームワークに統合しています。 2つのアダプティブモード Dual Alpha Trend Mode 低い時間足と高い時間足のAlpha Trendパラメータを自動的に探索し、直近の市場動向に合わせてトレンド判定を適応させます。 Candlestick + Alpha Mode Alpha Trendによる市場レジーム判定と、 22種類の強気・弱気ローソク足パターン を組み合わせます。すべてのパターンを同じように扱うのではなく、さまざまなパターンの組み合わせを統計的に評価し、選択された市場環境において過去
Atomic Analyst — MetaTrader 5 ご購入後、MQL5で私にメッセージをお送りいただくと、Smart Universal Expert Advisorを無料で受け取れるほか、オンライン講座、PDFマニュアル、非公開グループへのアクセスもご利用いただけます。 Atomic Analystは、プライスアクション、トレンドの方向、エントリー・決済シグナル、損切り水準、複数の利確水準をチャート上にまとめて表示します。 シグナルを確認し、取引の状況を理解する Atomic Analystは、分析結果をわかりやすい視覚情報として表示します。 • エントリーの候補を見つけるための買い・売りの矢印。 • 取引計画に役立つ損切り水準と複数の利確水準。 • 市場の方向性を評価するトレンド、強さ、モメンタムの指標。 • より広い市場背景を比較する複数時間足の分析。 • 変化する状況を追うための色分けされたローソク足とアラート。 シグナルと補助分析を併せて確認し、その取引機会がご自身のルールに合うかを判断してください。 短期の取引機会から、より大きな値動きまで Atomic A
Tokyo Indicatorは、トレンドの方向性、潜在的な取引シグナル、および市場状況を視覚的に分かりやすく表示します。 色分けされた階段状のトレンドラインにより、強気局面(青色)と弱気局面(マゼンタ色)が明確に区別されます。トレンドの変化に合わせて表示される方向矢印は、売買の好機を強調します。 統合されたダッシュボードには、現在のシグナル、市場のバイアス(傾向)、モメンタム、ボラティリティ、シグナルの品質がひと目で分かるようにまとめられています。これにより、トレーダーはパネルを切り替えることなく、価格変動(プライスアクション)とインジケーターの数値を照らし合わせて分析を行うことができます。 すっきりとしたチャート表示と簡潔な市場概要により、Tokyo Indicatorはトレンド分析や取引判断における体系的なアプローチをサポートします。 あらゆる時間足や銘柄に対応しており、特に金(ゴールド)の取引に適しています。 トレンド スキャナーの強力なサポートを利用して、無料のインジケーターを入手し、プライバシーを守ります。あーみー!     設定 ShowHUD - チャート上のパネ
次回アップデート — バージョン 2.52 近日公開!【新機能】 市場分析とトレードワークフローを強化する、4つの主要な新機能にご期待ください 皆様のトレードニーズに応える4つの新機能により、市場分析を次のレベルへと引き上げます。新機能をご紹介します: 1. TRADE OVERVIEW DASHBOARD 2. CONFLUENCE AT ZONE 3. STRONG & WEAK HIGH/LOW 4. OTE 1. TRADE OVERVIEW DASHBOARD 市場全体の状況をより簡単に把握できるダッシュボードです。トレード判断をサポートするガイダンスを提供し、市場分析とトレード計画を体系的に行えるよう支援します。すべてを1つの画面で確認できます。 マルチタイムフレーム市場概要(Multi-Timeframe Market Overview) 市場の方向性と価格構造をより明確に把握 市場状況をすばやく確認 体系的な市場分析とエントリー計画のためのガイダンス 2. CONFLUENCE AT ZONE 価格が重要なゾーンに入るとき…いくつのサポート要因が一致しているかを確認で
このインジケーターを購入された方には、以下の特典を 無料 で提供しています: 各トレードを自動で管理し、ストップロスとテイクプロフィットを設定し、戦略ルールに基づいてポジションを決済する補助ツール 「Bomber Utility」 様々な銘柄に合わせたインジケーターの設定ファイル(セットファイル) 「最小リスク」、「バランスリスク」、「待機戦略」 の3つのモードで使用できる Bomber Utility 用の設定ファイル このトレーディング戦略をすぐに導入・設定・開始できる ステップバイステップのビデオマニュアル ご注意: 上記の特典を受け取るには、MQL5のプライベートメッセージシステムを通じて販売者にご連絡ください。 オリジナルのカスタムインジケーター 「Divergence Bomber(ダイバージェンス・ボンバー)」 をご紹介します。これは、MACDのダイバージェンス(乖離)戦略に基づいた 「オールインワン」型のトレーディングシステム です。 このテクニカルインジケーターの主な目的は、価格とMACDインジケーターの間に発生するダイバージェンスを検出 し、将来の価格の動きを示
Power Candles V3 - 自己最適化型強弱インジケーター Power Candles V3は 、通貨や銘柄の強さを、適用されたすべてのチャート上で実行可能なトレードプランに変換します。単にローソク足を色分けするだけでなく、バックグラウンドでリアルタイムの自動最適化を実行し、目の前の銘柄に対して最適なストップロス、テイクプロフィット、およびシグナルの閾値を提示します。ワンクリックで実取引に適用でき、エントリーポイント、ストップロス、テイクプロフィットのラインが正確な価格位置にチャート上に表示され、方向性を示すアラートがリアルタイムで発動します。 このツールは、Stein Investmentsのエコシステムの一部です。  18種類以上のツールをすべて閲覧し、AIを活用したセットアップの推奨事項を入手し、  https://stein.investments でコミュニティに参加しましょう クローズしたバーごとに3,000回以上のトレードシミュレーション。9つの強さの状態。2つの戦略を並行してテスト。勝率の高い設定をワンクリックで適用。 なぜこれが必要なのか ほとんどの強
通貨強さウィザードは、取引を成功させるためのオールインワン ソリューションを提供する非常に強力な指標です。このインジケーターは、複数の時間枠のすべての通貨のデータを使用して、このまたはその外国為替ペアのパワーを計算します。このデータは、使いやすい通貨インデックスと通貨パワーラインの形式で表され、特定の通貨のパワーを確認するために使用できます。 必要なのは、取引したいチャートにインジケーターを接続することだけです。インジケーターは、取引する通貨の実際の強さを示します。このインジケーターは、トレンドに合わせて取引するときに有利に利用できる売買高の圧力の極値も示します。このインジケーターには、フィボナッチに基づく可能なターゲットも表示されます。 このインジケーターは、PUSH 通知を含むあらゆるタイプのアラートを提供します。 購入後ご連絡下さい。私の取引のヒントをあなたと共有し、素晴らしいボーナスインジケーターを無料で提供します! 幸せで有益な取引をお祈りします。
Unix Scalper — MetaTrader 5 ご購入後、MQL5で私にメッセージをお送りいただくと、Smart Universal Expert Advisorを無料で受け取れるほか、オンライン講座、PDFマニュアル、非公開グループへのアクセスもご利用いただけます。 セットアップを見つけ、取引プランを確認し、取引方法を選ぶ。 UNIX Scalperは、市場分析、BUY/SELL/WAITの判断、Entry、Stop Loss、TP1、TP2の水準を、見やすいパネルにまとめています。 シグナルと取引プランを確認 • 明確な判断:BUY、SELL、WAIT。 • 明示された水準:Entry、Stop Loss、TP1、TP2。 • 複数時間足の一覧:パネル上で各時間足のシグナルを比較。 • 判断を支える分析:トレンド、モメンタム、出来高、ボラティリティ、サポートとレジスタンス、市場の質。 • 選べるレイアウト:Minimized、Compact、Standard、Full。 シグナルと各水準を確認し、そのセットアップがご自身の取引ルールに合うか判断してください。 ゴール
Crystal Heikin Ashi Signals—Professional Trend & Signal Detection Indicator Advanced Heikin Ashi Visualization with Intelligent Signal System for Manual & Automated Trading Final Price: $149 ---------> Price goes up $10 after every 10 sales . Limited slots available — act fast . Overview User Guide PDF Crystal Heikin Ashi Signals is a professional-grade MetaTrader 5 indicator that combines pure Heikin Ashi candle visualization with an advanced momentum-shift detection system. Designed for both m
Auto Optimized SpeedAngle は、継続的なウォークフォワード最適化(WFO:Walk-Forward Optimization)によりカーブフィッティング(過剰最適化)を排除した、機関投資家レベルのモメンタムベクトルシステムです。市場レジームの変化時に効果が低下する静的な入力に依存せず、アウトオブサンプル(OOS)検証を用いてパラメーターを動的に再キャリブレーションすることで、表示されるシグナルが単なる過去の偶然ではなく、確実な統計的優位性に基づいていることを保証します。 主な機関投資家向けフレームワーク ウォークフォワード最適化エンジン: ルックバック期間やしきい値の数千に及ぶ組み合わせを継続的にスキャンし、データをインサンプルとアウトオブサンプルに厳格に分離します。未検証のデータ環境において数学的優位性が証明された場合にのみ、新しいパラメーター設定を採用します。 定量的目的関数: 単なる純利益の追求ではなく、機関投資家レベルの安定性指標をターゲットとします。システム品質ナンバー(SQN)、期待値(1トレードあたりの平均Rマルチプル)、またはネットRの最適化を選
Smc Pro ToolKit
Talal N Z Aljarusha
5 (14)
SMC PRO TOOLKIT — SMART MONEY ANALYSIS & STRUCTURED TRADE PLANNING SMC Pro ToolKit is a professional Smart Money Concepts analysis workspace for MetaTrader 5. It combines market structure, multi-timeframe analysis, institutional price zones, setup evaluation, confirmation tools, volume context, alerts, and risk planning inside one organized chart environment. One workspace. Multiple layers of confirmation. One structured trading plan. OPEN COMPLETE USER GUIDE MULTI-CONDITION SETUP ENGINE At
マルチ通貨強度・モメンタム・インジケーター MT5 Dynamic Forex28 Navigator は、長年ご愛用いただいている人気インジケーターの進化形であり、5つの力を1つにまとめたものです。 Advanced Currency Strength28 Indicator (700件のレビュー) Advanced Currency IMPULSE with ALERT (530件のレビュー) Currency Strength EXOTICS GOLD Impulse with Alert CS28 Combo Signals (最近のボーナス) 4つのインジケーターを購入してチャートに重ねる必要はありません。すべてが1つの強力なインジケーターに統合されています。28通貨ペアの強度、それらを導く市場のモメンタム、そして両方のアラートを、1つのウィンドウ、1つのチャートで。 上記のプログラムは MQL5 Market で1,200件以上のレビューを獲得し、2016年から MT4 コミュニティで定番となっています。Dynamic Forex28 Navigator MT5 は、実証済
作者のその他のプロダクト
SIMBA GRAVITY SIGNAL Find Where Price Has Weight Every trader has experienced it. You open a chart and begin marking levels. Support. Resistance. Previous highs. Previous lows. VWAP. Higher timeframe structure. Before long, the chart is covered with lines. The real challenge is no longer finding information. The challenge is knowing which information actually matters. SIMBA GRAVITY SIGNAL was built to solve that problem. Instead of treating every level equally, SIMBA analyzes multiple layers of
FREE
SIMBA PROP FIRM EA  A Smarter Approach to Prop Firm Challenges and Funded Account Management Trade with a Plan. Manage Risk with Precision. Protect Every Opportunity. Passing a prop firm challenge is one objective. Keeping the funded account, managing drawdown, and building consistent trading performance is another. SIMBA PROP FIRM EA is designed to help you approach both with a structured, risk-first trading system. Built for MetaTrader 5, SIMBA combines multi-factor trade selection, automated
SIMBA MarketPicker SIMBA MarketPicker is a MetaTrader 5 indicator designed for market scanning, comparison, and market selection . It is provided free of charge and is intended to help traders organize multiple instruments in one view, compare their current technical conditions, and identify markets that may deserve further analysis. iInstead of examining every symbol individually, MarketPicker provides a structured view of configured markets and applies the same analytical framework across them
FREE
SIMBA BOT SCANNER EA : Multi-Symbol MT5 Expert Advisor Scan Multiple Markets. Identify Opportunities. Automate Your Trading. One EA. Multiple Markets. Complete Trading Management. SIMBA BOT SCANNER is a powerful multi-symbol Expert Advisor for MetaTrader 5, designed for traders who want to identify trading opportunities across multiple markets without spending hours monitoring charts manually. Combining intelligent setup scoring, multi-timeframe analysis, automated execution, risk-based positio
SIMBA Manual Assistant Pro You Already Know How to Enter. Now Manage the Trade With a Plan. You already have a trading strategy. Maybe you trade support and resistance. Maybe breakouts, price action, moving averages, market structure, supply and demand, or something completely different. You know how you want to enter. But what happens after you enter? Should you move your stop-loss to break-even? Should you take partial profit? Should you let the trade run? Is that pullback normal, or is the m
SIMBA Price Navigator Stop asking “Buy or Sell?” — start asking “Where is price going, and what would prove me wrong?” You can have a great trading strategy and still struggle with one simple question: Where is price likely to go next? Your strategy may tell you when to enter. Your indicators may tell you the trend. Your Fibonacci levels may show important areas. But what about the destination ? That is where SIMBA Price Navigator comes in. SIMBA Price Navigator is an MT5 analysis indicator desi
SIMBA POSITION MANAGER PRO You already know how to enter. SIMBA helps you manage what happens next. After more than 5 years of trading, I have learned something that many traders discover the hard way: Finding an entry is not the hardest part of trading. Managing the position after you enter is. There is almost nothing more frustrating than closing a good trade too early... Only to watch price continue directly toward the take-profit you originally planned. And there is almost nothing worse than
Simba Cloud EA
Emmanuel Ndacyayisenga
SIMBA CLOUD EA Automated Trading and Position Management for MetaTrader 5 Developed by ShieldNexus | Powered by the SIMBA Trading System SIMBA CLOUD EA is designed for traders who want more than basic trade execution. It combines automated market evaluation, configurable trading logic, and active position management in one integrated system. Whether you are developing your trading routine or looking to automate an established approach, SIMBA CLOUD EA provides a systematic framework for evaluati
SIMBA MARKET FORECAST MACHINE Stop Chasing BUY/SELL Signals. Start Forecasting the Market. You probably already have enough indicators. RSI. MACD. Moving averages. Stochastic. Trend indicators. Buy arrows. Sell arrows. The problem is not finding another indicator. The problem is understanding what the market is actually doing . A normal indicator may tell you: BUY But what happens next? Where is price likely to go? How strong is the setup? What market regime are you in? What could invalidate the
SIMBA Price Signal  Rule of Seven + DeMark Forecast & Market Structure Dashboard See the market. Plan the trade. Track the outcome. SIMBA Price Signal is a non-trading analytical indicator for MetaTrader 5 designed to help traders analyze market direction, potential price targets, supply and demand zones, market exhaustion, risk-to-reward, and overall setup quality from one dashboard. The indicator combines Rule of Seven projections, DeMark Sequential analysis, H1 supply and demand zones, Fibona
SIMBA GUARDIAN EA Automated Trend-Following Expert Advisor for MetaTrader 5 Identify opportunities. Execute systematically. Manage trades with discipline. A Smarter, More Structured Way to Trade Meet SIMBA GUARDIAN EA , an automated trading solution for MetaTrader 5 built around trend-following, systematic trade execution, and structured position management. Designed for traders who value a rules-based approach, SIMBA GUARDIAN EA evaluates market conditions, identifies qualifying trading opport
SIMBA PROP FIRM MANAGER: Professional Risk & Trade Management for MT5 Trade Your Strategy. Manage Your Risk. Protect Your Progress. You may already have a profitable trading strategy. You understand market structure, identify quality setups, and know when to enter the market. Yet, challenges can still fail because of inconsistent risk management, emotional decisions, excessive trading, or poorly managed open positions. SIMBA PROP FIRM MANAGER is designed for traders who want to approach prop fir
フィルタ:
レビューなし
レビューに返信