Supply Demand Zone Mapper
- Indicators
- Version: 1.0
- Activations: 5

# Supply Demand Zone Mapper - Compressed base and decisive departure
*Category: Support and Resistance | Difficulty: intermediate | Window: chart window (overlaid on price) | Markets: Universal (Forex, indices, commodities, crypto, stocks) | Suggested timeframes: M15, M30, H1, H4, D1*
## Short description
> Recognises consolidation bases followed by a decisive move and draws them as zones, which remain until price crosses them fully.
## Full description
### Overview
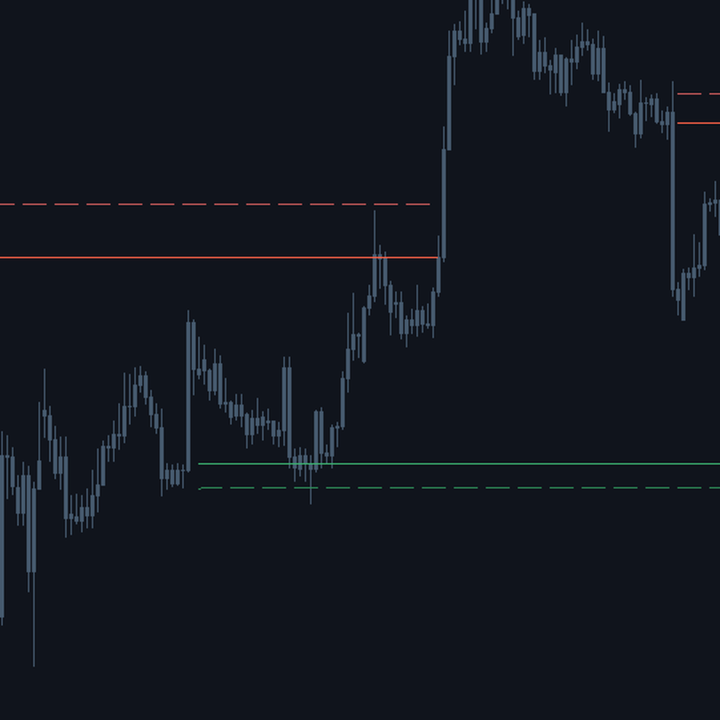
A demand zone forms where price paused briefly before departing decisively: that consolidation is where orders accumulated, and when price returns to that band the orders left unfilled tend to make themselves felt. It is a concept widely used in discretionary analysis, but identifying it by eye is subjective and two traders draw different zones on the same chart. The indicator automates recognition of the sequence with explicit criteria: it locates a base, meaning a few bars of range compressed relative to ATR, and verifies it is followed by a move of sufficient size within a defined number of bars. Only then does the base become a valid zone, drawn with its two edges, which remain until price crosses it fully, at which point the zone is considered consumed.
### How the calculation works
1. The candidate base sits InpMoveBars bars back from the current bar: only there has the subsequent move already been observed.
2. This constraint guarantees a zone is never drawn retroactively on already processed bars.
3. The base range must be below InpMaxBaseAtr times the ATR: the compression that makes it an accumulation zone.
4. The subsequent move must exceed InpMinMoveAtr times the ATR beyond the base extreme.
5. An upward departure produces a demand zone, a downward one a supply zone.
6. The zone is removed when price closes fully beyond the opposite edge: it has exhausted its function.
### How to use it
- Look for entries on the first return of price into a zone: that is where unfilled orders are most likely still present.
- The outer edge of the zone is the natural stop reference, because beyond it the premise has collapsed.
- A very narrow zone indicates a heavily compressed base and therefore concentrated orders: these are the most reliable zones.
- A zone crossed fully disappears from the chart and should no longer be considered: it has been consumed.
- Raise InpMinMoveAtr to select only zones from which price departed most violently.
### Who it is for and on which timeframes
It targets traders working with the supply and demand concept who want to remove subjectivity from drawing zones. It works from M15 to D1. The five parameters correspond to criteria a discretionary trader applies implicitly, so making them explicit also helps clarify one own method. It requires no technical background, but knowing the supply and demand zone concept is essential to correctly interpret the two rectangles drawn.
### Practical example of reading a signal
On XAUUSD H1 price forms three bars with a combined range below one ATR, then departs upwards covering over two and a half ATR in four bars. The base becomes a demand zone and its two edges are drawn. Price rises for twenty bars, then retraces and re-enters the zone. This is the operational moment: the trader goes long with a stop below the lower edge. Price reacts and resumes. Two weeks later price returns to the zone a second time but this time crosses it fully, closing below: the zone disappears from the chart, and correctly so, because the orders supporting it have been absorbed.
## Input parameters
| Parameter | Default | Description |
|---|---|---|
| `InpBaseBars` | 3 | Bars making up the consolidation base. Long bases are rarer but typically more significant. |
| `InpAtrPeriod` | 30 | Reference ATR period for measuring compression and movement. |
| `InpMaxBaseAtr` | 0.90 | Maximum base range, in ATR. Lowering it demands increasingly compressed bases. |
| `InpMinMoveAtr` | 2.00 | Minimum move after the base, in ATR. It is the criterion separating a genuine departure from a mere oscillation. |
| `InpMoveBars` | 4 | Bars within which the move must occur. It also determines the delay before the zone appears on the chart. |
## Advantages / strengths
- It makes zone identification objective, which in discretionary use depends entirely on the observer eye.
- The automatic consumption of crossed zones prevents the chart from filling with zones that have lost meaning.
- All criteria are expressed in ATR, so they work with no calibration on any instrument.
- No repaint: the zone appears only when the formation is complete and is never moved.
## Limitations and warnings
- It shows a single active zone per side: if more than one forms, the earlier ones are replaced.
- The zone appears with a delay of InpMoveBars bars, the price paid for not repainting.
- The compression and movement criteria are sharp thresholds: a base just outside parameters is discarded entirely.
- It does not account for volume, which in the original supply and demand theory plays a relevant role.
**No repaint:** values printed on a closed bar are never modified afterwards.
**Disclaimer.** This product is a technical analysis tool, not an automated trading system, and it offers no profit guarantee whatsoever. Financial markets carry the risk of total loss of the invested capital. Past performance is not indicative of future results. Every signal must be confirmed with your own analysis, a money management plan and prior testing on a demo account. The author is not responsible for trading decisions taken on the basis of this indicator.
## Suggested tags / keywords for MQL5
`supply demand`, `zones`, `price action`, `consolidation`, `breakout`, `levels`, `no repaint`, `institutional`