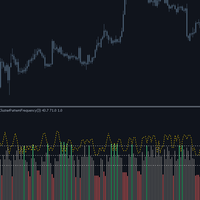
Dual Range Oscillator
- Indicators
- Version: 1.0
- Activations: 5

# Dual Range Oscillator - Two ranges compared
*Category: Oscillators | Difficulty: beginner | Window: separate window below the chart | Markets: Universal (Forex, indices, commodities, crypto, stocks) | Suggested timeframes: M15, M30, H1, H4, D1*
## Short description
> Measures the price position within two ranges of very different length and shows their difference. It separates a move just started from one already mature on every scale.
## Full description
### Overview
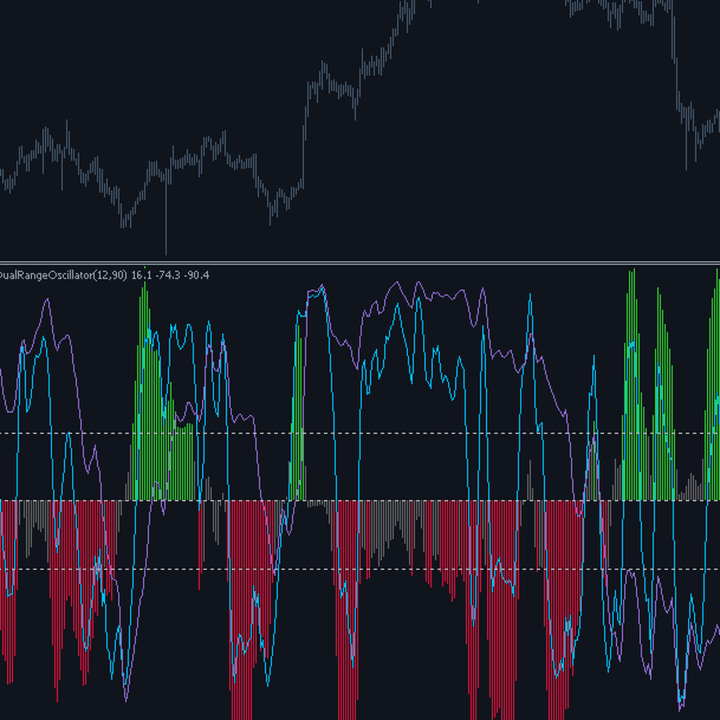
Price can sit at the top of the last ten bars range and at the same time in the middle of the last hundred bars range. The two readings do not contradict each other at all: they simply describe two different scales, and taken separately both are correct. Their difference, however, is the genuinely useful information, because it indicates whether the short term move is anticipating the long term one or is merely an internal oscillation of it. A strongly positive value means the short is at the top while the long is not yet: the signature of a move just started, with room still ahead. A value near zero with both at the top instead describes a move already mature on every scale, where remaining room is smaller and entry risk greater.
### How the calculation works
1. For each scale the highest high and lowest low of the last n bars are located.
2. The close position within that range is expressed from minus one hundred at the low to plus one hundred at the high.
3. A zero range returns the neutral position instead of causing a division by zero.
4. Smoothing is applied directly to the computed positions, which is more stable than smoothing price before the computation.
5. The histogram plots the difference between the short and the long position.
6. Both positions are drawn as lines, so you can tell whether the difference comes from one scale or both.
### How to use it
- A strongly positive histogram with the long line still low indicates a bullish move just beginning.
- Both lines at the top with a histogram near zero describe a mature move: waiting for a pullback is advisable.
- The short line falling while the long stays high is the classic pullback within a trend configuration.
- The ratio between the two periods matters more than the absolute values: keep it around one to seven or one to eight.
- It can also be used as a single line, ignoring the histogram, if a simpler reading is preferred.
### Who it is for and on which timeframes
It is easy to grasp and suits less experienced traders too: the position of price within a range is an immediate concept. It works on all timeframes from M15 up. It is particularly useful to those looking for continuation entries, because it clearly separates a pullback within the trend from an already exhausted move. It requires no statistical background and no knowledge of formulas.
### Practical example of reading a signal
On US500 H1 the long line reads plus eighty, so price is near the high of the last ninety bars: a mature uptrend. The short line falls to minus sixty and the histogram turns strongly negative: on the short scale price has approached the low of the last twelve bars while staying high on the long scale. This is exactly the pullback within a trend configuration. The trader goes long with a stop below the recent low. Over the next eight bars the short line climbs back up, the histogram returns towards zero and price resumes rising.
## Input parameters
| Parameter | Default | Description |
|---|---|---|
| `InpFastRange` | 12 | Bars of the short range. It defines the scale on which pullbacks are observed. |
| `InpSlowRange` | 90 | Bars of the long range. It defines the scale of the underlying tendency. |
| `InpSmooth` | 3 | Smoothing applied to both positions. |
| `InpSpreadLevel` | 30.0 | Difference beyond which the divergence between the two scales is deemed relevant and the histogram is coloured. |
## Advantages / strengths
- An elementary concept, immediately understandable with no formulas to interpret.
- It clearly separates a pullback within the trend from an already exhausted move, operationally decisive information.
- Smoothing applied to the positions rather than to price produces a more stable result.
- A fixed symmetric scale, identical on any instrument and timeframe.
## Limitations and warnings
- The range position depends entirely on the two extremes: a single anomalous spike distorts the reading for the whole window.
- It does not account for how long price spent at the various levels of the range.
- With periods too close together the difference becomes noise dominated and meaningless.
- Like every oscillator it describes the present state and does not anticipate future movement.
**No repaint:** values printed on a closed bar are never modified afterwards.
**Disclaimer.** This product is a technical analysis tool, not an automated trading system, and it offers no profit guarantee whatsoever. Financial markets carry the risk of total loss of the invested capital. Past performance is not indicative of future results. Every signal must be confirmed with your own analysis, a money management plan and prior testing on a demo account. The author is not responsible for trading decisions taken on the basis of this indicator.
## Suggested tags / keywords for MQL5
`oscillator`, `range`, `dual timeframe`, `pullback`, `continuation`, `stochastic`, `no repaint`, `trend`