Dual Range Oscillator

# Dual Range Oscillator - Two ranges compared

*Category: Oscillators | Difficulty: beginner | Window: separate window below the chart | Markets: Universal (Forex, indices, commodities, crypto, stocks) | Suggested timeframes: M15, M30, H1, H4, D1*

## Short description

> Measures the price position within two ranges of very different length and shows their difference. It separates a move just started from one already mature on every scale.

## Full description

### Overview

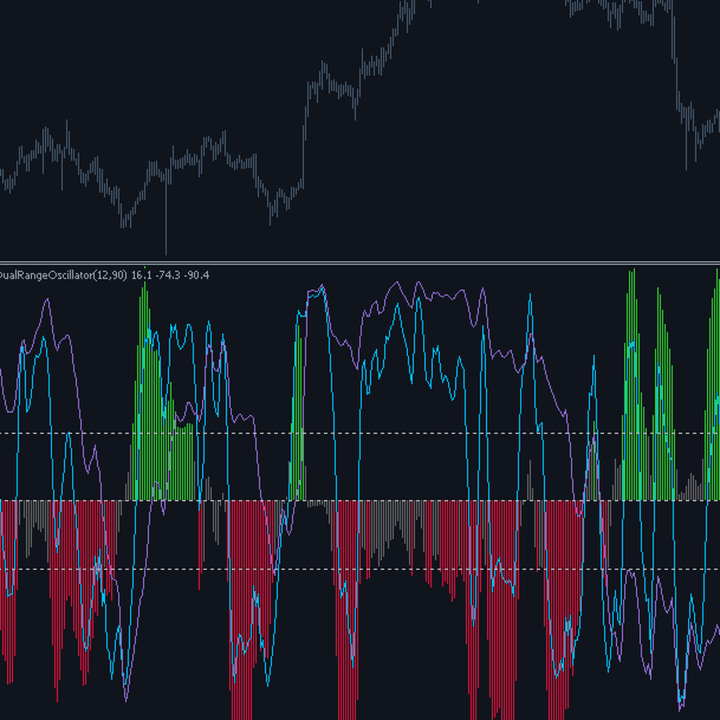
Price can sit at the top of the last ten bars range and at the same time in the middle of the last hundred bars range. The two readings do not contradict each other at all: they simply describe two different scales, and taken separately both are correct. Their difference, however, is the genuinely useful information, because it indicates whether the short term move is anticipating the long term one or is merely an internal oscillation of it. A strongly positive value means the short is at the top while the long is not yet: the signature of a move just started, with room still ahead. A value near zero with both at the top instead describes a move already mature on every scale, where remaining room is smaller and entry risk greater.

### How the calculation works

1. For each scale the highest high and lowest low of the last n bars are located.
2. The close position within that range is expressed from minus one hundred at the low to plus one hundred at the high.
3. A zero range returns the neutral position instead of causing a division by zero.
4. Smoothing is applied directly to the computed positions, which is more stable than smoothing price before the computation.
5. The histogram plots the difference between the short and the long position.
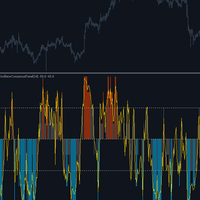
6. Both positions are drawn as lines, so you can tell whether the difference comes from one scale or both.

### How to use it

- A strongly positive histogram with the long line still low indicates a bullish move just beginning.
- Both lines at the top with a histogram near zero describe a mature move: waiting for a pullback is advisable.
- The short line falling while the long stays high is the classic pullback within a trend configuration.
- The ratio between the two periods matters more than the absolute values: keep it around one to seven or one to eight.
- It can also be used as a single line, ignoring the histogram, if a simpler reading is preferred.

### Who it is for and on which timeframes

It is easy to grasp and suits less experienced traders too: the position of price within a range is an immediate concept. It works on all timeframes from M15 up. It is particularly useful to those looking for continuation entries, because it clearly separates a pullback within the trend from an already exhausted move. It requires no statistical background and no knowledge of formulas.

### Practical example of reading a signal

On US500 H1 the long line reads plus eighty, so price is near the high of the last ninety bars: a mature uptrend. The short line falls to minus sixty and the histogram turns strongly negative: on the short scale price has approached the low of the last twelve bars while staying high on the long scale. This is exactly the pullback within a trend configuration. The trader goes long with a stop below the recent low. Over the next eight bars the short line climbs back up, the histogram returns towards zero and price resumes rising.

## Input parameters

| Parameter | Default | Description |
|---|---|---|
| `InpFastRange` | 12 | Bars of the short range. It defines the scale on which pullbacks are observed. |
| `InpSlowRange` | 90 | Bars of the long range. It defines the scale of the underlying tendency. |
| `InpSmooth` | 3 | Smoothing applied to both positions. |
| `InpSpreadLevel` | 30.0 | Difference beyond which the divergence between the two scales is deemed relevant and the histogram is coloured. |

## Advantages / strengths

- An elementary concept, immediately understandable with no formulas to interpret.
- It clearly separates a pullback within the trend from an already exhausted move, operationally decisive information.
- Smoothing applied to the positions rather than to price produces a more stable result.
- A fixed symmetric scale, identical on any instrument and timeframe.

## Limitations and warnings

- The range position depends entirely on the two extremes: a single anomalous spike distorts the reading for the whole window.
- It does not account for how long price spent at the various levels of the range.
- With periods too close together the difference becomes noise dominated and meaningless.
- Like every oscillator it describes the present state and does not anticipate future movement.

**No repaint:** values printed on a closed bar are never modified afterwards.

**Disclaimer.** This product is a technical analysis tool, not an automated trading system, and it offers no profit guarantee whatsoever. Financial markets carry the risk of total loss of the invested capital. Past performance is not indicative of future results. Every signal must be confirmed with your own analysis, a money management plan and prior testing on a demo account. The author is not responsible for trading decisions taken on the basis of this indicator.

## Suggested tags / keywords for MQL5

`oscillator`, `range`, `dual timeframe`, `pullback`, `continuation`, `stochastic`, `no repaint`, `trend`
推荐产品
RED ZONE Monitor Loss-Cut & Break-Even Risk Monitor for Averaging Traders (MT5) RED ZONE Monitor is a risk management indicator for traders who use averaging, scaling-in, or multiple open positions . It visually displays: The loss-cut (liquidation) risk zone The break-even price Based on current open positions, lots, and margin conditions This indicator does not provide entry signals. It does not promise profits. It shows where your account actually fails if price moves against you. What RED ZO
# Dynamic Pivot Zones - Pivots as zones, not lines *Category: Support and Resistance | Difficulty: beginner | Window: chart window (overlaid on price) | Markets: Universal (Forex, indices, commodities, crypto, stocks) | Suggested timeframes: M5, M15, M30, H1* ## Short description > Turns pivots into zones whose width depends on the previous period volatility. The levels stay fixed for the whole session, with no recalculation. ## Full description ### Overview Classic pivots are infinitely
Non-Repainting. Non-Redrawing. Non-Lagging. Signals appear only on confirmed bars. What you see on history is exactly what appeared in real time. Built specifically for Gold (XAUUSD) traders. Gold ML Supertrend MT5 is the only Supertrend indicator on MQL5 that learns. Instead of using a fixed multiplier, it runs a K-means clustering algorithm on recent price data to find the optimal band width. Then it adapts that width per trading session (Asia/London/NY) based on what actually worked. The resu
Harmonic Hunter
Antonello Belgrano
Harmonic Hunter - Automatic Harmonic Pattern Scanner (Gartley, Bat, Butterfly, Crab, Shark, Cypher) Harmonic Hunter scans price action for X-A-B-C-D swing structures and automatically plots the six most-traded harmonic patterns the moment their Fibonacci ratios align. No manual pivot-hunting required. What it does: Detects swing pivots with a configurable ZigZag algorithm (adjustable depth) Validates each XABCD sequence against the precise ratio rules for Gartley, Bat, Butterfly, Crab, Shark, a
CosmiCLab FIBO
Kirils Subins
CosmiCLab SMC FIBO CosmiCLab SMC FIBO is a professional trading indicator designed for traders who use Smart Money Concepts (SMC), market structure analysis and Fibonacci retracement levels. The indicator automatically detects market swings and builds Fibonacci levels based on the latest impulse movement. It also identifies market structure changes such as BOS (Break of Structure) and CHOCH (Change of Character), helping traders understand the current market direction. CosmiCLab SMC FIBO also pr
RQL Trend Board – Description RQL Trend Board is a simple but powerful multi-timeframe trend dashboard. It shows the current market bias across several timeframes at the same time, using an internal trend-classification method. Each timeframe is displayed as a colored box: Green – bullish bias → look for long setups Yellow – ranging / unclear → no trade zone Red – bearish bias → look for short setups The indicator gives a clear overall picture of where the market wants to go, instead o
FREE
# Oscillator Consensus Panel - Four comparable oscillators *Category: Oscillators | Difficulty: intermediate | Window: separate window below the chart | Markets: Universal (Forex, indices, commodities, crypto, stocks) | Suggested timeframes: M15, M30, H1, H4, D1* ## Short description > Computes four oscillators built on different principles and makes them comparable by converting them into percentile ranks, before aggregating them into a consensus measure. ## Full description ### Overview
Visual Dolphin Indicator
AL MOOSAWI ABDULLAH JAFFER BAQER
Visual Dolphin Indicator Unlock the rhythm of the market with the Visual Dolphin Indicator, your ultimate tool for identifying and capitalizing on market trends with clarity and confidence. Designed for both novice and experienced traders, this indicator eliminates the noise and guesswork, providing crystal-clear buy and sell signals directly on your chart. The Logic Behind the Waves The core of the Visual Dolphin Indicator is a sophisticated yet intuitive dual-wave system based on moving avera
The indicator creates 2 dot lines representing an upper and lower bands and the main indicator aqua line as the price power. If the main line is swimming inside the bands, then you should wait and watch before entering the market. When the main line jumps out or in the bands, then you should make a long or a short position.
Divergence Hunter
Rizwan Akram
5 (3)
Divergence Hunter - Professional Multi-Oscillator Divergence Detection System Overview Divergence Hunter is a professional-grade technical indicator designed to automatically detect and visualize price-oscillator divergences across multiple timeframes. Built for serious traders who understand the power of divergence trading, this indicator combines precision detection algorithms with an intuitive visual interface. Key Features Multiple Oscillator Support: RSI (Relative Strength Index) MACD (Mo
FREE
# Volatility Breakout Projection - Levels projected from the open *Category: Volatility | Difficulty: beginner | Window: chart window (overlaid on price) | Markets: Universal (Forex, indices, commodities, crypto, stocks) | Suggested timeframes: M5, M15, M30, H1* ## Short description > Anchors a reference to each session open and projects two pairs of levels computed as fractions of the average daily range. Levels stay fixed for the whole session. ### Overview If an instrument covers on ave
Smart Fair Value Gap Pro
Joao Luiz Savioli Filho
Unlock the power of Smart Money Concepts (SMC) with the cleanest FVG indicator on the market. Smart FVG Pro is not just another gap detector. It is designed for professional traders who need to filter out noise and focus on high-probability reversal zones. Unlike standard indicators that clutter your chart with every minor gap, Smart FVG Pro uses advanced filtering logic (Trend + Volatility) and a unique "Smart Mitigation" system to automatically remove invalidated zones, keeping your chart clea
RBreaker
Zhong Long Wu
RBreaker Gold Indicators 是黄金期货一种短线日内交易策略,它结合了趋势跟踪和日内反转两种交易方式,既能捕捉趋势行情的利润,又能在行情反转时及时止盈并顺势反手。 该策略曾连续15年被美国《Futures Truth》杂志评选为前十大最赚钱的交易策略之一,具有很长的生命周期,至今仍在国内外普遍使用与研究。 本指标结合了2026年期货黄金的走势,依据14日ATR指标,分别定义了突破系数A,观察系数B,反转系数R更合理的数值,非常不错的指标,已实现年稳定盈利,值得推荐~ 以上指标适合高波动品种,参数适合期货黄金,股指期货等,如果需要其他品种行情,需要单独设定 突破系数A,观察系数B,反转系数R,进行回测才能使用。 欢迎指标售后有问题可以加+V:504282029
Momentum Candle MT5 - Professional Trading Indicator Overview Momentum Candle Detector V4 is a powerful and intelligent indicator designed to identify high-probability momentum candles across all timeframes and instruments. Built with advanced filtering technology, this indicator helps traders spot explosive price movements before they happen. Key Features Core Detection System Universal Compatibility: Works on all pairs - Forex (EURUSD, GBPUSD, USDJPY, etc.), Gold (XAUUSD), Bitcoin (BTCUSD), a
FREE
概述 多级ATR和移动平均带指标是一个强大的工具,旨在帮助交易者识别市场趋势、支撑和阻力水平以及波动性。该指标将多条移动平均线与ATR(平均真实波幅)乘数结合在一起,以创建围绕价格波动的直观带状图。它帮助交易者发现潜在的反转区域、趋势条件和市场整合区域。 特点 多重带状显示: 显示六条动态带,基于移动平均线和ATR计算,使用不同颜色以便于识别趋势(红色、橙色、黄色、绿色、蓝色和紫色)。 ATR波动带: 根据市场波动性调整带状图,通过ATR乘数提供清晰的视觉信号,用于潜在的反转或持续价格走势。 可定制的参数: 完全可以调整ATR乘数和移动平均线周期,以适应不同的市场条件和交易策略。 明确的趋势识别: 带状图根据波动性扩展和收缩,使交易者可以轻松看到趋势、整合期和潜在的突破点。 适用于多个时间框架: 适用于任何交易时间框架,从短期的高频交易到长期投资。 使用方法 趋势识别: 使用该指标来区分趋势市场和横盘市场。扩展的带状图表示波动性增加和潜在的突破,而收缩的带状图表示低波动性和整合。 反转信号: 当价格触及最外侧的带状图时,这通常是潜在反转点的信号。交易者可以在确认其他指标或分析后设置止损
FREE
SM Zones Pro
Arvydas Zukauskas
如果您想嘗試更了解 SM Zones Pro 指標的功能,我們建議您先下載並嘗試免費的 SM 區域指標,該指標適用於在不同時間範圍內與單一 EURUSD 工具配合使用。您可以從這個市場下載 SM Zones。 SMZones Pro 與 SM Zones 不同,它可以同時分析多達 10 種不同的儀器。 SM Zones Pro 指標是根據智慧資金管理策略的原則開發的,對於 MetaTrader 5 (MT5) 平台上的交易者來說是一個非常方便的工具。它以圖形方式在圖表上顯示 SM 策略中使用的所有重要區域:市場結構、流動性增加的價格水平、“價格磁鐵”區域 - 不平衡、訂單塊、fvg、斷路器塊和緩解塊 - 工具價格朝這些區域移動。影響牛市的區域以綠色突出顯示,而影響熊市的區域則以棕色突出顯示。這些水平反映了價格可能變化的區域,通常受到大型機構和銀行訂單的影響。當價格達到這些關鍵區域時,可能會經歷大幅快速的波動,這通常會讓交易者了解如何做出正確的交易決策。 使用淺色主題可以最方便地查看圖表。您可以建立一個方便的淺色主題模板並將其用於所有這些框架。 如何根據您的需求客製化 Smart
Side Zone
Dayanand Pandey
SideZone: Trend Intensity Oscillator – Filter the Noise, Ride the Trend Overview SideZone is a specialized oscillator engineered to solve a common trader's dilemma: distinguishing between a true trend and a ranging market. By clearly visualizing trend direction and sideways consolidation, SideZone helps you stay on the right side of the move while avoiding the whipsaw of low-volatility environments. Its core function is to provide a clear, color-coded visual representation of market sentiment
Visual Neptune Storm Surge indicator
AL MOOSAWI ABDULLAH JAFFER BAQER
Visual Neptune Storm Surge: Ride the Tides of Market Momentum Unleash the power of the ocean's force on your charts with the Visual Neptune Storm Surge indicator. Designed for traders who demand precision and clarity, this tool captures the raw energy of market volatility and translates it into clear, actionable trading signals. Stop guessing the trend and start trading with the confidence of a tidal wave at your back. For just $30, you can equip your trading arsenal with a sophisticated, yet i
Rainbow EA MT5
Jamal El Alama
Description : Rainbow EA MT5 is a simple Expert advisor based on   Rainbow MT5 indicator witch is based on Moving average with period 34. The indicator is incorporated in the EA, therefore, it is not required for the EA to operate, but if you wish, you can download it from   my product page . The Expert Advisor settings are as follows : Suitable for Timeframes up to H1 The parameters below can be set according to your trading rules. StopLoss ( Stop Loss in pips) TakeProfit ( Take Profit in pips
EPoCreW Super ORB H4 Indicator
Livhuwani Neville Ramovha
简体中文(Chinese – Simplified) 欢迎使用 EPo-CreW Forex Super ORB-H4 指标! 本指南将教您如何使用这一强大的工具,根据市场第一个 4 小时开盘区间来识别高概率交易机会。无论您是初学者还是经验丰富的交易者,该系统都将帮助您以更高的信心和一致性进行交易。 交易策略. 这是一个演示产品,将在安装之日起 30 天后到期。 完整版在此: https://www.mql5.com/en/market/product/160926?source=Site OR https://t.me/Fundamental_fx 交易:所有货币、黄金和BTCUSD 注意:确保切换到 M5 时间框架。这是使用此指标的最佳时间框架 策略 1:突破与回调(主要策略) SELL(卖出)设置: 价格向上突破蓝线(高点突破) 出现金色 BREAKOUT(突破)箭头 等待价格收盘回到蓝线下方 出现红色 SELL 箭头(回调入场) 在指示的入场价位卖出(SELL) 止损(SL) 设置在红点处(区间高点上方) 止盈(TP) 设置在蓝点处(TP1、TP2、TP3) BUY(买入)设
FREE
Price Magnet — Price Density and Attraction Levels Indicator Price Magnet is a professional analytical tool designed to identify key support and resistance levels based on statistical Price Density. The indicator analyzes a specified historical period and detects price levels where the market spent the most time. These zones act as “magnets,” attracting price action or forming a structural base for potential reversals. Unlike traditional Volume Profile tools, Price Magnet focuses on price-time d
TrendForce
Moaz Qasem
The Trend Force indicator is a professional analytical tool designed to accurately measure the strength of the overall market trend . It works on all currency pairs and timeframes , and is especially effective in highlighting strong and stable trends that traders can confidently act upon. Trend Force utilizes an advanced algorithm to gauge market momentum, clearly indicating the strength of bullish or bearish trends. This makes it easy to make informed trading decisions, either by relying on it
Has rsi signal
Evgenii Savinov
HAS RSI Signal — 带有止损/止盈计算的专业趋势指标 HAS RSI Signal 是一款强大的交易工具,结合了经典指标与现代噪声过滤算法。该指标通过 Heiken Ashi Smoothed (HAS) 平滑蜡烛图和 RSI 震荡指标进行市场分析,在趋势反转或价格退出超买/超卖区域时,为交易者提供清晰的人场信号。 主要优势: 双重过滤: 使用 Heiken Ashi Smoothed 算法消除市场“噪音”,同时通过 RSI 确认动能强度。 自动计算点位: 指标不仅提供信号,还会根据当前市场波动率 (ATR) 自动计算 止损 (Stop Loss) 和 止盈 (Take Profit) 点位。 视觉直观: 信号以彩色蜡烛图的形式直接显示在主图表上,保持交易界面的整洁有序。 多维度通知: 内置终端弹窗警报、声音提示以及手机推送通知 (Push),确保您不会错过任何交易机会。 核心原理: 指标持续监控 RSI 的极端区域。当价格离开临界区且 HAS 算法确认方向转变时,即生成交易信号。ATR 参数允许止损和止盈根据市场当前的波动性进行动态调整。 核心参数设置: InpPeri
Antabod Multiplier
Rev Anthony Olusegun Aboderin
Antabod Multiplier , the ultimate trading indicator designed to simplify your decision-making process and maximize your trading potential. Built with a robust combination of moving averages and stochastic oscillators, this tool provides clear, actionable signals for both buy and sell opportunities. The Antabod Multiplier stands out with its dynamic trend detection and precision filtering, giving you real-time visual signals to catch trend reversals and optimal entry/exit points with ease. Whethe
VolatilityScan
Evgeniy Grebenuik
Tired of manually sorting through dozens of currency pairs, cryptocurrencies, or stocks trying to find the current market action? VolatilityScan does it for you – automatically, quickly, and clearly. The indicator scans all instruments from your Market Watch on the selected timeframe and ranks them by average volatility. Only the top most dynamic assets are displayed on the screen, with precise percentage figures. - You set the analysis period (number of candles) and timeframe (M1, M5, H1,
Ultimate Candle Patterns
Wojciech Daniel Knoff
Check out my TRADE PLANNER MT5 – strongly recommended to anticipate account scenarios before risking any money. This is a multi-symbol, multi-timeframe, table-based indicator for MetaTrader 5 that identifies 46 types of candlestick formations. Each formation has its own image for easier recognition. The indicator includes popular patterns such as Engulfing, Hammer, Three Line Strike, Piercing, and Doji-like candles. You can check the full list of patterns in the screenshots below. Also you can
SlopeChannelB MT5
MIKHAIL VINOGRADOV
SlopeChannelB – 一种技术分析工具,构建倾斜的价格运动通道,为评估当前市场状况和寻找交易信号提供独特机会。 指标的主要特点: 倾斜的价格运动通道 : 该指标有助于可视化支持和阻力水平,这些水平可能表明潜在的反转点或趋势持续。 线条颜色多样和背景突出显示 : 倾斜的支持和阻力级别以不同颜色显示,通道本身还通过背景额外突出,简化图表的视觉分析。 三种计算线条的选项 : 指标使用回归分析来构建通道线。您可以选择以下三种方法之一: Robust (默认) – 对异常值具有鲁棒性的方法。 OLS (普通最小二乘法) 。 Median (中位数计算) 。 最优模型选择 : SlopeChannelB根据五个质量标准的分析自动选择最适合的通道线变体。 质量参数直接在图表上显示,帮助您评估结果。您还可以使用按钮手动切换通道构建选项。 双信号系统 : 第一信号 – 当价格达到倾斜的阻力或支持级别时发生。 第二信号 – 记录价格从级别到通道中心的移动。 这些信号有助于寻找反弹的入场点,但始终需要其他工具的确认。 与其他指标联合使用 : 建议将SlopeChannelB与振荡器或趋势
通过 Pip Movement Alert MT5 领先市场动能,这是一款多币种指标,专为跟踪和提醒交易者多个符号的精确点数移动而设计,适用于外汇、股票、加密货币和商品交易。在 Forex Factory 和 Reddit 的 r/Forex 等交易社区中备受赞誉,并在 Investopedia 和 TradingView 的讨论中因其检测突发市场变化的能力而受到关注,该指标是希望利用快速价格变化的交易者的必备工具。用户报告称,识别基于点数的重大移动(例如,10点增量)的可靠性高达95%,许多人指出通过利用实时警报捕捉波动性激增,交易时机提高了20-30%。主要优势包括多币种监控、可定制的点数阈值以及轻量级设计,无需持续分析图表即可简化跟踪,非常适合剥头皮、日内交易和波段交易者。 Pip Movement Alert MT5 监控用户定义的符号(默认:EURUSD、GBPUSD、USDJPY、USDCHF),并在价格移动指定点数值(默认:10点)时触发警报,检测绝对价格水平(例如,1.178500、1.178600)。它使用实时计算来识别上升或下降移动,通过弹出窗口、推送通知和电子邮件
FREE
BW Indicators
Sergei Gurov
A tool for creating Bill Williams indicators Our tool provides the ability to set Bill Williams indicators on a chart with a mouse click. - The Awesome Oscillator (AO) indicator helps to assess the driving force of the trend. - Alligator indicator — determines the current state of the trend and possible entry and exit points. - Fractals indicator — helps to identify significant levels  - Accelerator Oscillator (AC) indicator — shows the change in trend acceleration. - Market Facilitation Index
FREE
Divergence Matrix Pro for MetaTrader 5 Divergence Matrix Pro is a confirmed multi-oscillator divergence indicator for MetaTrader 5. It detects regular and hidden divergence between price and selected oscillators, then presents the confirmed structure through divergence lines, pivot labels, action markers, an optional current-timeframe Matrix Panel and optional alerts. The indicator is an analysis and confirmation tool. It does not open or close trades, and the signal score is not a win rate or a
该产品的买家也购买
本产品已针对 2026 年市场进行更新,并针对最新 MT5 版本进行了优化。 价格更新通知: Smart Trend Trading System 目前价格为 $99 。 接下来的 30 次购买 后,价格将上涨至 $199 。 特别优惠: 购买 Smart Trend Trading System 后,请发送私信给我,即可免费领取 Smart Universal EA ,并将您的 Smart Trend 信号转换为自动交易。 Smart Trend Trading System 是一套完整的交易系统,具备不重绘、不回绘、不延迟的特点,专为希望获得更清晰信号、更准确趋势方向以及更有组织交易方式的交易者打造。 Learn Smart Trend Trading System Everything you need to learn, install, and use the product is available here: Online Course:   https://www.mql5.com/en/blogs/post/757466 Visual User Manual — B
Trend Sniper X
Sarvarbek Abduvoxobov
4.73 (15)
Trend Sniper X 是一款适用于 MetaTrader 5 的多周期趋势跟踪指标,可帮助交易者清晰精准地识别趋势方向和潜在的反转点。 适用于 MT4: https://www.mql5.com/en/market/product/193245 价格信息: 当前价格为促销价,随着未来更新和新功能的发布,价格可能会有所变动。 Code2Profit 频道 通过多时间框架分析掌控市场! 如何使用 Trend Sniper X 最大化您的胜率:核心规则与交易时段技巧 技术规格 平台 MetaTrader 5 指标类型 多时间周期趋势指标 运行时间周期 任何图表时间周期,可独立选择更高的时间周期 (M1–MN1) 主要交易品种 外汇、黄金 (XAUUSD) 及其他差价合约 (CFD) 推荐账户 任何账户类型 可视化 彩色趋势蜡烛 (买入/卖出/微弱/变化) + 买入/卖出箭头 附加模块 交易时段方框 (悉尼、东京、伦敦、纽约) 主要功能 多时间周期趋势分析: 直接在当前图表上投射更高时间周期的趋势方向,提供清晰的宏观视角。 弱势/不确定柱检测: 高亮显示趋势条件不明朗的柱线,让交易者避
Neuro Poseidon MT5
Daria Rezueva
4.85 (54)
Neuro Poseidon is a new indicator by Daria Rezueva. It combines precise trading signals with adaptive TP/SL levels - creating best possible trades as a result! Message me and get  Neuro Poseidon Assistant  as a gift to automize your trading process! What makes it stand out? 1. Proven profitability on all assets and timeframes 2. Only confirmed BUY and SELL signals present on the chart 3. Adaptive TP & SL levels generated by the software for each trade 4. Easy to understand - suitable for al
Unix Scalper
Issam Kassas
UNIX Scalper — Gold Scalping Indicator for MetaTrader 5 UNIX Scalper is a focused Gold scalping indicator designed primarily for XAUUSD on M1, M2, M3, M5, M10 and M15. It gives the trader a clear BUY, SELL or WAIT decision together with the complete trade plan: Entry, Stop Loss, TP1 and TP2 . PRICE UPDATE NOTICE: Currently available for $199. The price will   increase to $399   after the next   30 purchases . The concept is simple: wait for the signal, follow the levels, move the Stop Loss to
Welcome to ENTRY IN THE ZONE AND SMC MULTI TIMEFRAME Entry In The Zone and SMC Multi Timeframe is a real-time market analysis tool based on Smart Money Concepts (SMC), designed to analyze market structure, price direction, and key trading zones. It supports both Single-Timeframe Analysis and Multi-Timeframe Analysis, providing a clearer view of the overall market structure across multiple timeframes, with real-time BUY / SELL signals that do not repaint. It is designed to help filter trading opp
Zoryk Gold
Reda El Koutbane
5 (7)
折扣将在 24 小时后结束——下一价格为 69 美元 ZORYK — MetaTrader 5 专用高级 XAUUSD 黄金信号系统 你一定熟悉这种感觉。 你花了很多时间分析黄金,等待合适的入场机会。终于开仓后,价格却立刻朝相反方向移动。你过早平仓、移动止损,或者只犹豫了几秒钟。随后,市场却在没有你的情况下到达了你原本预期的目标。 问题并不总是方向判断错误。 真正的问题是缺乏确定性。 你不知道准确的入场位置在哪里。 你不知道什么时候交易逻辑已经失效。 你不知道应该先锁定较近的利润,还是继续等待更大的行情。 你也不知道当前信号是否足够强,还是自己只是在强行寻找交易机会。 黄金市场变化非常快。一个没有明确计划的好想法,可能在几秒钟内变成错误的交易决定。 ZORYK 正是为了解决这个问题而开发。 什么是 ZORYK ZORYK 是一套完整的 XAUUSD 黄金信号与交易计划系统,专门为 MetaTrader 5  和 M5 时间周期 开发。 它不是一个只显示 BUY 或 SELL 箭头,然后让你独自决定其余所有内容的简单指标。 每个确认后的信号都可以在图表上显示完整的可视化交易计划,包
SMC Intraday Formula
Kareem Abbas
5 (22)
让我们先坦诚一点。 没有任何一个指标可以单独让你实现盈利。如果有人告诉你可以,那他是在向你兜售一个梦想。任何显示完美买卖箭头的指标都可以被做得看起来毫无瑕疵——只需要放大历史中的某一段并截取成功交易的截图。我们不会这样做。 SMC Intraday Formula 是一个工具。 它为你读取市场结构,标记出概率最高的价格区域,并用简单直白的语言准确告诉你当前智能资金的行为轨迹。你仍然需要做决定。你仍然需要执行交易。但现在,你是带着精确性执行,而不是靠希望。 我们已经在黄金(XAUUSD)以及主要外汇货币对的日内剥头皮交易中使用该指标将近三年。这是我们在 M1、M5、M15 和 M30 上的日常主力工具。它之所以有效,是因为它不试图预测未来——它展示的是当前正在形成的高概率交易机会,并解释 为什么 。 它与其他所有指标有什么不同? 大多数交易指标只做一件事。移动平均线交叉。振荡指标触及某个水平。出现一个箭头。你进场交易。你亏损。你责怪指标。重复。 SMC Intraday Formula 将多个机构级概念整合为一个统一的市场解读: - 斐波那契共振引擎 不只是普通的斐波那契水平——该指标
GoldenX Entry MT5
Kareem Abbas
5 (16)
GoldenX Entry 是一款用于 MT5 的指标,包含自适应 Smart Entry Trend 算法、信号评分系统、市场状态识别器以及波动率过滤器。每个信号都包含计算得出的入场位、三个止盈位(TP1、TP2、TP3)以及止损位。它基于多个分析层构建,旨在适应不同市场条件,将多层分析系统与内置优化器及统计跟踪系统相结合。该指标基于风险收益比(RR)指标和历史交易行为提供量化分析。 开始使用非常简单——在所选时间周期上运行优化器,然后在图表上开始使用该指标。 核心功能 GoldenX Entry 将信号引擎与内置交易管理及历史统计跟踪整合在同一图表中: - 内置优化器: 优化器可在图表上单击运行。它通过两阶段搜索流程测试200种参数组合——先进行探索,再进行优化——并在完成后自动应用选定配置。结果会按时间周期缓存,因此当返回已优化的周期时,会立即恢复相同设置。 - 黄金品种自动周期识别: 将指标加载到任何 XAUUSD 图表(M1 到月线)。系统会自动识别当前周期并加载对应预设。共包含9个时间周期配置文件,专为黄金在标准周期上优化设计。切换周期时,参数会自动调整。 - 资金参考面
SuperScalp Pro
Van Minh Nguyen
4.63 (32)
SuperScalp Pro – 专业多层级共振剥头皮交易系统 SuperScalp Pro 是一款专业的剥头皮交易指标,基于多层级信号确认系统构建,将 Supertrend 与 VWAP、EMA、RSI、ADX、Volume、Bollinger Bands 和 MACD Divergence 等高级市场分析工具相结合。通过结合趋势分析、动量、成交量和市场波动率,SuperScalp Pro 为识别潜在交易机会提供了一种结构化的方法,在图表上直接显示清晰的 Buy 和 Sell 信号,同时根据 ATR 波动率自动计算 Stop Loss 和 Take Profit 水平。 购买后,请联系我,以获取如何使用 SuperScalp Pro Auto Trader 自动执行 SuperScalp Pro 信号的指导。 使用 SuperScalp Pro Auto Trader 自动执行 SuperScalp Pro 交易信号: [Auto Trader] 完整文档和推荐的 set 文件可在产品博客中查看: [User Guide] 关注官方 SuperScalp Pro MQL5 Chann
Superhero
Ihor Otkydach
5 (3)
SUPERHERO 指標是一款基於「全方位」原則設計的多貨幣交易系統。該指標能獨立分析市場,並提供開倉與平倉的交易訊號。它採用止損與獲利了結訂單,風險報酬比(R:R)為 1:1。 我偶爾會根據這個系統的訊號親自進行交易,以下是我獲得的結果—— 即時訊號 此系統可向您的智慧型手機發送推播通知,讓您無需綁定電腦,即可「隨時隨地」進行交易。這對於自營交易公司而言再適合不過了。 每位顧客皆可享額外好禮: 每位購買此指標的買家,都將收到我贈送的一項特別實用工具,該工具: 自動下達止損與獲利了結訂單 當價格達到目標水準時,系統會自動平倉 支援待執行訂單交易 支援均值交易模式 如果您希望將這款優秀且極為便利的工具作為禮物獲贈,請在購買 SUPERHERO 指標後,立即透過 MQL5 平台的私訊與我聯繫。此外,您還將獲得培訓課程「如何安裝與設定 SUPERHERO 並開始穩定獲利」的存取權限。 關於「超級英雄」策略 SUPERHERO 策略是利用價格回調時,順應趨勢方向進行盤中交易。 「超級英雄」程式碼內含數個強大的技術指標,用以分析價格通道的趨勢方向與波動範圍,並能識別在修正性回調後形成的盤中波段反
M1 Sniper MT5
Oleg Rodin
5 (7)
M1 SNIPER   是一款易于使用的交易指标系统。它是一个专为 M1 时间框架设计的箭头指标。该指标可以作为独立的系统在 M1 时间框架下进行剥头皮交易,也可以作为您现有交易系统的一部分使用。虽然该交易系统专为 M1 时间框架交易而设计,但它也可以用于其他时间框架。我最初设计此方法是为了交易 XAUUSD 和 BTCUSD。但我发现这种方法在其他市场交易中也同样有用。 指标信号既可以顺势交易,也可以逆势交易。我教授一种特殊的交易技巧,帮助您利用指标信号进行双向交易。该方法基于使用特殊的动态支撑位和阻力位区域。 购买后,您可以立即下载 M1 SNIPER 箭头指标。此外,我还为所有 M1 SNIPER 工具用户免费提供下方屏幕截图所示的 Apollo Dynamic SR 指标!这两个指标的组合可以帮助您更轻松、更准确地利用 M1 时间框架进行交易。 购买后请联系我,免费获取交易提示和奖励指标! 祝您交易成功!
Gann Made Easy MT5
Oleg Rodin
5 (9)
Gann Made Easy   是一个专业且易于使用的外汇交易系统,它基于使用先生理论的最佳交易原则。 W.D.江恩。该指标提供准确的买入和卖出信号,包括止损和获利水平。您甚至可以使用推送通知在旅途中进行交易。 购买后请联系我,即可免费获得交易指导和超棒的额外指标! 您可能已经多次听说过江恩交易方法。通常 Gann 的理论不仅对于新手交易者而且对于那些已经有一定交易经验的人来说都是非常复杂的东西。这是因为江恩的交易方法在理论上并不那么容易应用。我花了几年时间来完善这些知识,并将最好的原则应用到我的外汇指标中。 该指标非常易于应用。您所需要的只是将其附加到您的图表并遵循简单的交易建议。该指标不断进行市场分析工作并寻找交易机会。当它检测到一个好的入口点时,它会为您提供一个箭头信号。该指标还显示止损和获利水平。 换句话说,当您像先生一样进行交易时,该指标会为您提供最佳江恩建议。江恩亲自告诉你此时此刻该做什么。但最好的部分是您不需要了解任何有关江恩交易原则的知识,因为该指标会为您完成整个市场分析工作。
Divergence Bomber
Ihor Otkydach
4.89 (94)
我偶爾會親自使用這個系統進行交易。 請評估我在真實帳戶上進行的手動 BOMBER 交易—— LIVE SIGNAL 购买该指标的每位用户将额外免费获得以下内容: 原创工具“Bomber Utility”,该工具会自动跟踪每一笔交易,设置止损和止盈点,并根据策略规则自动平仓; 适用于不同交易品种的指标设置文件(Set 文件); 三种不同风险模式下的 Bomber Utility 设置文件:“最低风险”、“平衡风险” 和 “观望策略”; 一套详细的 视频操作手册,帮助您快速完成安装、配置并开始使用本交易系统。 注意: 要获取以上所有赠品,请通过 MQL5 的私人消息系统联系卖家。 我为您介绍原创的自定义指标 “Divergence Bomber”(背离轰炸机),它是一套基于 MACD 背离交易策略 的“全功能”交易系统。 该技术指标的主要任务是识别 价格与 MACD 指标之间的背离,并发出交易信号(包括推送通知),指示未来价格可能的运动方向。平均而言,这些信号的准确率超过 98%。有关该指标如何工作的详细说明,请观看本页面上的视频演示。 该系统使用 止损订单 和 动态回撤平仓机制 来管理
Atomic Analyst MT5
Issam Kassas
4.44 (54)
本产品已针对 2026 年市场进行更新,并针对最新 MT5 版本进行了优化。 价格更新通知: Atomic Analyst 目前价格为 $99 。 接下来的 30 次购买 后,价格将上涨至 $199 。 特别优惠: 购买 Atomic Analyst 后,请发送私信给我,即可免费领取 Smart Universal EA ,并将您的 Atomic Analyst 信号转换为自动交易。 Atomic Analyst 是一款不重绘、不回绘、不延迟的 Price Action 交易指标,专为手动交易、清晰信号和 EA 自动化而设计。 User manual: settings, inputs and strategy.   &   User Manual PDF . 它分析价格行为、强度、动能、多周期方向和高级过滤器,帮助交易者减少噪音,避免弱势交易机会,并做出更有结构的交易决策。 该指标将复杂的市场计算转换为简单的视觉信号、彩色K线、趋势读数、止损水平和多个止盈区域,使交易者能够快速理解并应用于真实市场环境。 主要交易用途: 剥头皮和日内交易: 专为快速决策、清晰箭头、提醒、K线颜色和
Entry Points Pro for MT5
Yury Orlov
4.51 (150)
传奇回归:Entry Points Pro 10。 这款传奇指标曾 3 年稳居 MQL5 Market 前三,如今全面重启。 数百条热情好评(两个版本合计 589 条),每天有数千名交易者用它交易,演示版下载 31,000+   MT4+MT5  次。 五年来我读过你们的每一条评价——在第 10 版里,我没有给出许诺,而是把答案直接做进了产品。指标作者自 1999 年入市, 珍视诚信、自己的声誉和自己的客户 。 Entry Points Pro 给出的入场信号严格不重绘。 而且这一次不再只是作者的一面之词,而是可验证的事实:确认信号只在 K 线收盘后标出,自动化测试记录到 零重绘 (在 EURUSD、XAUUSD 和 BTCUSD 上共 2,486,568 次不变量检查——0 次违规)。测试方法完全公开——您可以在策略测试器中自行复现。 购买后请务必第一时间给我发私信。 我会发给您 扩展版说明书《交易者圣经》 ——使用本指标交易的完整指南——并告诉您如何免费获得 赠品:市场扫描器 ,它能同时分析多个品种和多个时间周期,并在一个界面上显示 Entry Points Pro 此刻在哪里表现
Azimuth Pro
Ottaviano De Cicco
5 (7)
Azimuth Pro V2:MT5合成分形结构分析与确认入场 概述 Azimuth Pro 是 Merkava Labs 推出的多层级波段结构指标。四层嵌套波段层级、锚定波段的VWAP、ABC形态识别、三时间框架结构过滤以及收盘确认入场——一个图表,一个从微观波段到宏观周期的完整工作流程。 这不是盲目的信号产品。它是一个以结构为先的工作流程,专为重视位置、背景和时机的交易者打造。 ️ 夏季促销 — 庆祝夏至与 The Oracle Pro 上市:Azimuth Pro 七折优惠,现价 279 美元(原价 399 美元)。限时夏季优惠。 1. V2的变化 合成多时间框架引擎 高时间框架分析从零开始重建,采用与Meridian Pro相同的专有合成架构。更清晰的HTF背景、稳定的实时行为、无经典MTF同步问题。合成引擎还解锁了 固定比率时间框架级联 (x2、x3、x4、x6)——不再在经纪商的固定时间框架之间任意跳转,您可以按图表时间框架的固定倍数分析结构,在每个尺度上保持相同的分形关系。 确认入场箭头 作为稳定且可恢复的执行层而设计的收盘确认箭头。当ABC设置形成且自适应确认逻辑
FiboSniper Pro
Van Minh Nguyen
5 (2)
FiboSniper Pro – 专业多重过滤 Fibonacci 网格交易系统 FiboSniper Pro 是一套先进的技术交易指标系统,将 Fibonacci Envelopes 与多层市场确认条件相结合,包括 ADX、EMA、RSI、ATR 和时间过滤器。通过综合分析价格结构、趋势、动量和波动率,该系统帮助交易者识别更加精选且质量更高的入场机会,同时提供基于 ATR 自动计算的 Stop Loss 和 Take Profit 水平,以实现结构化的交易管理。 购买后,请联系我获取使用 Auto Trader X 自动交易 FiboSniper Pro 信号的操作说明。 使用 Auto Trader X 自动执行 FiboSniper Pro 交易信号: [Auto Trader X] 查看用户指南并下载推荐的设置文件: [Click here] 加入 FiboSniper Pro MQL5 官方公开频道,获取产品更新和新闻: [Click here] 该系统使用 5 个 Fibonacci 水平(23.6%、38.2%、50%、61.8% 和 100%)识别动态支撑和阻力区域,这
UZFX {SSS} 超短线智能信号 v5.0 MT5 是一款无重绘的高性能交易指标,专为在快速波动的市场中需要精准、实时信号的超短线交易者、日内交易者和波段交易者设计。该指标由 (UZFX-LABS) 开发,融合了价格行为分析、趋势确认和智能过滤技术,可在所有货币对和时间周期内生成高概率的买卖信号、预警信号以及趋势延续机会。 别再对交易犹豫不决了,开始遵循这一专为追求清晰、精准和纪律性市场执行的交易者设计的结构化信号系统吧。 相信我,这是 MQL5 上最优秀的指标之一,所以千万不要错过!!“为睿智交易者打造的智能信号” 最新 5.0 版本现已发布,价格可能会在未事先通知的情况下上涨至 499.99 美元,所以请尽快入手,以免错失良机!! 最终购买前!如果您想获取免费试用版,请通过 WhatsApp 号码 +923030751987 联系我!! 如果您遇到任何问题“或”有任何不明白的地方,请在私聊中向我咨询!!! 主要功能更新 • 自动买入和卖出信号检测 • 先进的反转识别逻辑 • 潜在市场反转前的预警信号 • 趋势延续确认信号 • 内置风险管理功能,包含入场点、止损点、TP1、
Axiom Matrix
Issam Kassas
5 (6)
AXIOM MATRIX MT5 首发价格:$99 Axiom Matrix 现以 $99 的首发价格提供。 前 30 次购买完成后,价格将上涨至 $199。 购买后,请直接私信我,以获取使用说明并领取您的专属赠品奖励。 Axiom Matrix 是一款适用于 MetaTrader 5 的专业多品种、多时间周期市场扫描器和决策仪表板。 它会扫描您的 Market Watch,分析多个时间周期,读取多个证据引擎,比较最强的交易机会,并在一个清晰的矩阵仪表板中显示最佳 BUY、SELL、WAIT 或被阻止的状态。 我开发 Axiom Matrix,是因为我想要一个可以替我完成繁重市场扫描工作的工具。 我不想只单独检查 RSI。 然后单独检查 MACD。 然后检查移动平均线。 然后检查成交量。 然后检查波动率。 然后检查支撑和阻力。 然后还要手动在不同品种和时间周期之间切换,只为了建立一个交易思路。 我想要一个仪表板,可以扫描市场、比较证据、排序最佳机会,并告诉我现在最强的交易设置在哪里。 这就是 Axiom Matrix 背后的核心理念。 AXIOM MATRIX 的功能 Axiom Ma
Advanced Supply Demand MT5
Bernhard Schweigert
4.53 (15)
任何新手或专业交易者的最佳解决方案! 该指标是一款独特、高质量、且价格合理的交易工具,因为我们已经整合了许多专有功能和新公式。 依据此更新,您将能够显示双重时间帧区域。 您不仅可以显示一个较高的时间帧,还可以同时显示图表时间帧,加上更高的时间帧:显示嵌套时区。 供需双方所有交易者都会喜欢它。 :) 重要信息披露 高级供需的最大潜力,请访问 https://www.mql5.com/zh/blogs/post/720245   想象您的交易如何得以改善,是因为您能够精准定位入场或目标位吗? 构建于新的底层算法,它可以更轻松地识别出买卖双方之间的潜在失衡。 这是因为它以图形方式展示供需最强劲区域,及其过去的表现(显示旧区域)。 这些功能旨在帮助您更轻松地发现最佳入场区域和价位。 现在您可以针对您的交易品种和时间帧来优化和编辑区域强度! 高级供需指标适用于所有产品和时间帧。 它是一个新的公式,非常新的功能是两个区域强度函数可由用户输入进行调整! 这在交易中是一大优势。 当您学习如何使用专有功能,例如带有价格游离最小 X 因子的区域强度时,您能够判断该区域强劲与否。 供需区域用作警报触发器。
Crystal Heikin Ashi Signals
Muhammad Jawad Shabir
5 (4)
Crystal Heikin Ashi Signals - Professional Trend & Signal Detection Indicator Advanced Heikin Ashi Visualization with Intelligent Signal System for Manual & Automated Trading Final Price: $149 ---------> Price goes up $10 after every 10 sales . Limited slots available — act fast . Overview Crystal Heikin Ashi Signals is a professional-grade MetaTrader 5 indicator that combines pure Heikin Ashi candle visualization with an advanced momentum-shift detection system. Designed for both manual traders
Power Candles MT5
Daniel Stein
5 (10)
Power Candles V3 - 自我优化的强度指标 Power Candles V3 把货币与品种的强度直接转化为图表上可执行的交易方案。指标不再仅根据强度给K线着色,而是在后台持续运行实时自动优化,为您正面对的品种给出最佳 Stop Loss、Take Profit 与信号阈值。一键采用,Entry、Stop Loss、Take Profit 线就以精确价格绘制在图表上,提醒消息中直接包含方向。 本工具是 Stein Investments 生态系统的一部分 - 18+ 款工具,加上 Max,您的一对一 AI 交易导师。  随时在线,深入了解每一款指标,在您需要梳理思路的那一刻就在那里。  立即认识他: https://stein.investments 每根收盘K线运行 3,000+ 次交易模拟。9 种强度状态。2 种策略并行测试。一键采用最优配置。 为什么需要这个 大多数强度指标只给您一个数值,然后留下三个问题:相信哪个阈值、用哪个 Stop Loss、走哪个交易方向。Power Candles V3 在每根收盘K线上自动回答这些问题。结果就是一个完整的交易方案 -
Trend Catcher ind mt5
Ramil Minniakhmetov
5 (18)
趨勢捕捉指標 趨勢捕捉指標結合了作者獨有的客製化自適應趨勢分析指標,用於分析市場價格趨勢。它透過過濾掉短期噪音,並專注於潛在的動能強度、波動性擴張和價格結構行為,來識別真實的市場方向。此外,它還結合了平滑和趨勢過濾等客製化指標,例如移動平均線、相對強弱指標 (RSI) 和波動率過濾器。 您可以在這裡查看實際運行情況以及我的其他產品: https://www.mql5.com/en/users/mechanic/seller 請注意,我不會在 Telegram 上出售 EA 或任何設置,那是騙局。所有設定都可以在我的部落格上免費取得。 重要提示!購買後請立即聯繫我,以獲取使用說明和額外獎勵! 請注意,我不會在 Telegram 上出售 EA 或任何設置,那是騙局。所有設定都可以在我的部落格上免費取得。
TrendMaestro5
Stefano Frisetti
note: this indicator is for METATRADER4, if you want the version for METATRADER5 this is the link:  https://www.mql5.com/it/market/product/108106 TRENDMAESTRO ver 2.5 TRENDMAESTRO recognizes a new TREND from the start, he never makes mistakes. The certainty of identifying a new TREND is priceless. DESCRIPTION TRENDMAESTRO identifies a new TREND in the bud, this indicator examines the volatility, volumes and momentum to identify the moment in which there is an explosion of one or more of these da
SR Liquidity MT5
Oleg Rodin
5 (2)
SR Liquidity   是一款旨在揭示市场流动性高度集中且价格反应最剧烈的隐蔽区域的交易指标。这些特殊的流动性区域充当着强有力的支撑位与阻力位,为您清晰呈现市场最可能发生反转的位置。 SR Liquidity 指标并非简单地绘制常规的支撑/阻力线,而是通过分析实际的价格行为,识别买卖压力积聚的区域。这些区域实际上是推动市场真实波动的流动性池。通过在图表上直观呈现这些区域,该指标能助您在价格反应发生前预判走势——这意味着它实际上能够预测价格方向可能发生的变化。它将原始的价格行为转化为清晰且具实操价值的市场蓝图,标示出那些可能成为市场转折点的关键价位。 该指标适用于任何交易品种和时间周期——包括外汇、指数、金属、加密货币等。支持任意时间周期。 购买后请联系我,以获取交易指南及免费赠送的优质附加指标!
ATstrong
Zaha Feiz
ATSTRONG PRO: 市场结构与突破指标 突破检测引擎 | 5个动态TP目标 | 实时仪表板面板 | 不重绘 首发价格 当前价格: $59 — 每售出10份价格增加$10。 ATSTRONG PRO 是一款专为 MetaTrader 5 设计的高级突破和机构市场结构指标。 它能够检测高概率波段枢轴,识别集群的支撑和阻力堆积区,并实时发送结构破坏(BOS)和特征改变(CHoCH)信号。 该指标会自动在您的图表上绘制动态止损和5个不同的止盈水平(TP1到TP5), 并配有风险回报预测框、星级信号质量评级以及图表上的实时绩效分析仪表板。 交易提示: 这是一款用于手动交易和市场分析的指标。它在K线收盘时显示清晰的视觉信号、水平和警报,并且 完全不重绘 。它不执行自动交易。 核心亮点与特性 智能突破引擎: 同时检测集群水平区域突破和单波段枢轴突破(BOS / CHoCH)。 突破强度评分: 评估动能、成交量/K线实体大小和枢轴质量,以过滤虚假突破和诱多/诱空。 5阶段止盈水平: 预测可自定义的R倍数目标(TP1: 0.5R, TP2: 1.0R, TP3: 1.5R, TP4:
KURAMA GOLD SIGNAL PRO(MT5)— 7层过滤 · 自动止盈止损 · 质量评分 · 信号历史保存 | 完整的XAUUSD交易系统 实时不重绘。信号出现的瞬间,箭头、入场、止盈、止损当场锁定,之后绝不移动。你交易的就是这个实时信号。而且在v7.20中,每一个真正发出的信号都会自动保存,并在重启后精确还原。 购买者专属赠品 购买永久授权,即可免费获得 AI Zone Radar(价值$59)+ 完整PDF手册。在产品价格之外,额外附赠价值$59的赠品。购买后在MQL5上给我留言即可。 AI Zone Radar: https://www.mql5.com/en/market/product/175834 在黄金交易者社区中被实际使用,因精度与易用性而广受好评。 你的难题 —— 以及解决方案 黄金一天波动$30–$50。你知道机会就在那里。但这些情况是否似曾相识: - 入场太早,价格逆行$10后才朝你的方向
货币强度向导是一个非常强大的指标,为您提供成功交易的一体化解决方案。该指标使用多个时间范围内所有货币的数据来计算这个或那个外汇对的力量。此数据以易于使用的货币指数和货币电力线的形式表示,您可以使用它们来查看这种或那种货币的力量。 您所需要的只是将指标附加到您要交易的图表上,该指标将向您显示您交易的货币的真实强度。该指标还向您显示买卖量压力的极值,您可以在顺势交易时利用这些压力。该指标还显示了基于斐波那契的可能目标。该指标可用于各种交易时间范围。该指标支持各种货币对的交易。   该指标为您提供所有类型的警报,包括推送通知。 购买后请联系我。我将与您分享我的交易技巧,并免费为您提供丰厚的红利指标! 祝您交易愉快,获利丰厚!
Smc Pro ToolKit
Talal N Z Aljarusha
5 (10)
SMC PRO TOOLKIT — 智能资金分析与结构化交易规划 SMC Pro ToolKit 是一款面向 MetaTrader 5 的专业智能资金概念(Smart Money Concepts / SMC)分析工作空间。 它将市场结构、多周期分析、机构级价格区域、交易机会评估、确认工具、成交量背景、提醒系统和风险规划整合在一个结构清晰的图表环境中。 一个工作空间,多层确认,一套结构化交易计划。 打开完整用户指南 多条件交易机会引擎 SMC Pro ToolKit 的核心是一套 多条件交易机会引擎 。 该引擎不会依赖单一指标或单一市场事件,而是通过多个层面的市场信息,对潜在交易机会进行综合评估。 系统会分析市场结构和背景条件,将各项结果整合为 交易机会质量评分 ,并且只有在所需确认框架完整成立后,才会展示相应的交易思路。 市场背景 → 多周期一致性 → 智能资金区域 → 确认信号 → 质量评分 → 交易计划 当交易机会满足条件时,SMC Pro ToolKit 可以直接在图表上生成完整的交易计划,包括: 买入 / 卖出方向 入场价 止损价 止盈价 风险回报比 交易机会质量
Atbot
Zaha Feiz
4.69 (55)
AtBot: 它是如何工作的以及如何使用它 ### 它是如何工作的 “AtBot”指标用于MT5平台,通过结合技术分析工具生成买入和卖出信号。它集成了简单移动平均线(SMA)、指数移动平均线(EMA)和平均真实波幅(ATR)指标,以识别交易机会。此外,它还可以利用Heikin Ashi蜡烛来增强信号的准确性。 购买后留下评论,您将获得特别的奖励礼物。 ### 主要特点: - 不重绘: 信号在绘制后不会改变。 - 不变动: 信号保持一致,不会被更改。 - 无延迟: 提供及时的信号,没有延迟。 - 多种时间框架: 可在任何时间框架上使用,以适应您的交易策略。 ### 操作步骤: #### 输入和设置: - firstkey (TrendValue): 调整趋势检测的灵敏度。 - Secondkey (SignalValue): 定义买入/卖出信号生成的灵敏度。 - masterkey (ExitValue): 控制信号的退出策略。 - h: 切换是否根据Heikin Ashi蜡烛生成信号(真/假)。 - notifications: 启用或禁用信号提醒。 #### ATR计算: ATR测
作者的更多信息
This easy to setup indicator shows you the market volumes in a different way, with support and resistance as showed. You can setup: - Backdays volume to show - Heiken Ashi candle view It works for every kind of graph and every kind of period. The program shows the volumes based on the number of candles displayed in the chart: the more candles the more volumes. Enjoy this very useful indicator. Please feel free to message me to report any kind of improvements! :D
# Adaptive Slope Ribbon - ATR-normalised regression slope ribbon *Category: Trend | Difficulty: intermediate | Window: separate window below the chart | Markets: Universal (Forex, indices, commodities, crypto, stocks) | Suggested timeframes: M15, M30, H1, H4, D1* ## Short description > Five linear regression slopes over growing horizons, normalised in ATR units and comparable across instruments. The histogram shows the mean slope coloured by the level of agreement between time scales. ## Fu
# Fractal Trend Channel - Structural channel from confirmed swings *Category: Trend | Difficulty: beginner | Window: chart window (overlaid on price) | Markets: Universal (Forex, indices, commodities, crypto, stocks) | Suggested timeframes: M15, M30, H1, H4, D1* ## Short description > Step channel built from the last confirmed fractal swings, with a midline coloured by market structure: higher highs and lows, lower highs and lows, or mixed structure. ### Overview Reading structure through
# Volatility Adaptive MA - Variable speed moving average *Category: Trend | Difficulty: intermediate | Window: chart window (overlaid on price) | Markets: Universal (Forex, indices, commodities, crypto, stocks) | Suggested timeframes: M5, M15, M30, H1, H4* ## Short description > A moving average whose smoothing factor is driven by the ratio between short and long term volatility: it accelerates during breakouts and slows down in compressed phases, cutting false crossovers. ### Overview Eve
# Trend Persistence Index - Persistence versus randomness *Category: Trend | Difficulty: advanced | Window: separate window below the chart | Markets: Universal (Forex, indices, commodities, crypto, stocks) | Suggested timeframes: M30, H1, H4, D1* ## Short description > Compares the direction changes actually observed with those expected from a purely random series. Above zero the market persists in one direction, below zero it keeps flipping. ### Overview In a random walk the sign of the
# Kalman Trend Filter - Level and velocity Kalman filter *Category: Trend | Difficulty: advanced | Window: chart window (overlaid on price) | Markets: Universal (Forex, indices, commodities, crypto, stocks) | Suggested timeframes: M15, M30, H1, H4, D1* ## Short description > A two state Kalman filter that simultaneously estimates price level and velocity. The gain self-adjusts: it trusts the model when data are consistent and re-adapts immediately to shocks. ### Overview The Kalman filter
# Multi Scale Trend Agreement - Consensus across eight horizons *Category: Trend | Difficulty: beginner | Window: separate window below the chart | Markets: Universal (Forex, indices, commodities, crypto, stocks) | Suggested timeframes: M5, M15, M30, H1, H4, D1* ## Short description > Checks price position against its own average on eight geometrically spaced scales and condenses the result into a single score from -100 to +100. ### Overview A trend worth the name is recognised from whatev
# Directional Efficiency - Net path versus gross path *Category: Trend | Difficulty: intermediate | Window: separate window below the chart | Markets: Universal (Forex, indices, commodities, crypto, stocks) | Suggested timeframes: M15, M30, H1, H4, D1* ## Short description > Signed ratio between the net distance travelled by price and the gross path actually covered. It separates straight trends from disorderly advances that burn capital. ### Overview Two markets can rise by the same amoun
# Trend Age Counter - Regime age versus typical duration *Category: Trend | Difficulty: intermediate | Window: separate window below the chart | Markets: Universal (Forex, indices, commodities, crypto, stocks) | Suggested timeframes: M30, H1, H4, D1* ## Short description > Counts how many bars the current regime has lasted and compares it with the average duration of all past regimes on the same instrument. It measures trend maturity, not strength. ### Overview Every trend indicator answer
# Regression Confidence Baseline - Bands on residual error *Category: Trend | Difficulty: intermediate | Window: chart window (overlaid on price) | Markets: Universal (Forex, indices, commodities, crypto, stocks) | Suggested timeframes: M15, M30, H1, H4, D1* ## Short description > Linear regression baseline with bands built on the residual standard error instead of the price standard deviation. Bands widen when the move loses order, not when price runs. ### Overview Classic volatility band
# Trend Exhaustion Meter - Composite exhaustion score *Category: Trend | Difficulty: advanced | Window: separate window below the chart | Markets: Universal (Forex, indices, commodities, crypto, stocks) | Suggested timeframes: M30, H1, H4, D1* ## Short description > A 0 to 100 score combining stretch from the mean, directional saturation and momentum fade. It measures the continuation risk of a move, not its reversal. ### Overview No single symptom says a trend is about to end, but when se
# Normalized Momentum Z - Momentum in standard scores *Category: Momentum | Difficulty: intermediate | Window: separate window below the chart | Markets: Universal (Forex, indices, commodities, crypto, stocks) | Suggested timeframes: M15, M30, H1, H4, D1* ## Short description > Standardises momentum against its own recent historical distribution and returns a z score. A value of +2 marks a thrust stronger than roughly 97 per cent of the instrument recent moves. ### Overview Raw momentum ha
# Momentum Curvature - Acceleration versus velocity *Category: Momentum | Difficulty: intermediate | Window: separate window below the chart | Markets: Universal (Forex, indices, commodities, crypto, stocks) | Suggested timeframes: M15, M30, H1, H4, D1* ## Short description > Measures price acceleration, the second derivative of the smoothed series, and compares it with velocity. It detects loss of thrust before direction changes. ### Overview Anyone who drives knows the brake pedal acts o
# Rate Of Change Spectrum - Which horizon is driving *Category: Momentum | Difficulty: advanced | Window: separate window below the chart | Markets: Universal (Forex, indices, commodities, crypto, stocks) | Suggested timeframes: M30, H1, H4, D1* ## Short description > Standardises the rate of change over six horizons and identifies which one is driving the move. It shows the dominant scale score and its rank. ### Overview Knowing the market is rising tells you little. Knowing whether it ri
# Impulse Strength Gauge - Movement weighted by volume *Category: Momentum | Difficulty: intermediate | Window: separate window below the chart | Markets: Universal (Forex, indices, commodities, crypto, stocks) | Suggested timeframes: M5, M15, M30, H1, H4* ## Short description > Weights every bar by combining body size in ATR units with volume relative to its average, then accumulates the contributions. It separates wide but empty bars from genuinely supported impulses. ### Overview A wide
# Dual Horizon Momentum Delta - Short versus long, time corrected *Category: Momentum | Difficulty: advanced | Window: separate window below the chart | Markets: Universal (Forex, indices, commodities, crypto, stocks) | Suggested timeframes: M15, M30, H1, H4, D1* ## Short description > Compares momentum on two horizons after normalising them by the square root of time, a correction without which the long horizon would always look larger by pure construction. ### Overview Directly comparing
# Impulse Retrace Ratio - Impulse size versus retracement size *Category: Momentum | Difficulty: intermediate | Window: separate window below the chart | Markets: Universal (Forex, indices, commodities, crypto, stocks) | Suggested timeframes: M15, M30, H1, H4, D1* ## Short description > Groups consecutive same sign changes into runs and compares the average size of bullish runs with that of bearish ones. It measures whether impulses are larger, not more numerous. ### Overview A healthy upt
# Momentum Thrust Counter - Counting thrusts beyond threshold *Category: Momentum | Difficulty: beginner | Window: separate window below the chart | Markets: Universal (Forex, indices, commodities, crypto, stocks) | Suggested timeframes: M15, M30, H1, H4, D1* ## Short description > Counts bars moving beyond an ATR multiple and reports the net balance. The total line separates calm from battle, both of which show a balance near zero. ### Overview Most bars on a chart carry no information: t
# Momentum Divergence Scanner - Divergences without repaint *Category: Momentum | Difficulty: intermediate | Window: chart window (overlaid on price) | Markets: Universal (Forex, indices, commodities, crypto, stocks) | Suggested timeframes: M15, M30, H1, H4, D1* ## Short description > Flags price to momentum divergences using confirmed swings only. The arrow appears on confirmation and is never withdrawn, unlike almost every other divergence indicator. ### Overview Almost every divergence
# Elastic Momentum Band - Momentum driven asymmetric channel *Category: Momentum | Difficulty: intermediate | Window: chart window (overlaid on price) | Markets: Universal (Forex, indices, commodities, crypto, stocks) | Suggested timeframes: M15, M30, H1, H4* ## Short description > A channel deforming with momentum: the band favouring the move draws closer to the average, the opposite one moves away. It makes breaks in direction easier and counter breaks more selective. ### Overview A symm
# Momentum Entropy Filter - Order versus randomness in thrusts *Category: Momentum | Difficulty: advanced | Window: separate window below the chart | Markets: Universal (Forex, indices, commodities, crypto, stocks) | Suggested timeframes: M30, H1, H4, D1* ## Short description > Computes the Shannon entropy of the recent momentum distribution and converts it into an order score from 0 to 100. It separates markets with recurring structure from those without regularity. ### Overview Shannon e
# Realized Volatility Cone - Historical volatility percentiles *Category: Volatility | Difficulty: intermediate | Window: separate window below the chart | Markets: Universal (Forex, indices, commodities, crypto, stocks) | Suggested timeframes: M30, H1, H4, D1* ## Short description > Draws realized volatility together with the percentiles of its own historical distribution. It tells whether the current level is high or low for that specific instrument. ### Overview Knowing that realized vo
# Volatility Forecast EWMA - Forecasting the next bar *Category: Volatility | Difficulty: advanced | Window: separate window below the chart | Markets: Universal (Forex, indices, commodities, crypto, stocks) | Suggested timeframes: M15, M30, H1, H4, D1* ## Short description > Estimates next bar volatility with an EWMA model on variance, the same scheme used in portfolio risk management, alongside the volatility actually observed. ### Overview Every volatility indicator looks backwards and
# Volatility Regime Classifier - Classification with hysteresis *Category: Volatility | Difficulty: intermediate | Window: separate window below the chart | Markets: Universal (Forex, indices, commodities, crypto, stocks) | Suggested timeframes: M15, M30, H1, H4, D1* ## Short description > Classifies volatility into four regimes using a hysteresis state machine, eliminating the constant flipping typical of fixed thresholds. The active threshold is drawn. ### Overview Classifying volatility
# Garman Klass Volatility - An estimator using the whole OHLC *Category: Volatility | Difficulty: advanced | Window: separate window below the chart | Markets: Universal (Forex, indices, commodities, crypto, stocks) | Suggested timeframes: M15, M30, H1, H4, D1* ## Short description > A volatility estimator using open, high, low and close instead of closes only. Its ratio to the classic estimate separates intra-bar movement from close-to-close movement. ### Overview The standard deviation o
# Overnight Gap Risk - The risk stops cannot cover *Category: Volatility | Difficulty: intermediate | Window: separate window below the chart | Markets: Stocks | Suggested timeframes: H1, H4, D1* ## Short description > Splits each bar change into gap and intra-bar movement, and reports the share of risk attributable to gaps, the part no stop can protect against. ### Overview The risk of a position held past the close is not the same as that of the same position closed intraday, and the dif
# Volatility Breakout Projection - Levels projected from the open *Category: Volatility | Difficulty: beginner | Window: chart window (overlaid on price) | Markets: Universal (Forex, indices, commodities, crypto, stocks) | Suggested timeframes: M5, M15, M30, H1* ## Short description > Anchors a reference to each session open and projects two pairs of levels computed as fractions of the average daily range. Levels stay fixed for the whole session. ### Overview If an instrument covers on ave
# Compression Expansion Detector - Squeeze and release *Category: Volatility | Difficulty: intermediate | Window: separate window below the chart | Markets: Universal (Forex, indices, commodities, crypto, stocks) | Suggested timeframes: M15, M30, H1, H4, D1* ## Short description > Measures how far short term volatility has narrowed relative to the reference, counts how many bars the compression has lasted and highlights the bars following the release. ### Overview Volatility is not stable:
# Intraday Volatility Seasonality - Hourly volatility profile *Category: Volatility | Difficulty: intermediate | Window: separate window below the chart | Markets: Universal (Forex, indices, commodities, crypto, stocks) | Suggested timeframes: M5, M15, M30, H1* ## Short description > Builds the instrument average hourly volatility profile and compares it with the actual range of the current bar. It separates normally quiet hours from genuine anomalies. ### Overview Intraday volatility is n
# Downside Upside Vol Ratio - Risk asymmetry *Category: Volatility | Difficulty: intermediate | Window: separate window below the chart | Markets: Universal (Forex, indices, commodities, crypto, stocks) | Suggested timeframes: H1, H4, D1* ## Short description > Computes two separate semi-deviations, one on negative returns only and one on positive ones, and reports their proportion. It measures an asymmetry standard deviation conceals. ### Overview Standard deviation treats an upward and a
筛选:
无评论
回复评论