NeuroTrend Cloud
- Indicators
- Version: 1.0
- Activations: 5
Intelligent Trend & Volatility Indicator for MetaTrader 5
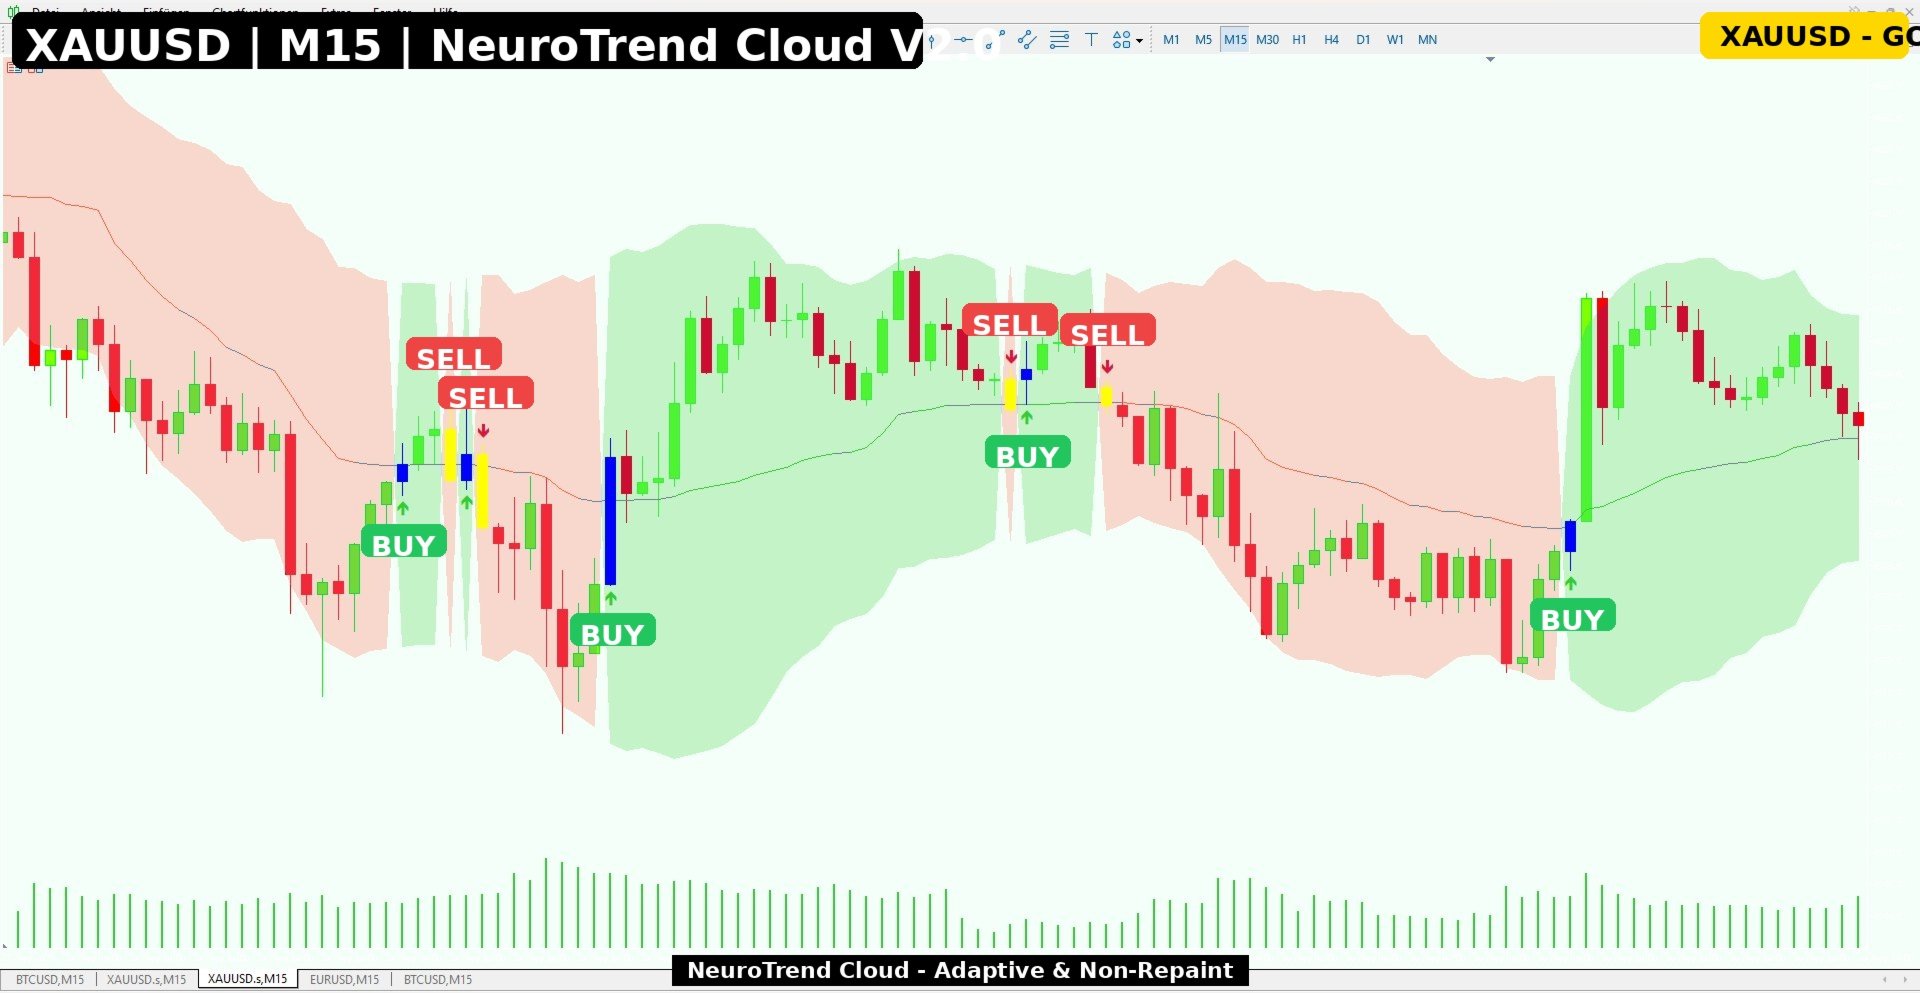
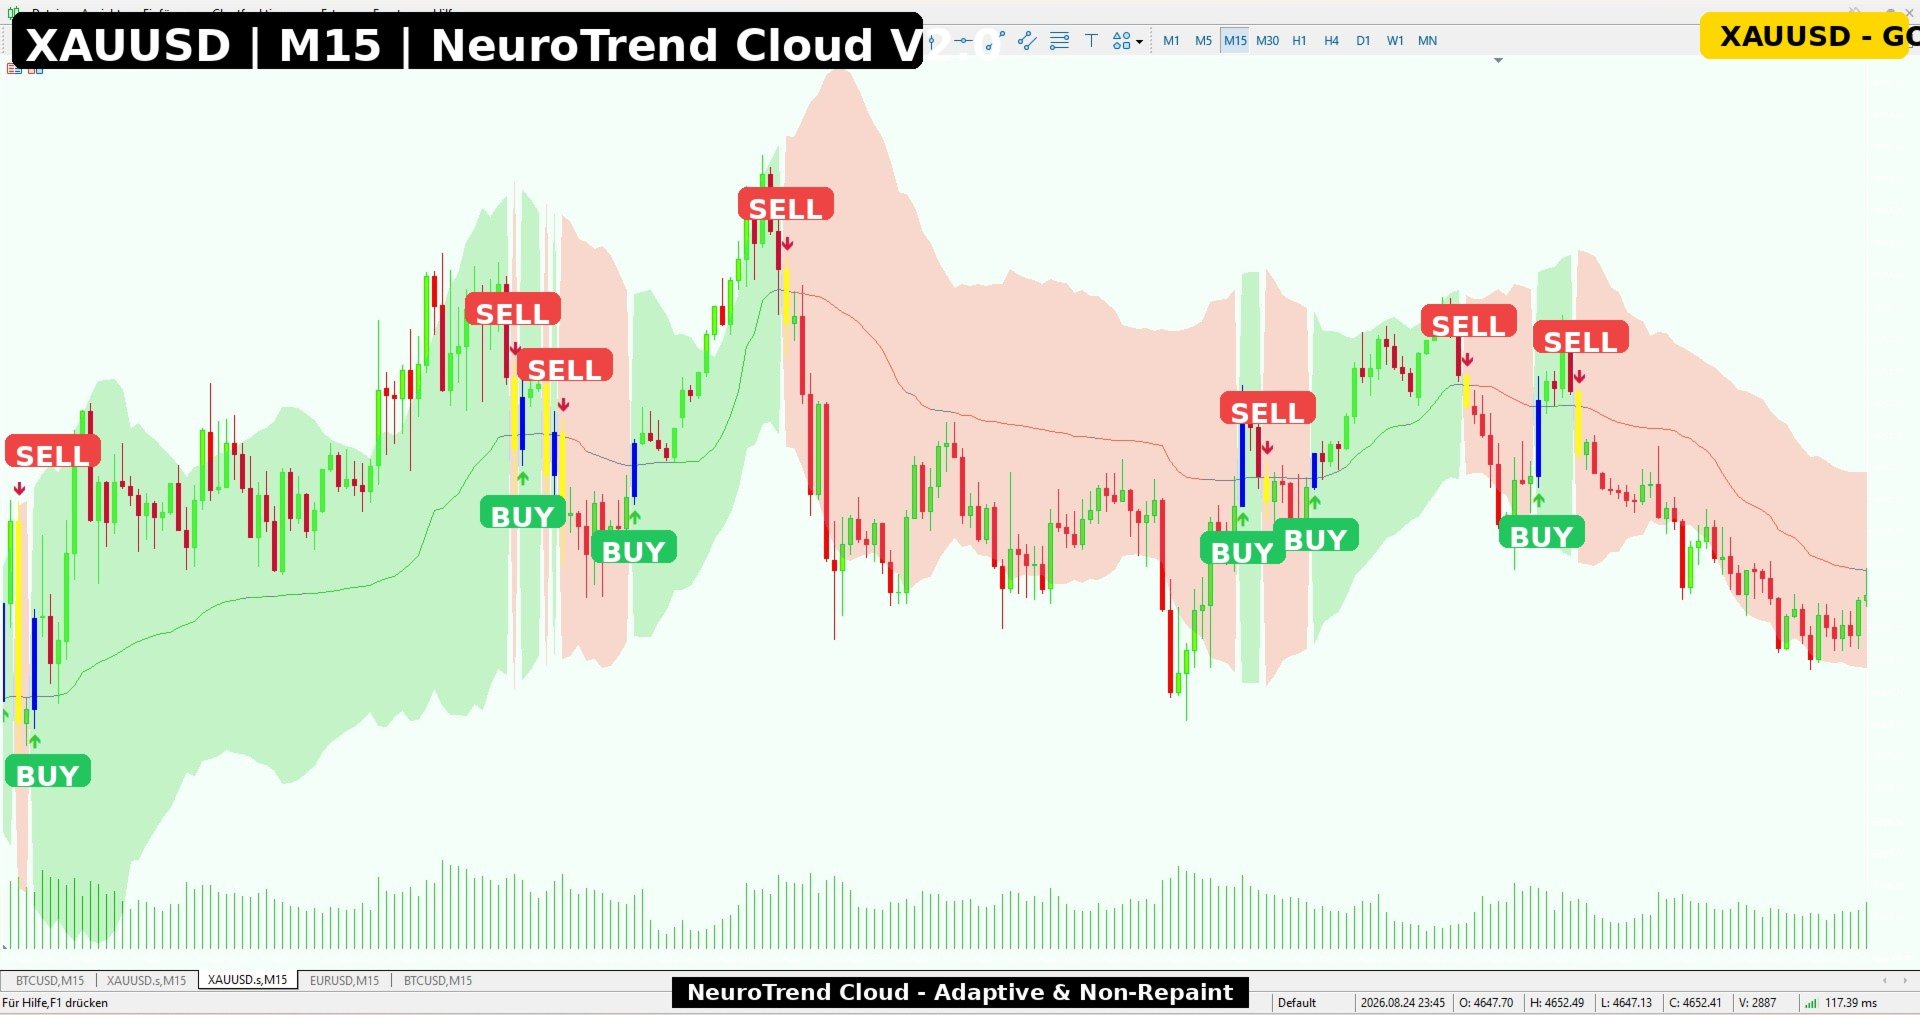
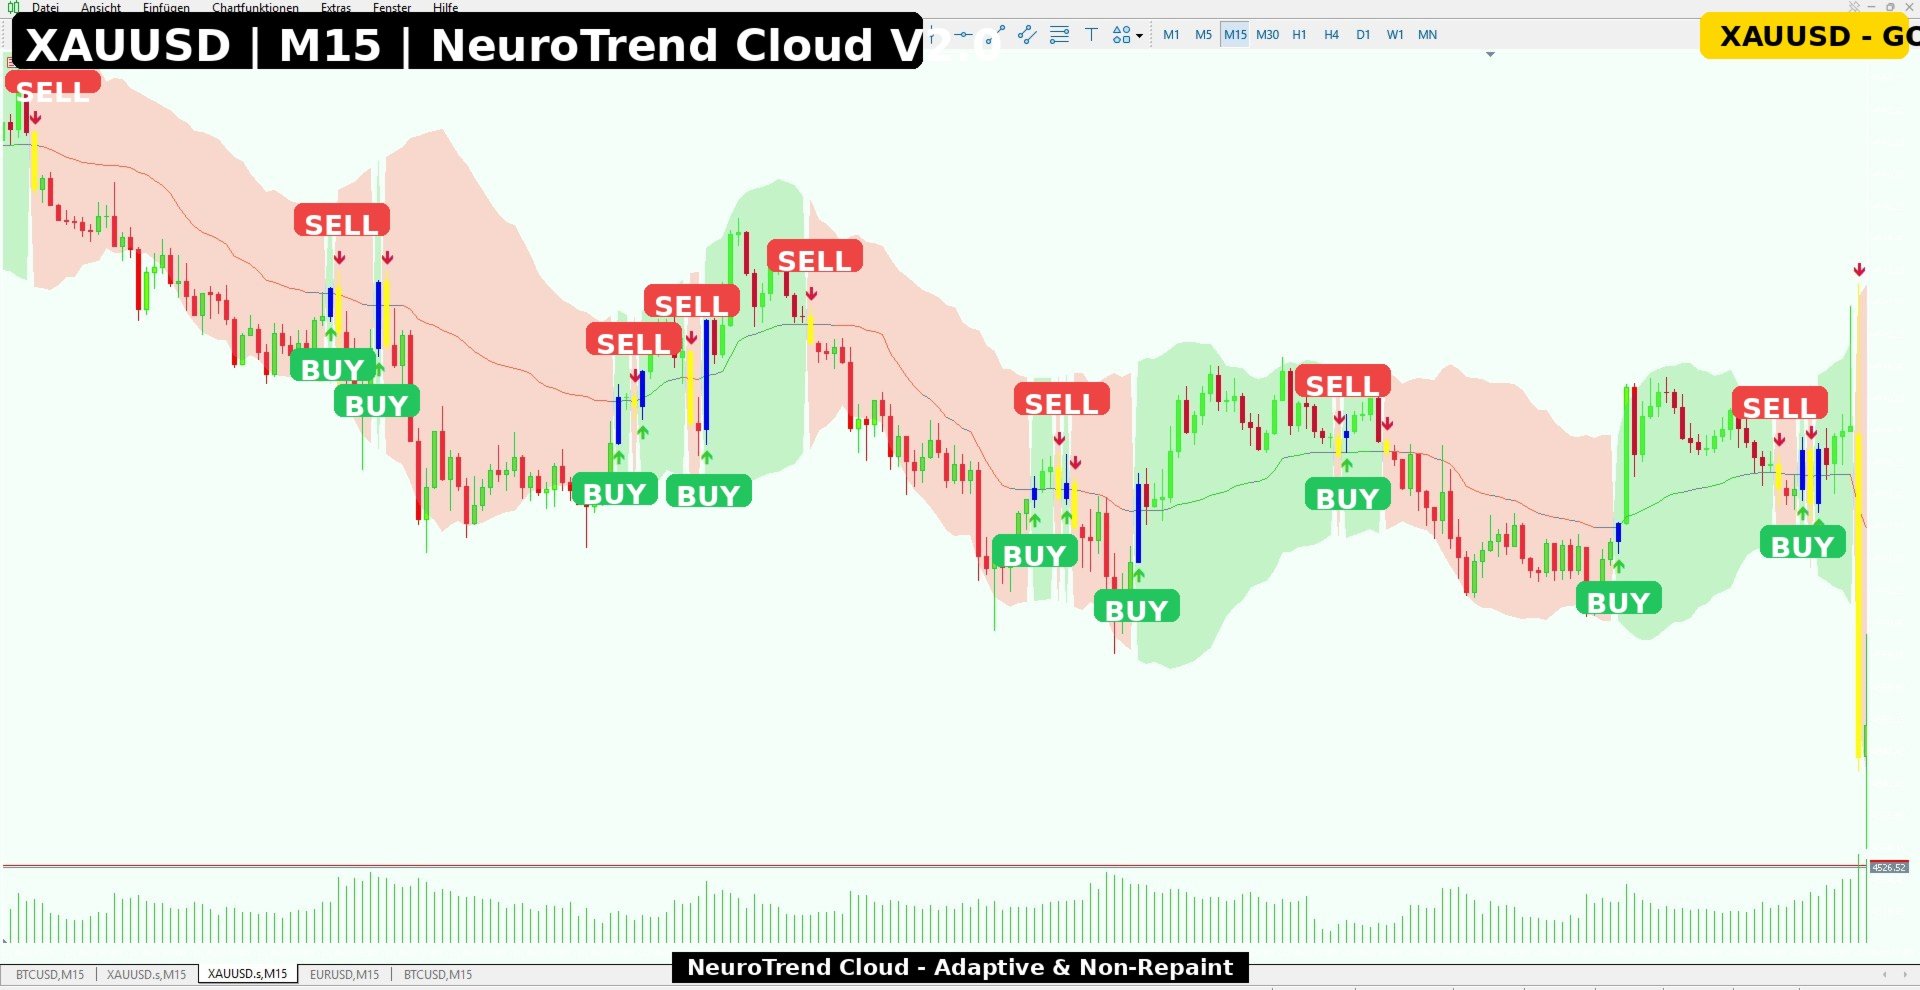
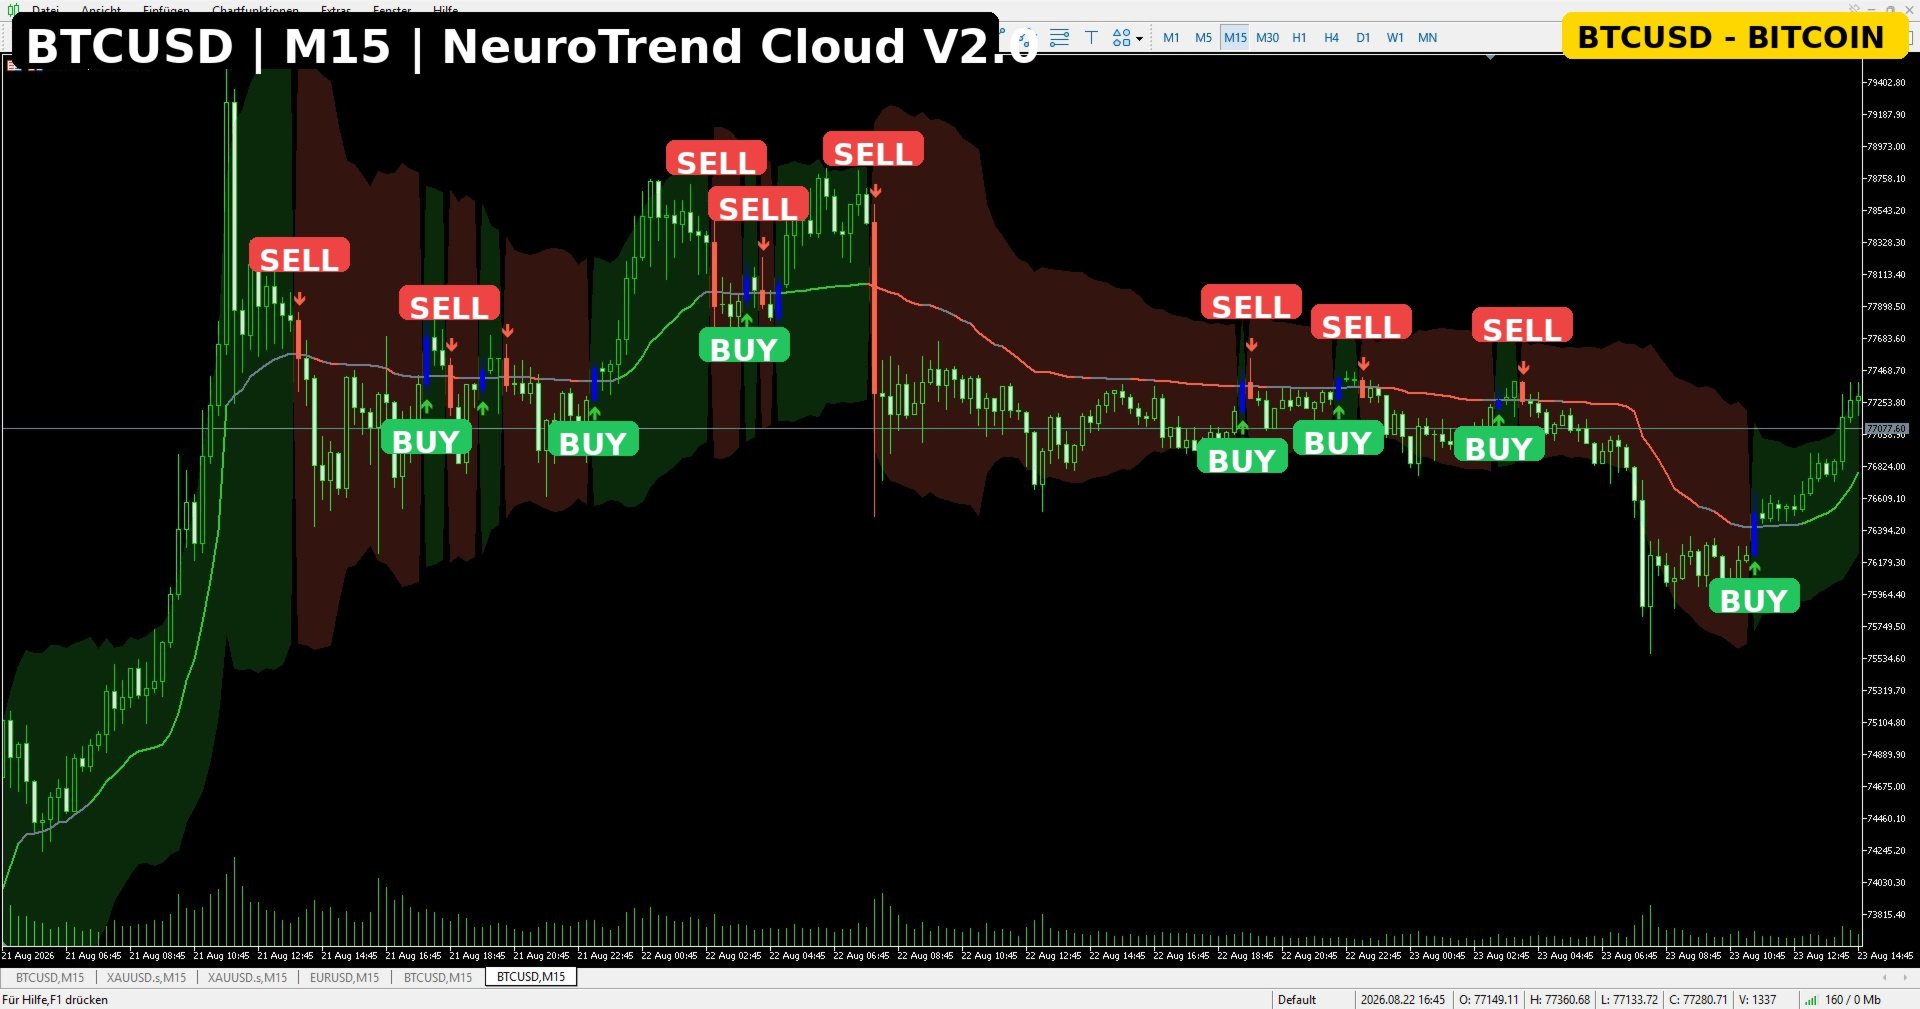
NeuroTrend Cloud is a self-adaptive trend indicator that draws an "intelligent" cloud around a KAMA-based midline. The width of the cloud automatically adjusts to current market volatility (ATR), while clear buy and sell signals are displayed directly on the chart via arrows and a color-highlighted signal candle. No repainting, no complicated setup — just drop it on the chart and read the market structure at a glance.
Thanks to its adaptive calculation, the indicator works on all timeframes (from M1 to MN1) and in all markets — whether Forex, indices, commodities, stocks, or cryptocurrencies. Whether you scalp on low timeframes, trade intraday, or hold long-term positions on daily and weekly charts: NeuroTrend Cloud automatically adapts to the current market situation without any manual reconfiguration.

Why NeuroTrend Cloud?
Most classic moving averages either react too slowly to trend changes or generate too many false signals during sideways phases. NeuroTrend Cloud solves this by automatically adjusting the midline's reaction speed to market efficiency (Kaufman Adaptive Moving Average). In addition, the cloud visualizes current volatility, so you can instantly see whether the market is calm or turbulent.
Key Features
- Adaptive Midline (KAMA): Dynamically adapts to trend strength and market noise — fast in clear trends, slow in sideways phases.
- Volatility Cloud (ATR-based): The width of the cloud automatically expands or contracts depending on current market volatility.
- Clear Visual Signals: Green arrows for bullish signals, red arrows for bearish signals — right at the crossing point of price and midline.
- Signal Candle Highlighting: The triggering candle is automatically colored, so entry points are instantly recognizable.
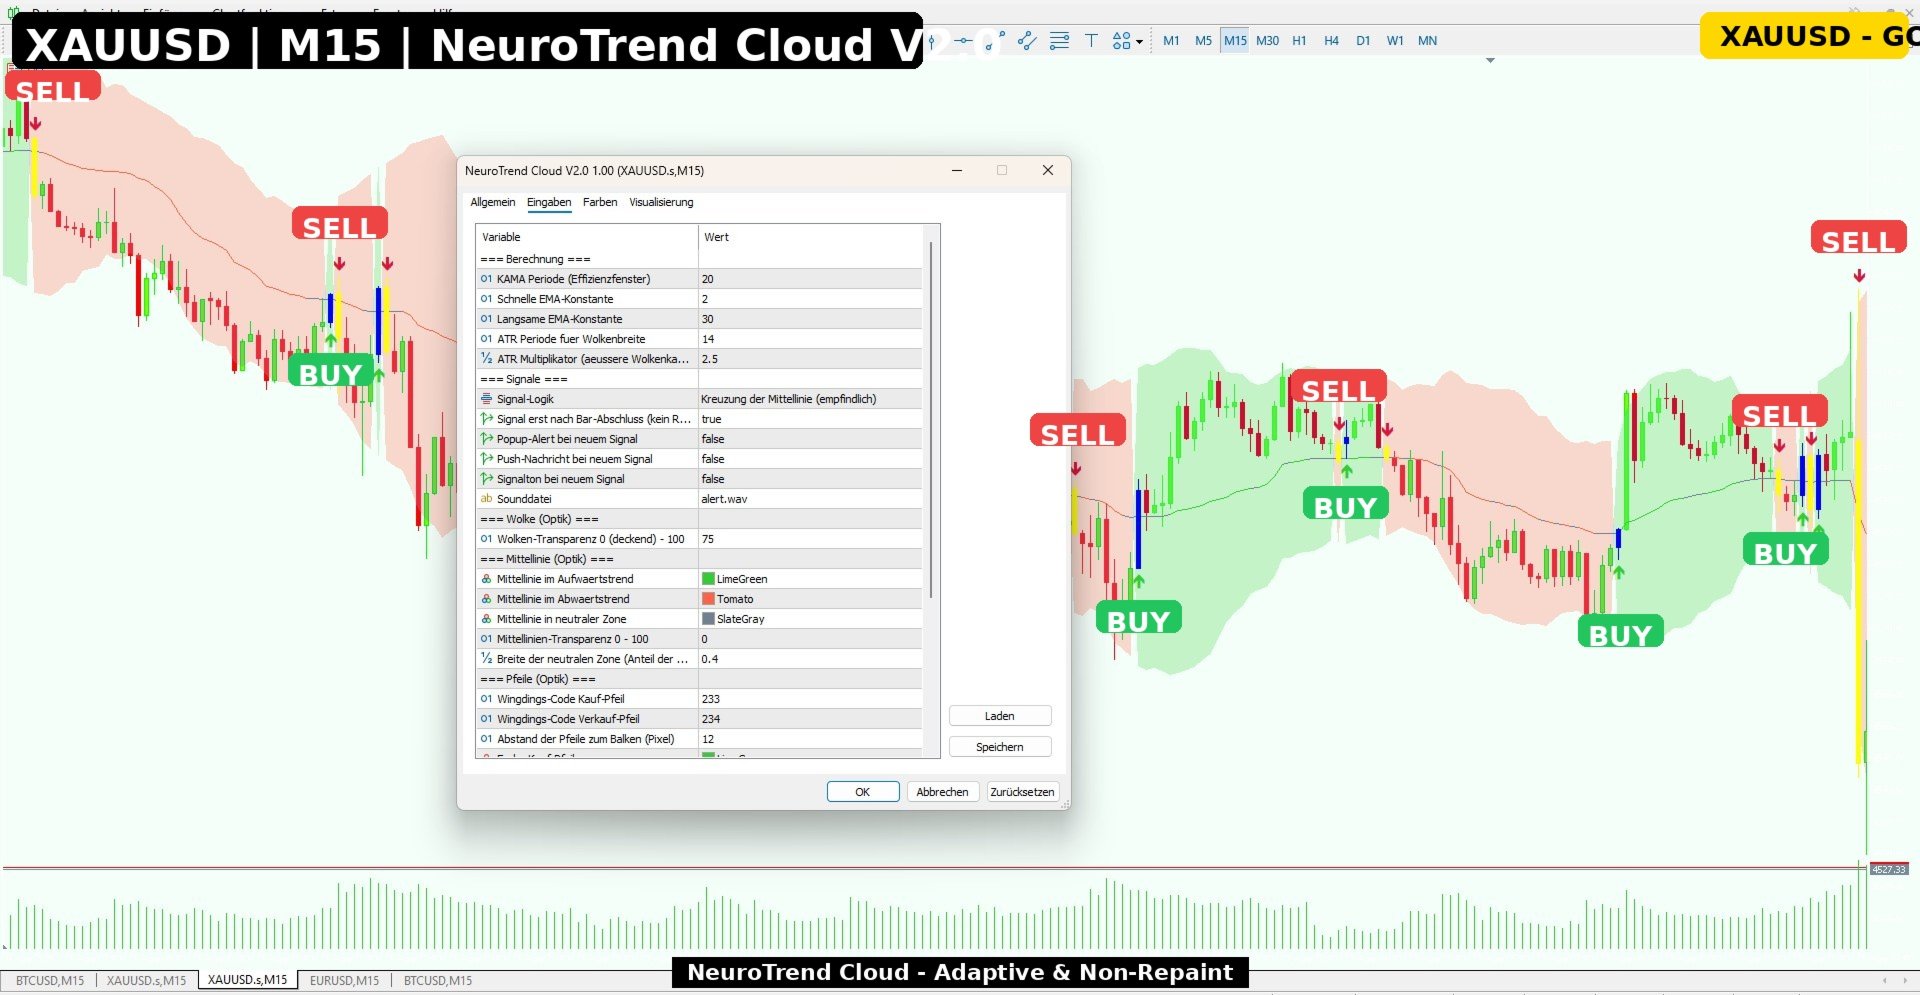
- Fully Customizable: Colors, transparency, periods, and ATR multiplier can all be individually adjusted.
- Optional Popup Alerts: Get notified in real time as soon as a new signal appears.
- Suitable for All Markets and Timeframes: Forex, indices, commodities, cryptocurrencies — works on any chart and any timeframe.
- No Repainting: Once a signal is set, it remains fixed and is never retroactively changed.
How It Works
- The midline is calculated using an adaptive KAMA algorithm that measures the efficiency of recent price movement.
- A cloud is drawn around this line, with its width determined by the ATR (Average True Range) multiplied by an adjustable factor.
- When the closing price crosses the midline from below to above, a buy signal appears (green arrow). When it crosses from above to below, a sell signal appears (red arrow).
- The cloud's color and the highlighted signal candle also give a quick visual overview of the current trend direction.
Adjustable Parameters
| Parameter | Description |
|---|---|
| KAMA Period | Controls the efficiency window of the adaptive midline |
| Fast / Slow EMA Constant | Determines reaction speed during strong vs. weak trends |
| ATR Period | Time window for volatility measurement |
| ATR Multiplier | Controls the width of the cloud |
| Colors & Transparency | Individual customization of cloud, midline, arrows, and signal candles |
| Popup Alerts | Enable/disable notification on new signal |
Timeframe Recommendation
NeuroTrend Cloud works on any timeframe (from M1 to MN1), since the adaptive midline and cloud width automatically adjust to the volatility of the selected chart. Depending on your trading style, the following settings are recommended:
| Timeframe | Suitability | Recommendation |
|---|---|---|
| M1 – M15 | Scalping / short-term trading | Lower the KAMA period (e.g. 5–8) for faster signals |
| M30 – H4 | Intraday / swing trading | Default settings (KAMA period 10) offer a balanced ratio of reaction speed and signal quality |
| D1 – W1 | Position trading / longer-term trends | Increase the KAMA period (e.g. 14–20) for more stable, less frequent signals |
Note: The indicator always calculates its values based on the currently active chart — there is no separate timeframe parameter built into the indicator itself. For multi-timeframe analysis, it is recommended to also observe the indicator on a higher timeframe (e.g. H4 or D1) to confirm the main chart's signals within the context of the broader trend.
Recommended For
- Trend-following strategies
- Entry confirmation in combination with other indicators
- Traders who want a clear visual overview of trend direction and volatility
Note
This indicator is intended for technical analysis and does not replace independent trading decisions. Past signals are no guarantee of future results. It is recommended to test the indicator in the Strategy Tester or on a demo account before live use.
Compatible with MetaTrader 5 (MQL5). Works on all symbols and timeframes (M1 – MN1).