RM Multi Chart Backtester
- Indicators
-
Mohammadreza Mahdi Mavaddat
 MetaTrader 5 tools for Price Action, Market Structure and Divergence traders
I'm Mohammadreza, founder of RM Trading Lab. I'm a trader with about 10 years of market experience and an MQL5 developer, and I build MT5 indicators and utilities that make chart analysis faster, clearer and more reliable. - Version: 2.1
- Updated: 11 November 2026
- Activations: 5
RM Multi-Chart Backtester
Multi-Timeframe Manual Backtesting for MetaTrader 5.
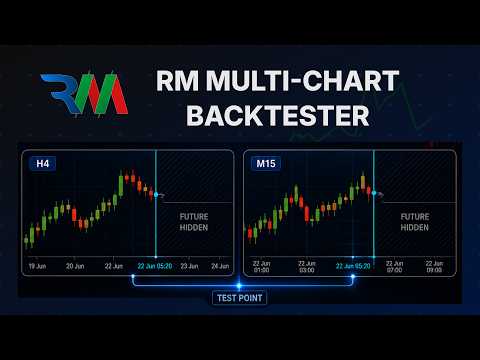
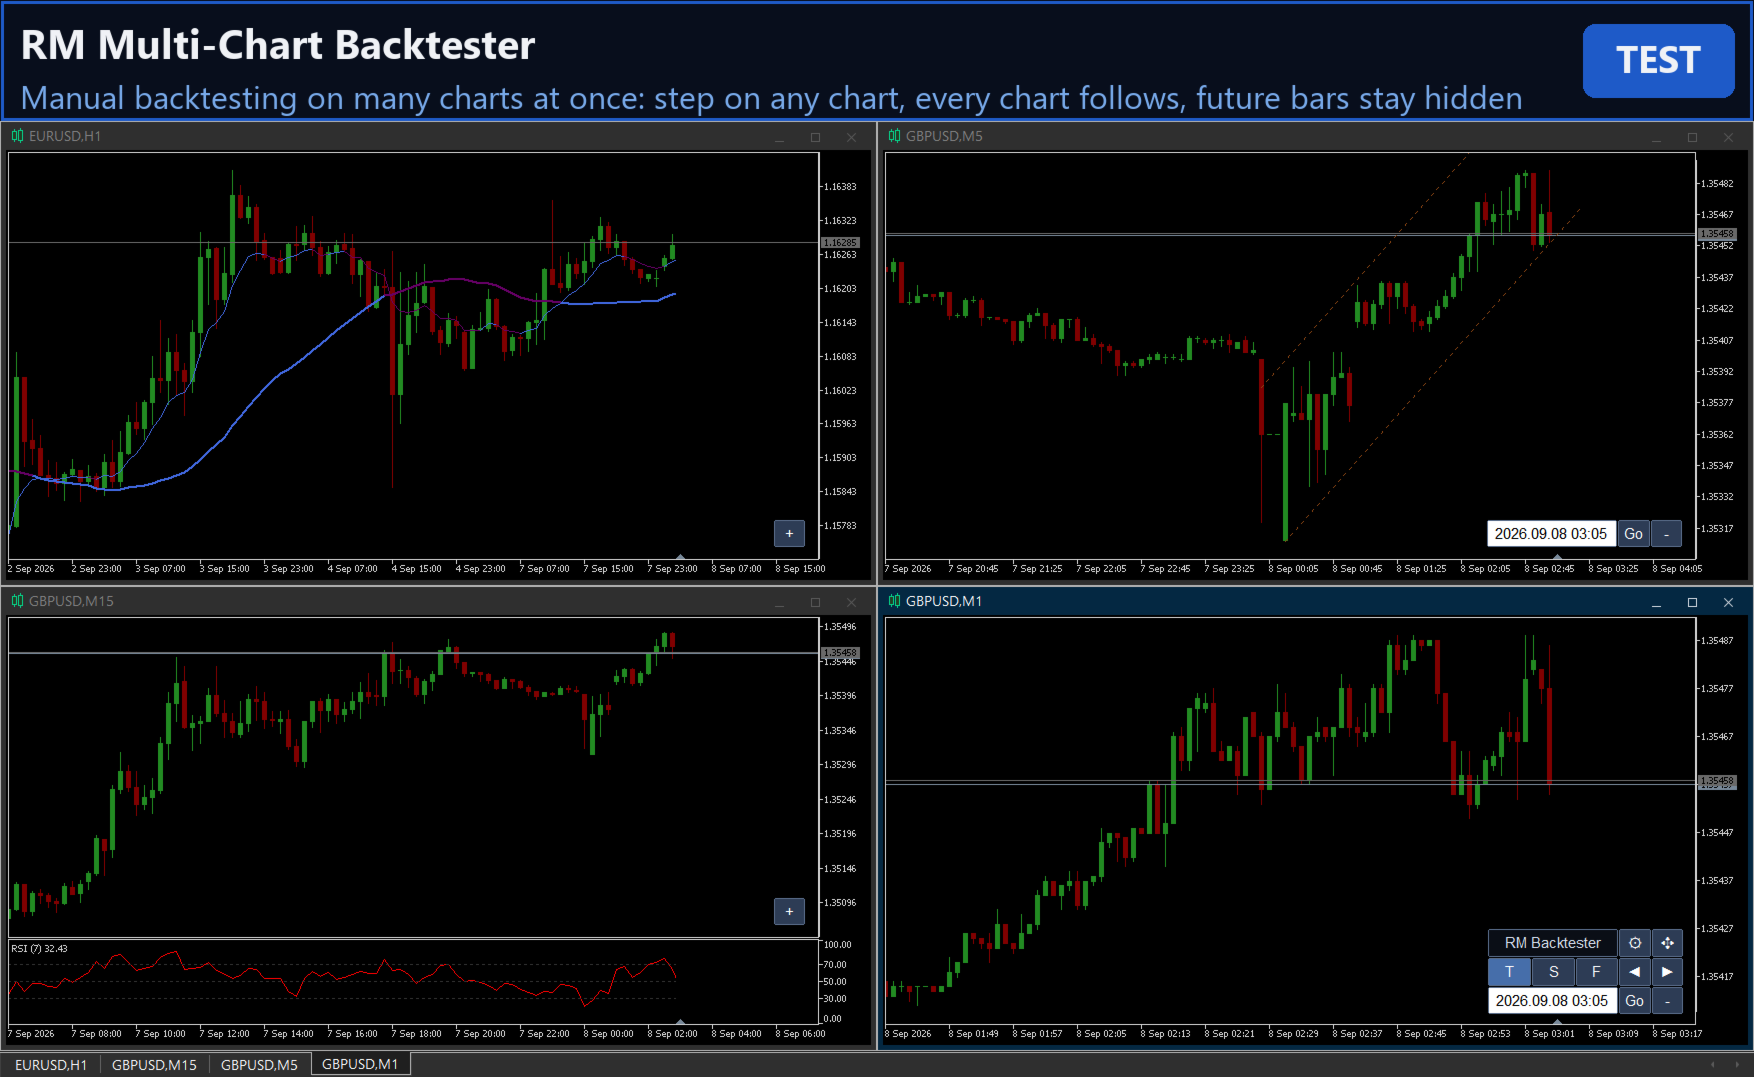
RM Multi-Chart Backtester is a tool for manual backtesting on several MetaTrader 5 charts at once. You step through history bar by bar, every timeframe follows, and the bars after the test time stay hidden.
It turns your normal MetaTrader 5 charts into one synchronized replay. Test price action, smart money or rule-based strategies on many timeframes at the same moment in history, with your own indicators, drawing tools and Expert Advisors.
There is no master chart: the same indicator runs on every chart, with keyboard shortcuts and hidden future bars on every timeframe.
Key Features
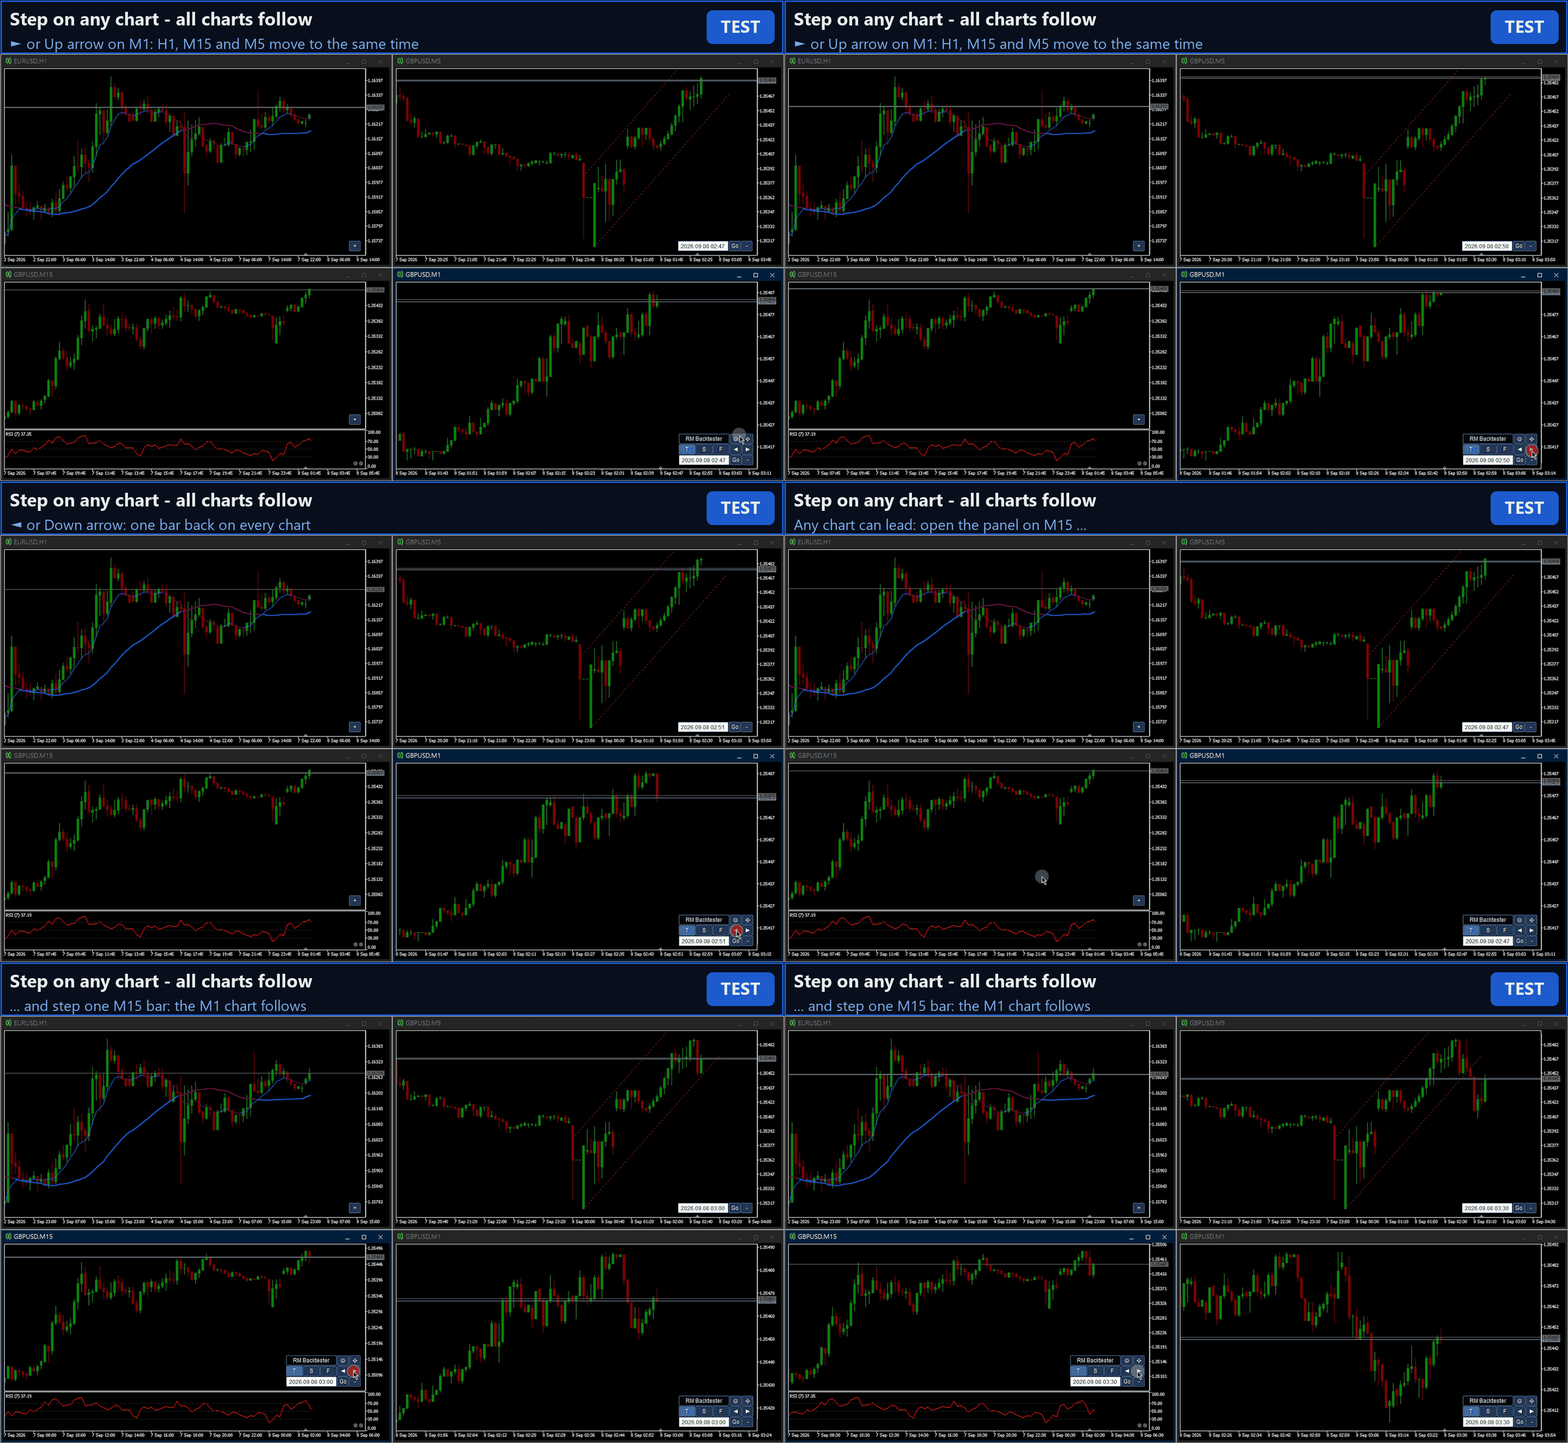
- Multi-Timeframe Synchronization: step bar by bar on any chart, and all other charts (for example D1, H4, M15, M1) move to the same moment in history. Optionally sync only charts of the same symbol.
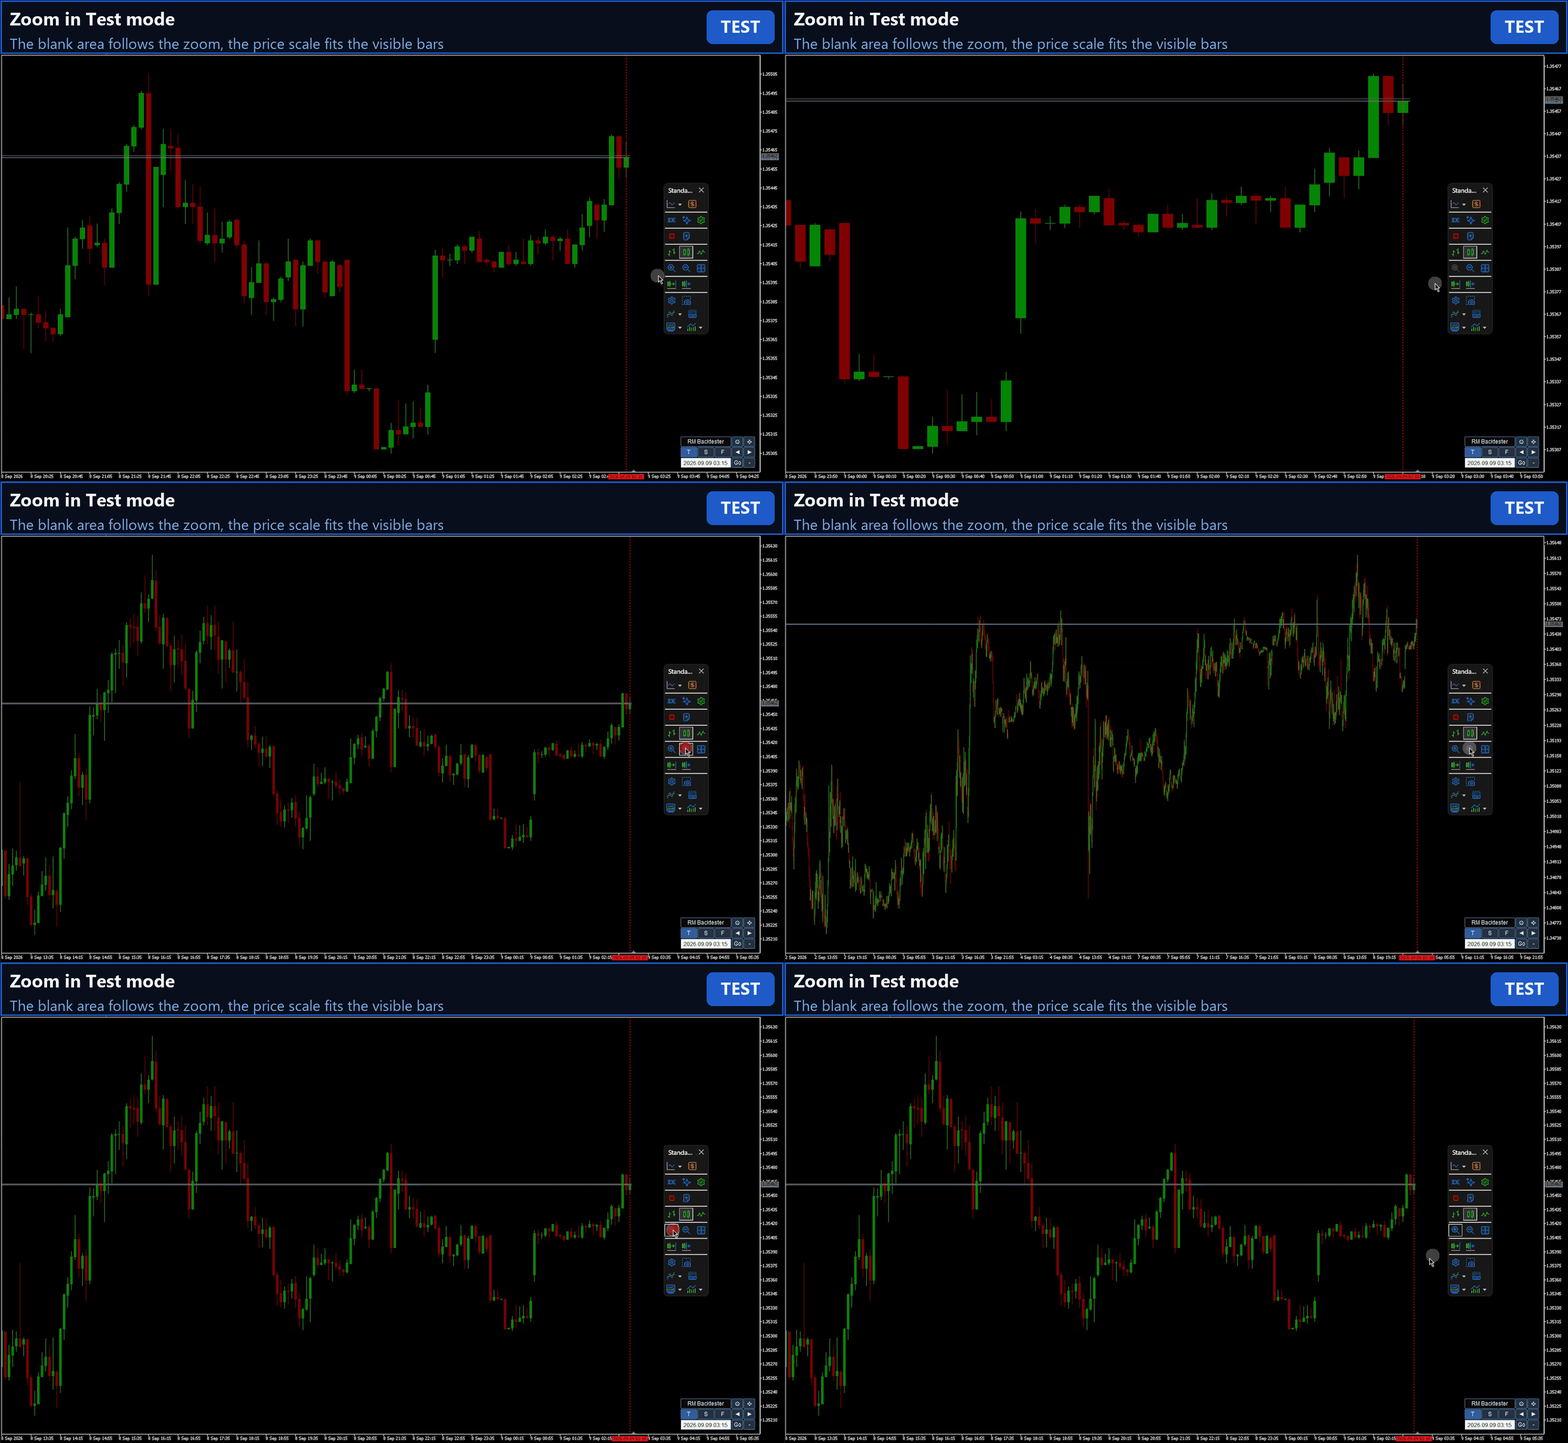
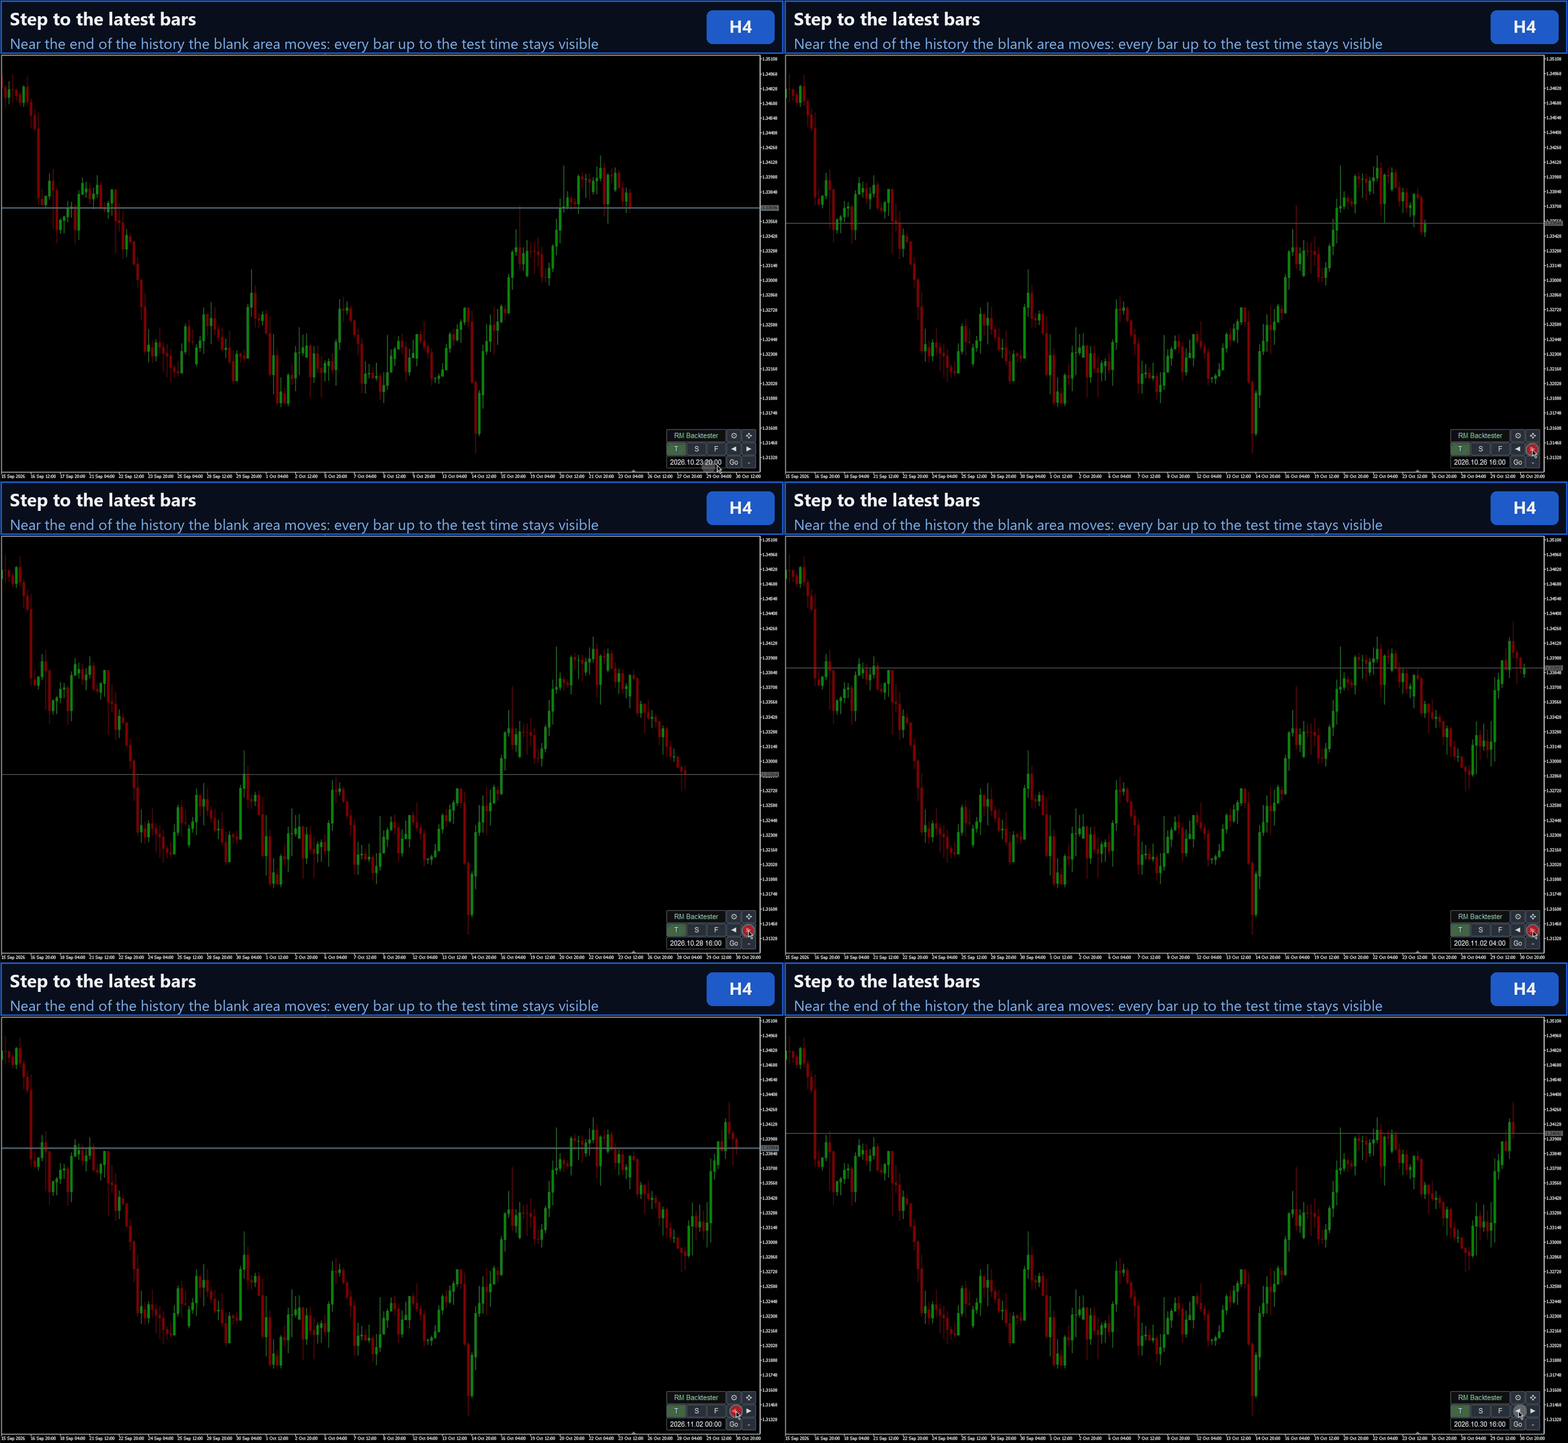
- Hidden Future Bars: a blank area in the chart background color hides every bar after the test time. It follows the chart zoom and the end of the history, and the price scale fits the bars you can see.
- Three Modes — T / S / F:
- Test: backtesting with hidden future bars; mouse and keyboard scrolling are locked.
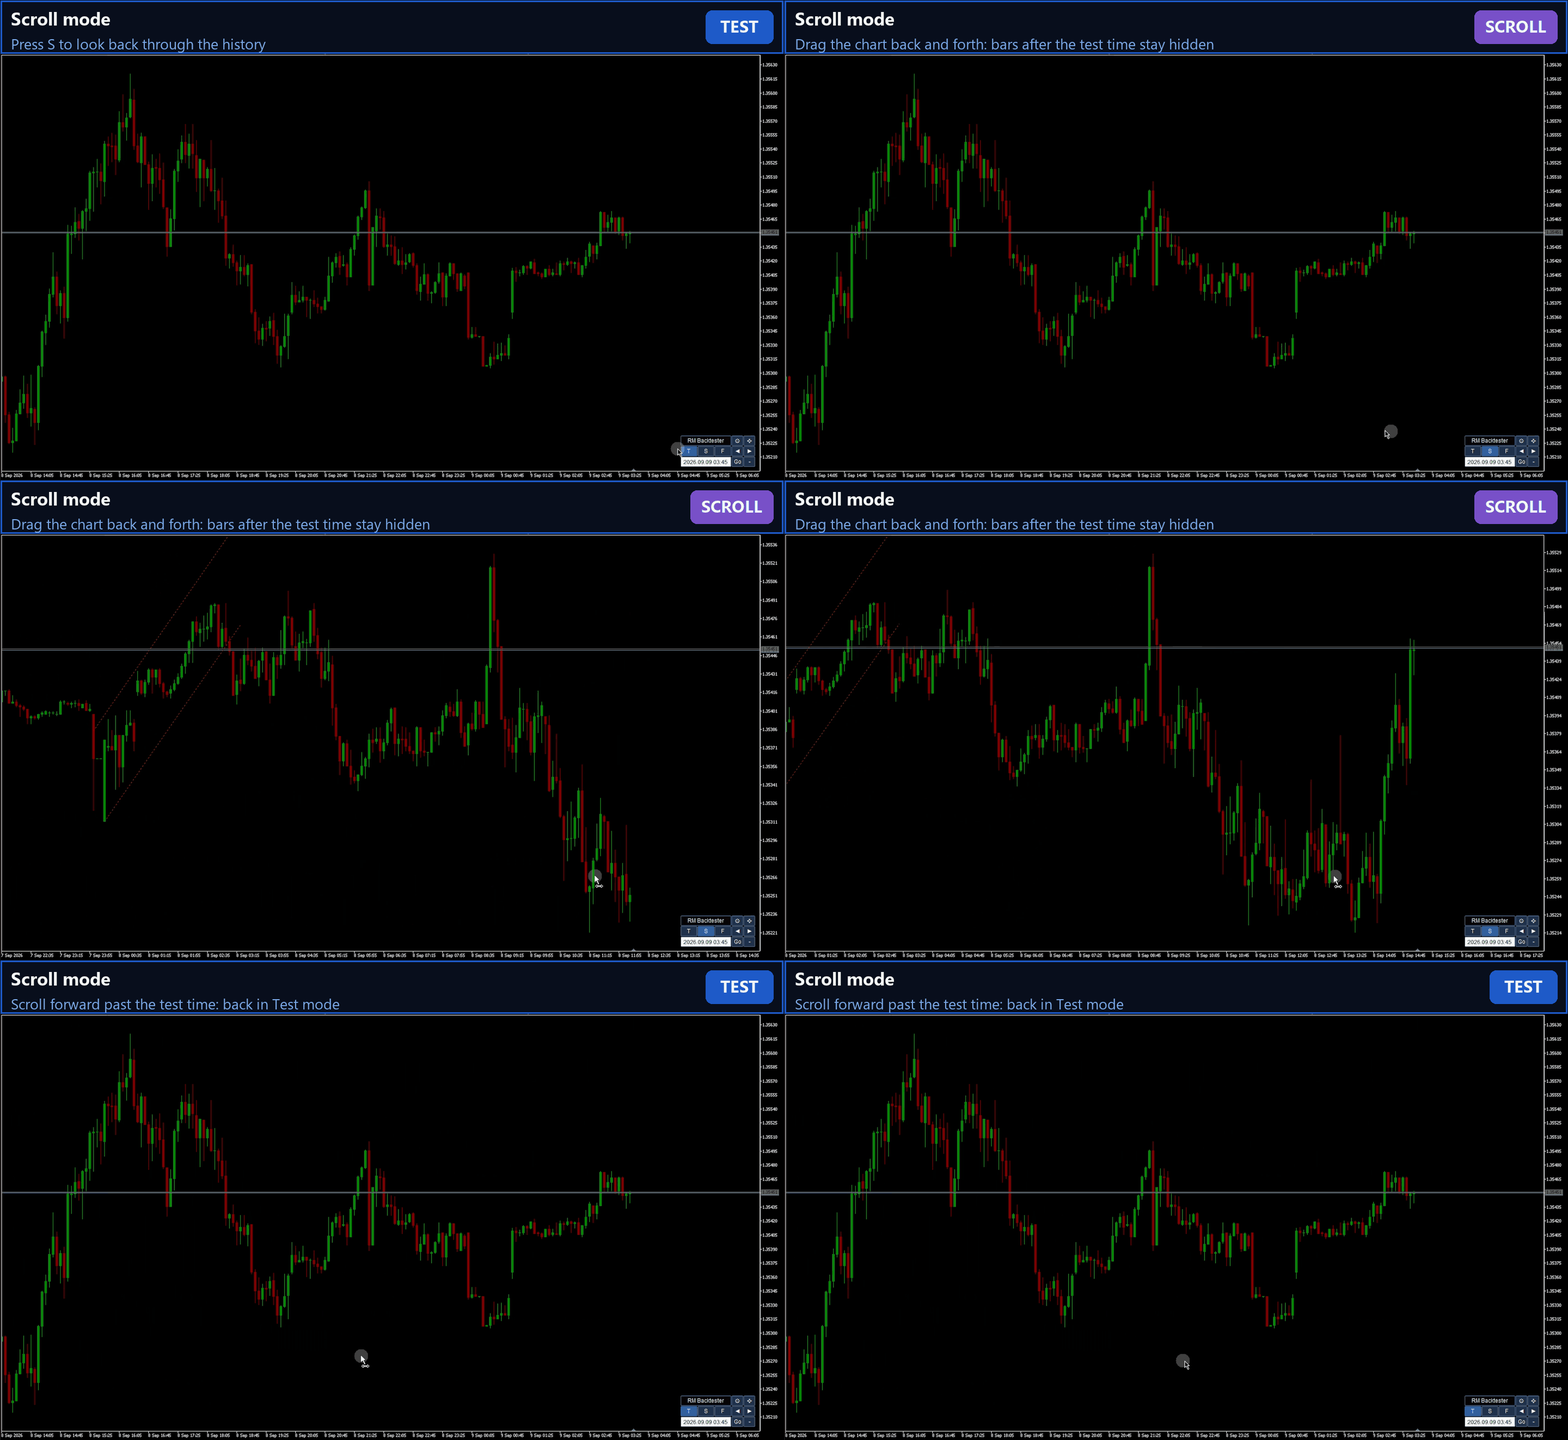
- Scroll: look back through history while future bars stay hidden; scroll past the current bar and you are back in Test mode.
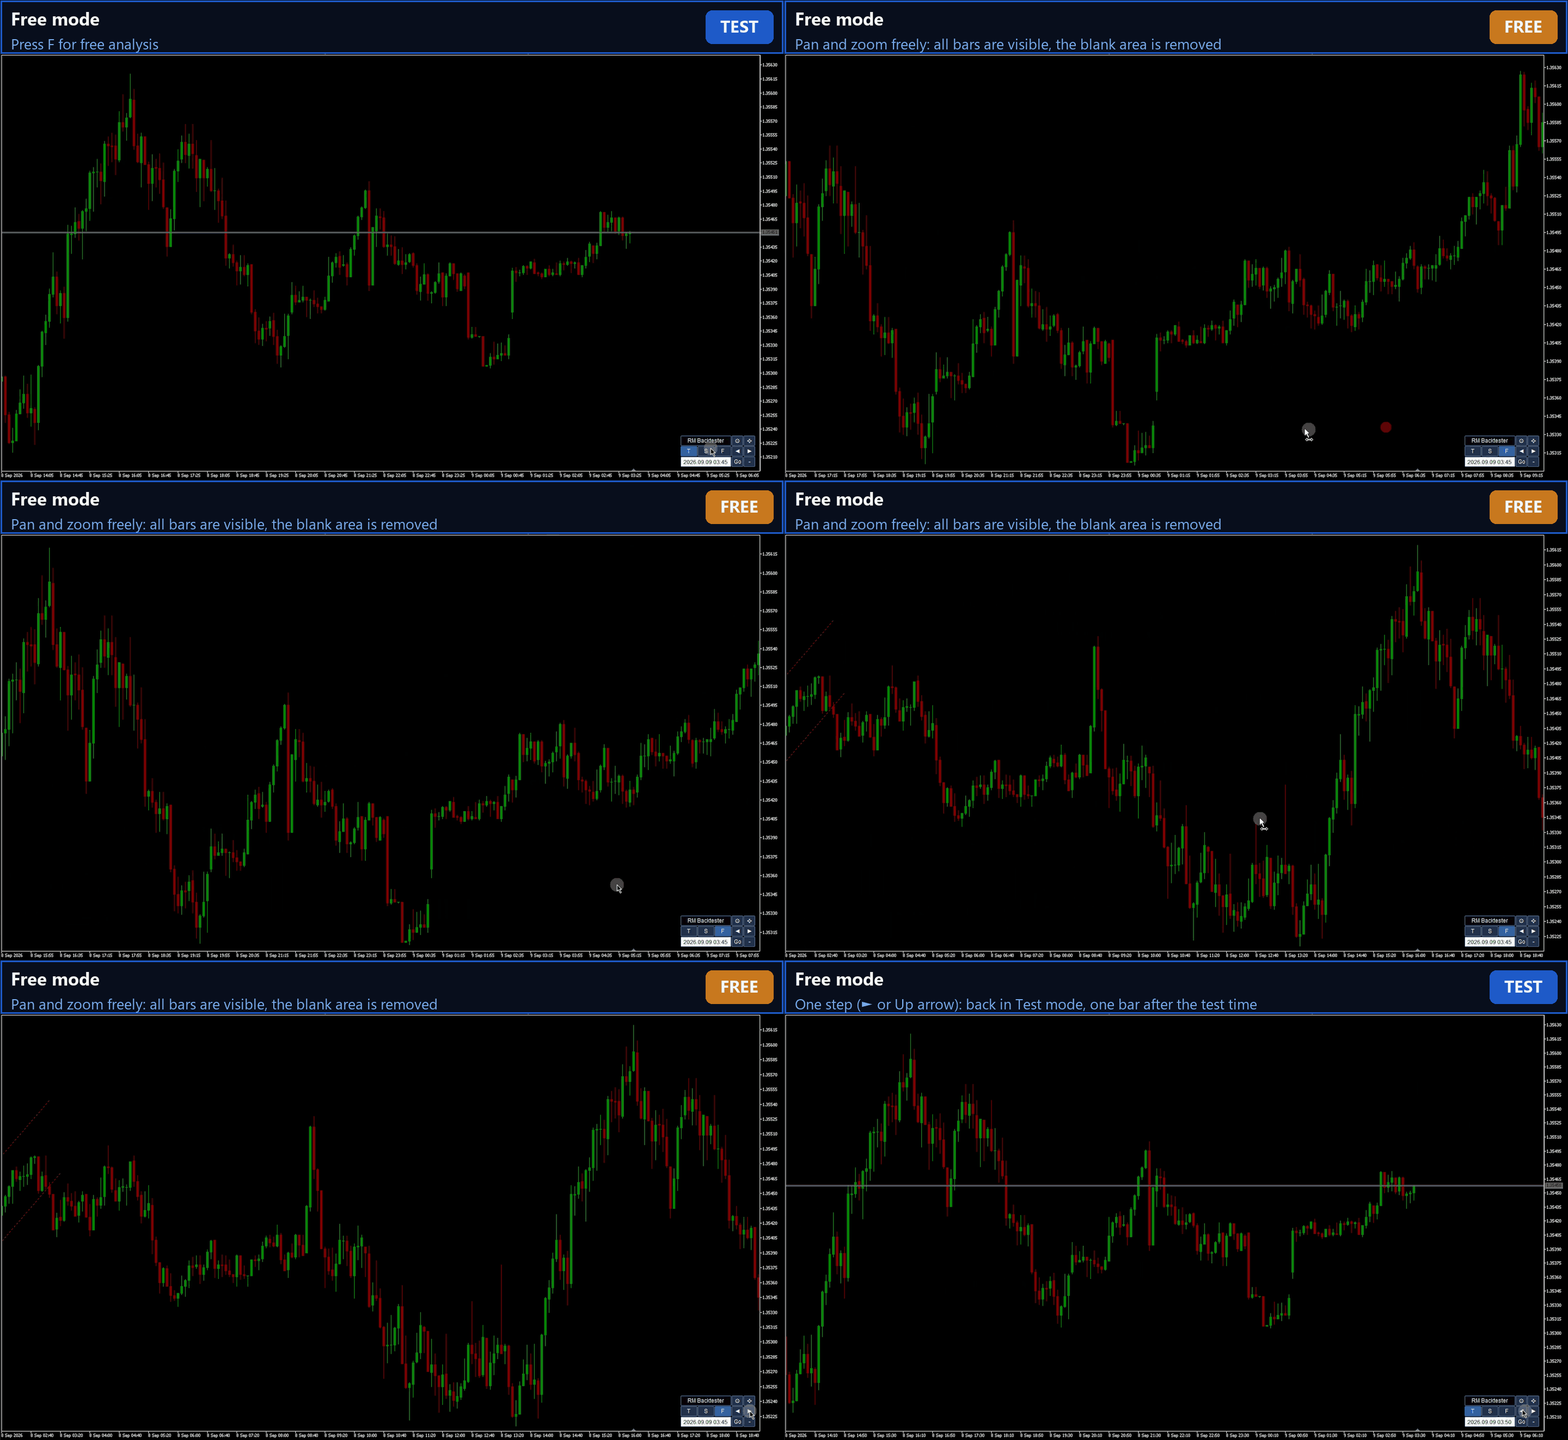
- Free: free navigation for higher-timeframe analysis; the blank area is removed.
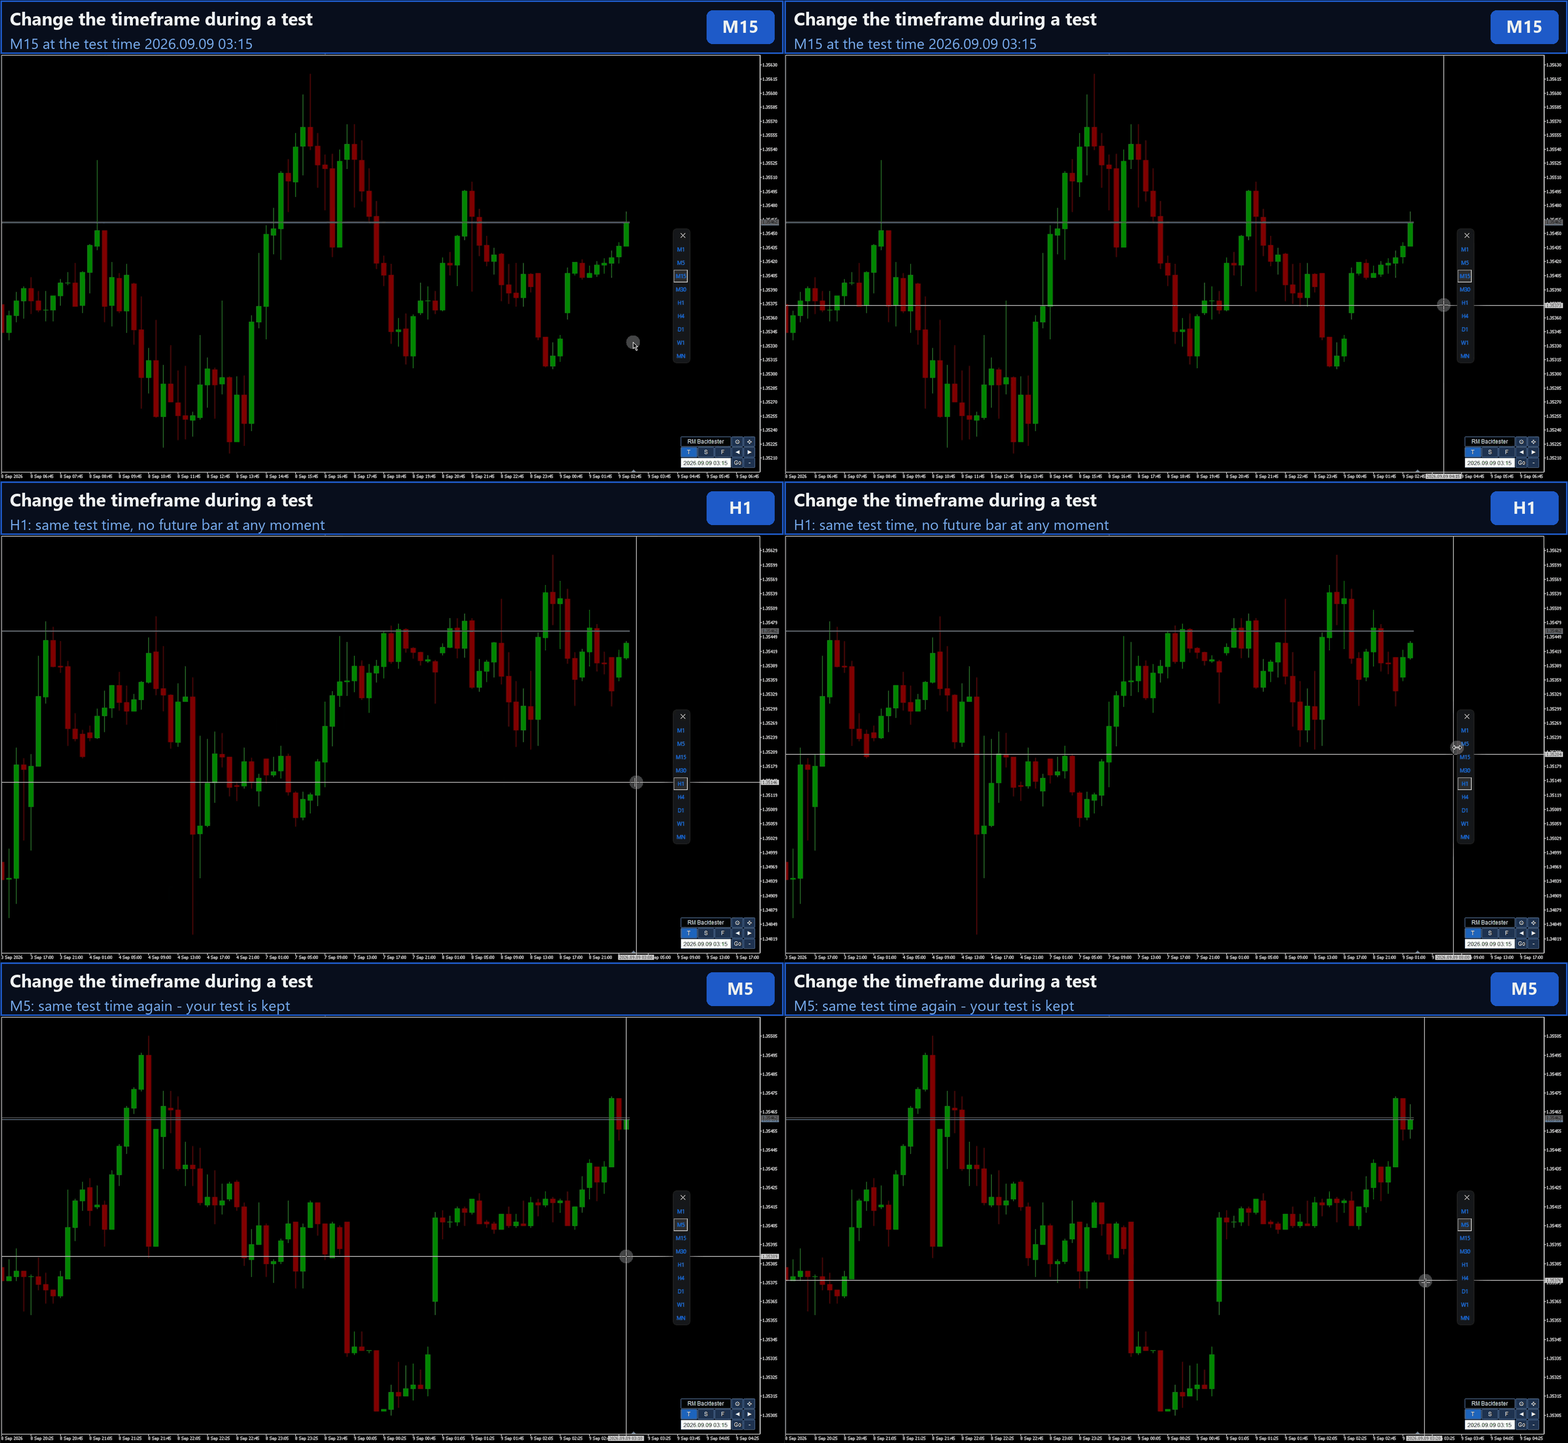
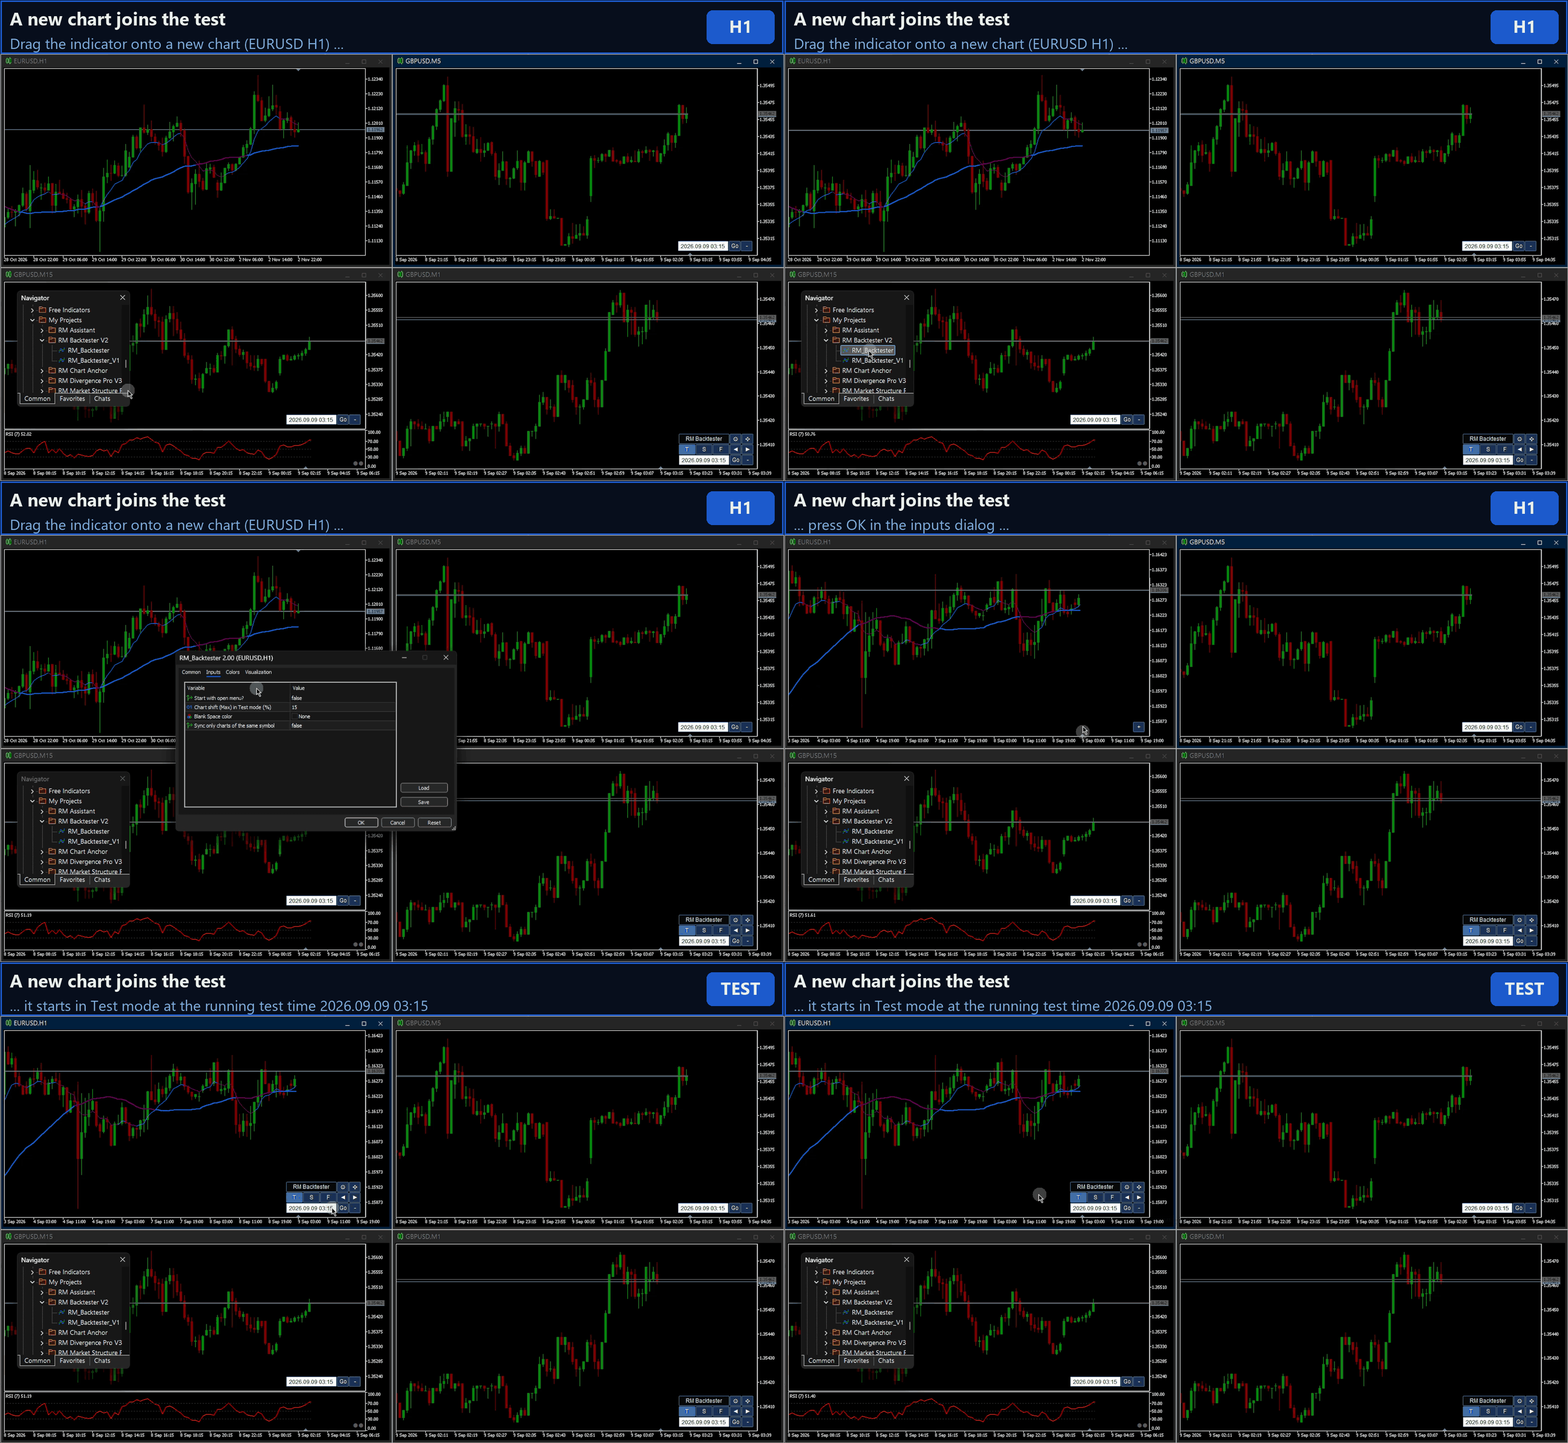
- Your Test Is Kept: change the timeframe, restart MetaTrader or reload a profile — every chart continues at the same time and mode. A chart you open during a test joins it automatically.
- Tester Bid / Ask Lines: show the price of the current test bar, identical on all timeframes.
- Works With Your Tools: use your custom indicators, moving averages, RSI, Fibonacci, drawing tools and trade-management Expert Advisors while you backtest.
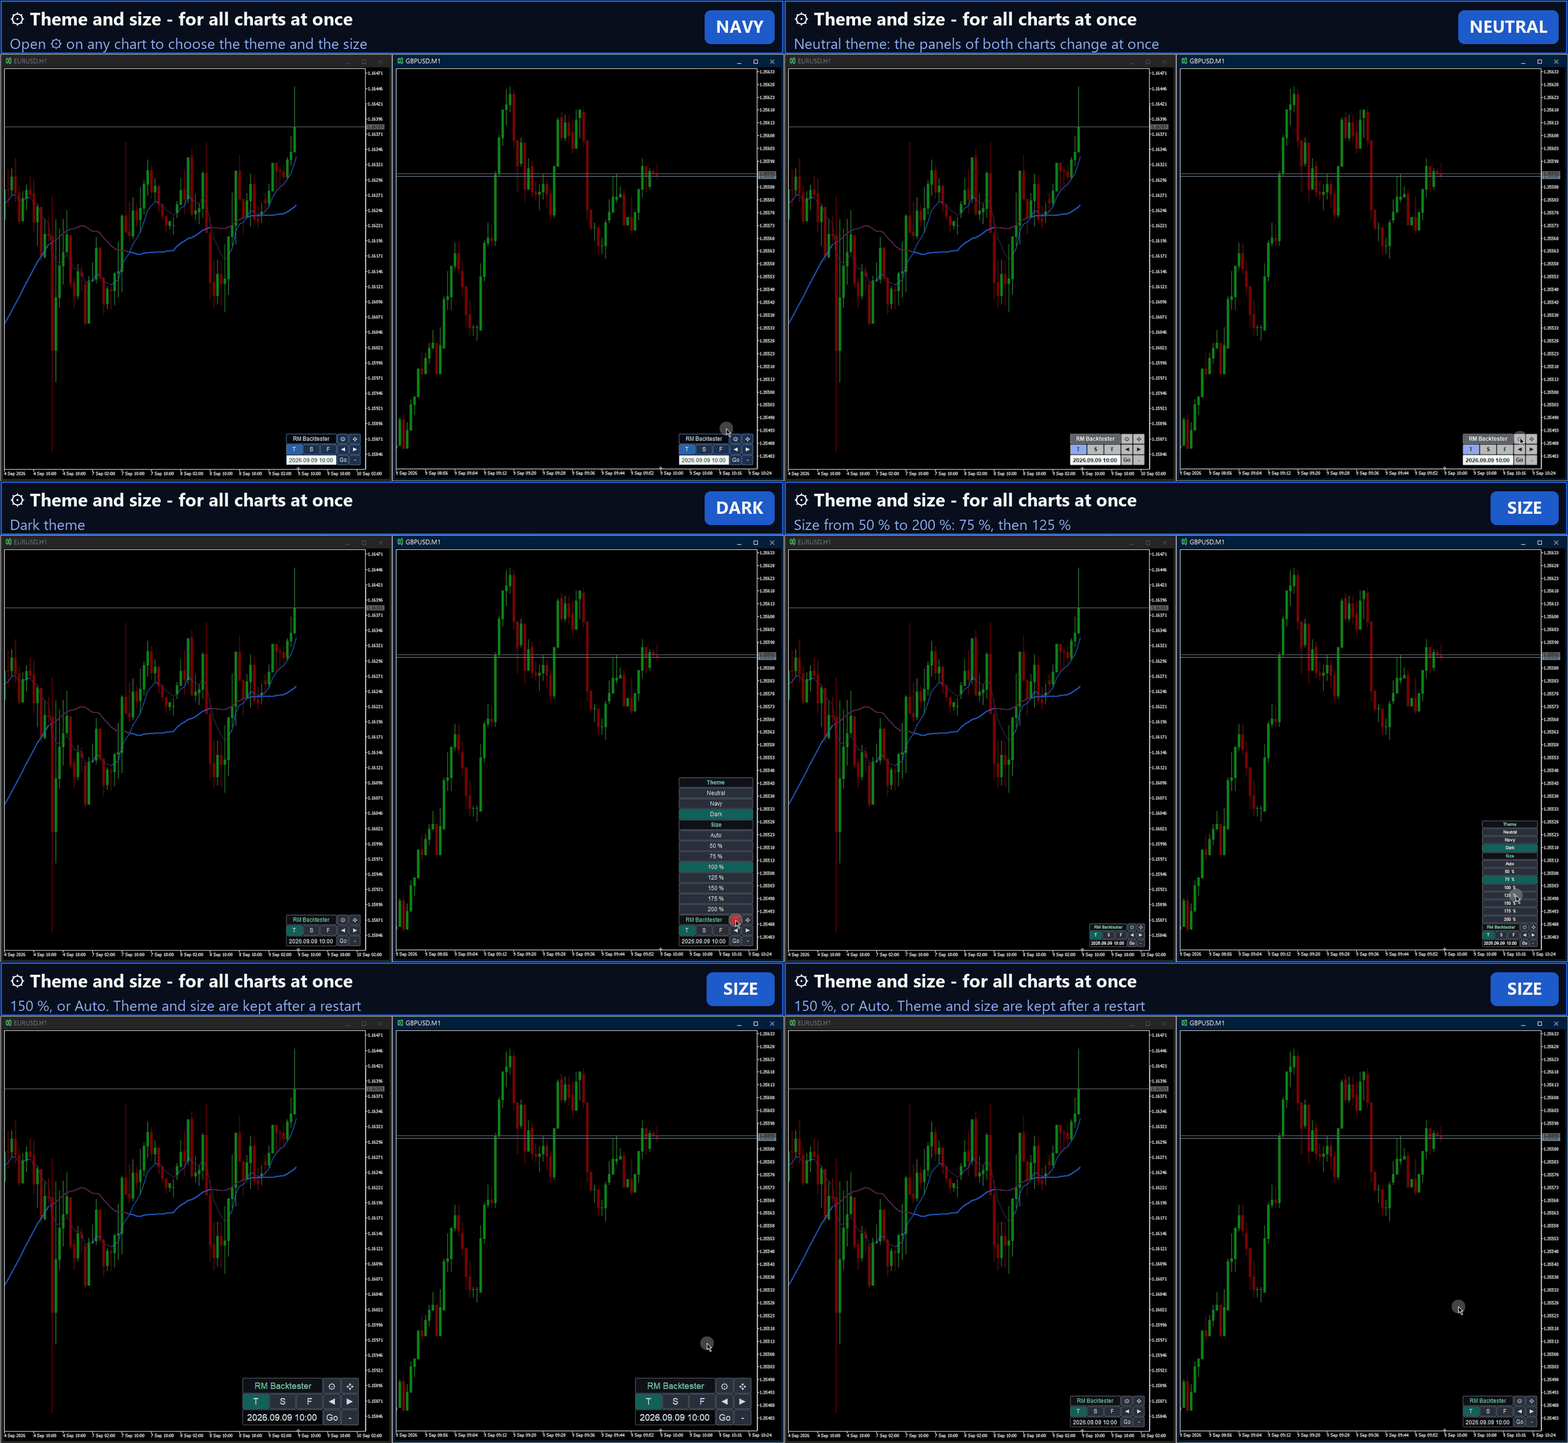
- Control Panel With Themes: three themes (Neutral, Navy, Dark), sizes from 50 % to 200 % or Auto, three panel sizes, and you can place it anywhere on the chart. Theme and size apply to all charts at once.
- Adjustable Right Margin: set where the blank area starts, as a percentage of the chart width.
Note: like any chart-based replay, an indicator that repaints can still use bars after the test time. The price bars themselves stay hidden.
Control Panel
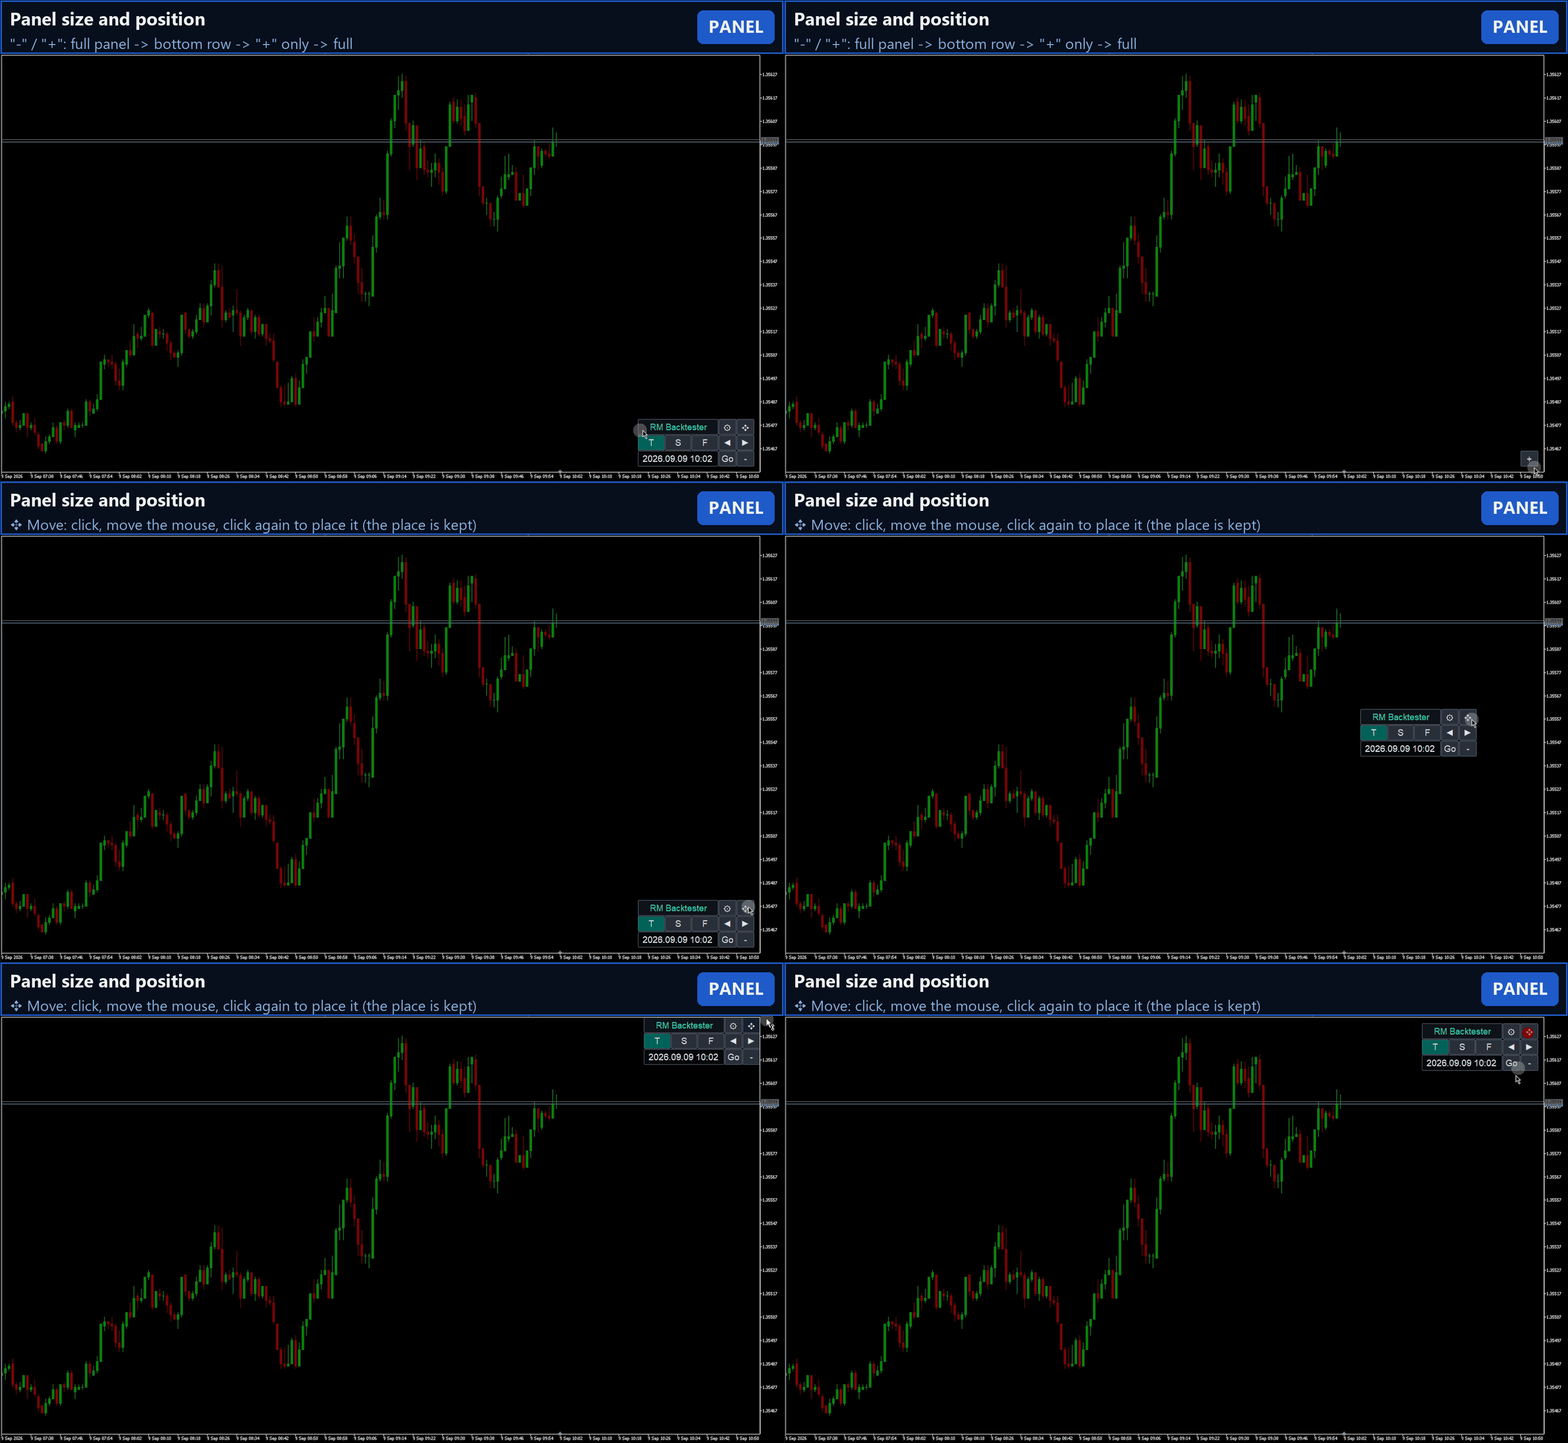
- Row 1 — Caption, Settings button (theme and size), Move button (click, move the mouse, click again to place the panel; the place is kept).
- Row 2 — T / S / F (Test, Scroll, Free; the active mode is highlighted), Back / Forward buttons (1 bar back or forward on all synchronized charts).
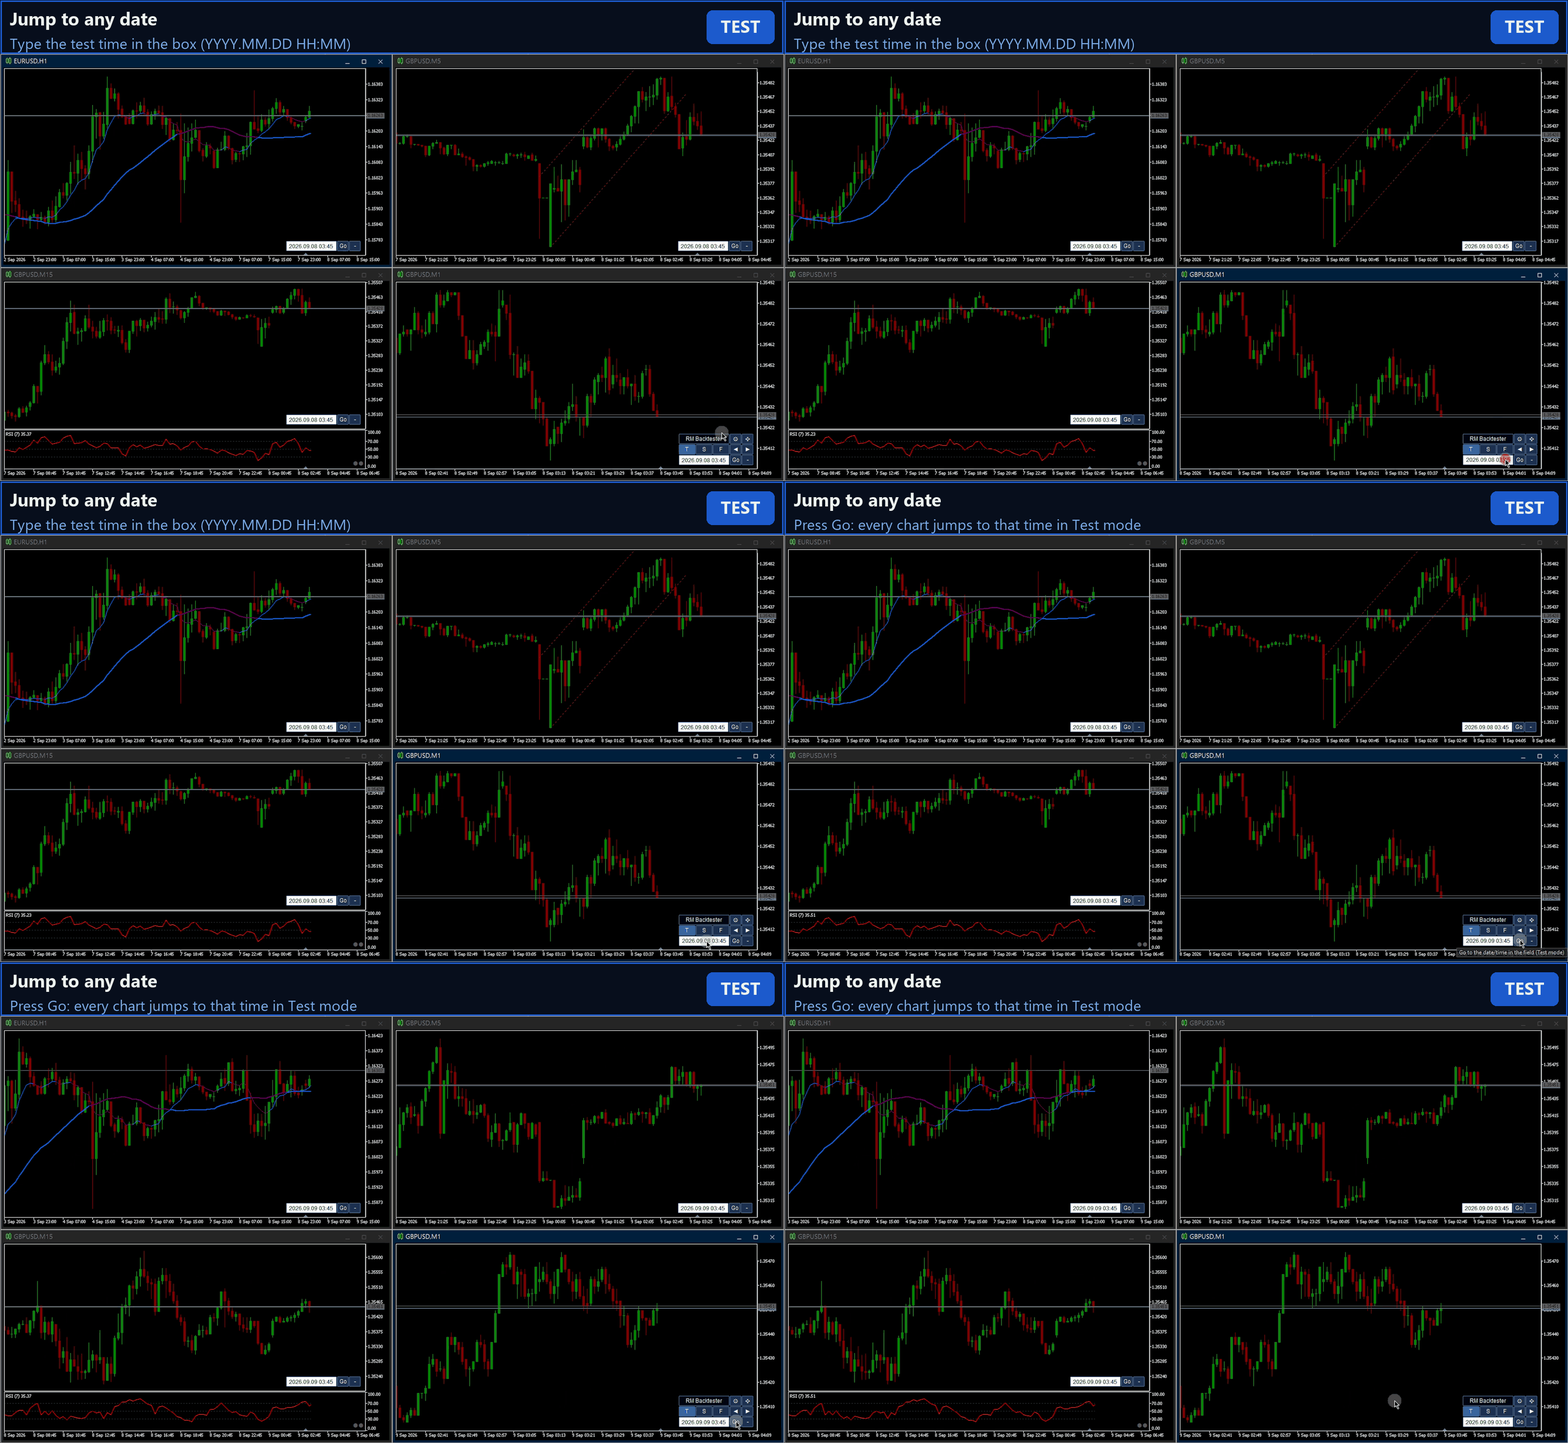
- Row 3 — Time box (YYYY.MM.DD HH:MM, edit it at any time), Go (all charts jump to that time), - / + (panel size: full, then bottom row only, then "+" only, then full again).
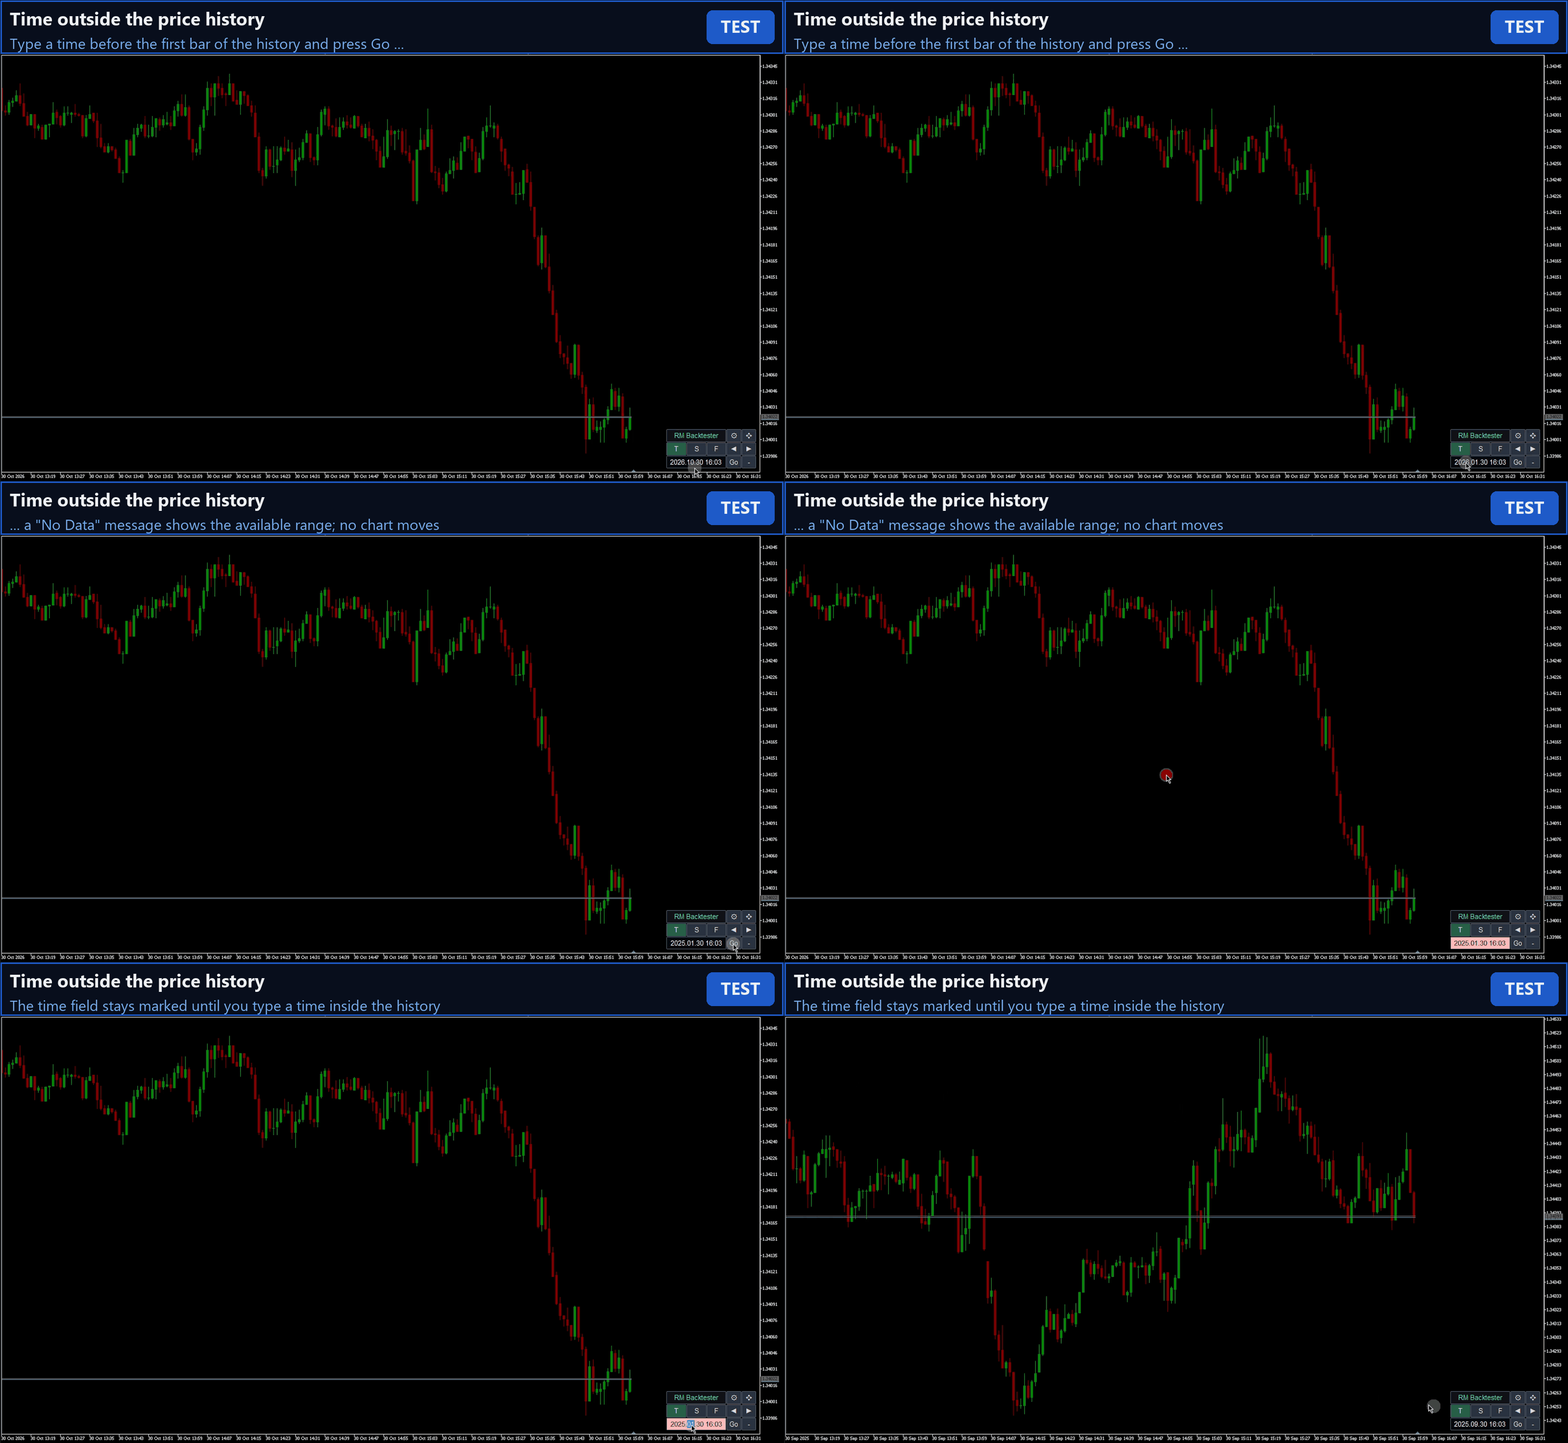
If the time is outside the price history of a chart, a "No Data" message shows the available range.
Keyboard Shortcuts
| Key / Control | Mode | Function |
|---|---|---|
| Up Arrow or "." | All | 1 bar forward on all synchronized charts (from Scroll / Free: back to Test). |
| Down Arrow or "," | All | 1 bar back on all synchronized charts (from Scroll / Free: back to Test). |
| Mouse scroll / Left-Right arrows | Test | Disabled — no accidental look at future candles. |
| Mouse scroll / Left-Right arrows | Scroll | Scroll back through history; future bars stay hidden. |
| Mouse scroll / Arrow keys | Free | Free pan and zoom. |
| Go | All | All charts jump to the time in the box. |
Inputs
- Start with open menu? — panel open or "+" only on a new chart.
- Chart shift (Max) in Test mode (%) — where the blank area starts.
- Blank Space color — clrNONE uses the chart background color.
- Sync only charts of the same symbol — new in 2.0.
Quick Start
- Add the indicator to every chart you want to use (for example H4, H1, M15 and M5).
- Type a date and time in the time box and press Go — all charts jump there in Test mode.
- Step with the Forward / Back buttons or the Up / Down arrow keys, and mark up the charts as usual.
- Press S to look back, F for free analysis, T or a step to continue the test.
Product License
Includes 5 activations per purchase (the standard MQL5 activation limit).