RM Multi Chart Backtester
- Indicadores
-
Mohammadreza Mahdi Mavaddat
 I am a trader, market analyst, and software developer focused on building practical tools for technical analysis and price action trading.
 - Versão: 1.0
- Ativações: 5
RM Multi-Chart Backtester
The Ultimate Multi-Timeframe Manual Backtesting & Trading Simulator for MT5.
Are you tired of the strict limitations of MT5's default Strategy Tester? Want to perform true multi-timeframe manual backtesting while looking at multiple charts simultaneously without accidentally spoiling future price action?
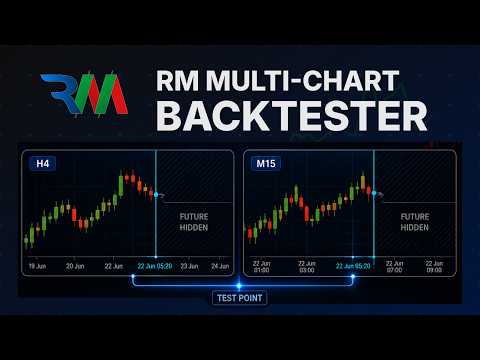
RM Multi-Chart Backtester transforms your standard MetaTrader 5 charts into a powerful, interactive, and completely synchronized manual trading simulator. Test your ICT, SMC, Price Action, or mechanical strategies across multiple timeframes with 100% realistic market execution feel!
Unlike other replay tools that leak future indicator data or rely on complex Master/Slave setups, RM Multi Chart Backtester offers a seamless, single-indicator solution with full hotkey support and zero-bias future masking.
Key Features & Highlights
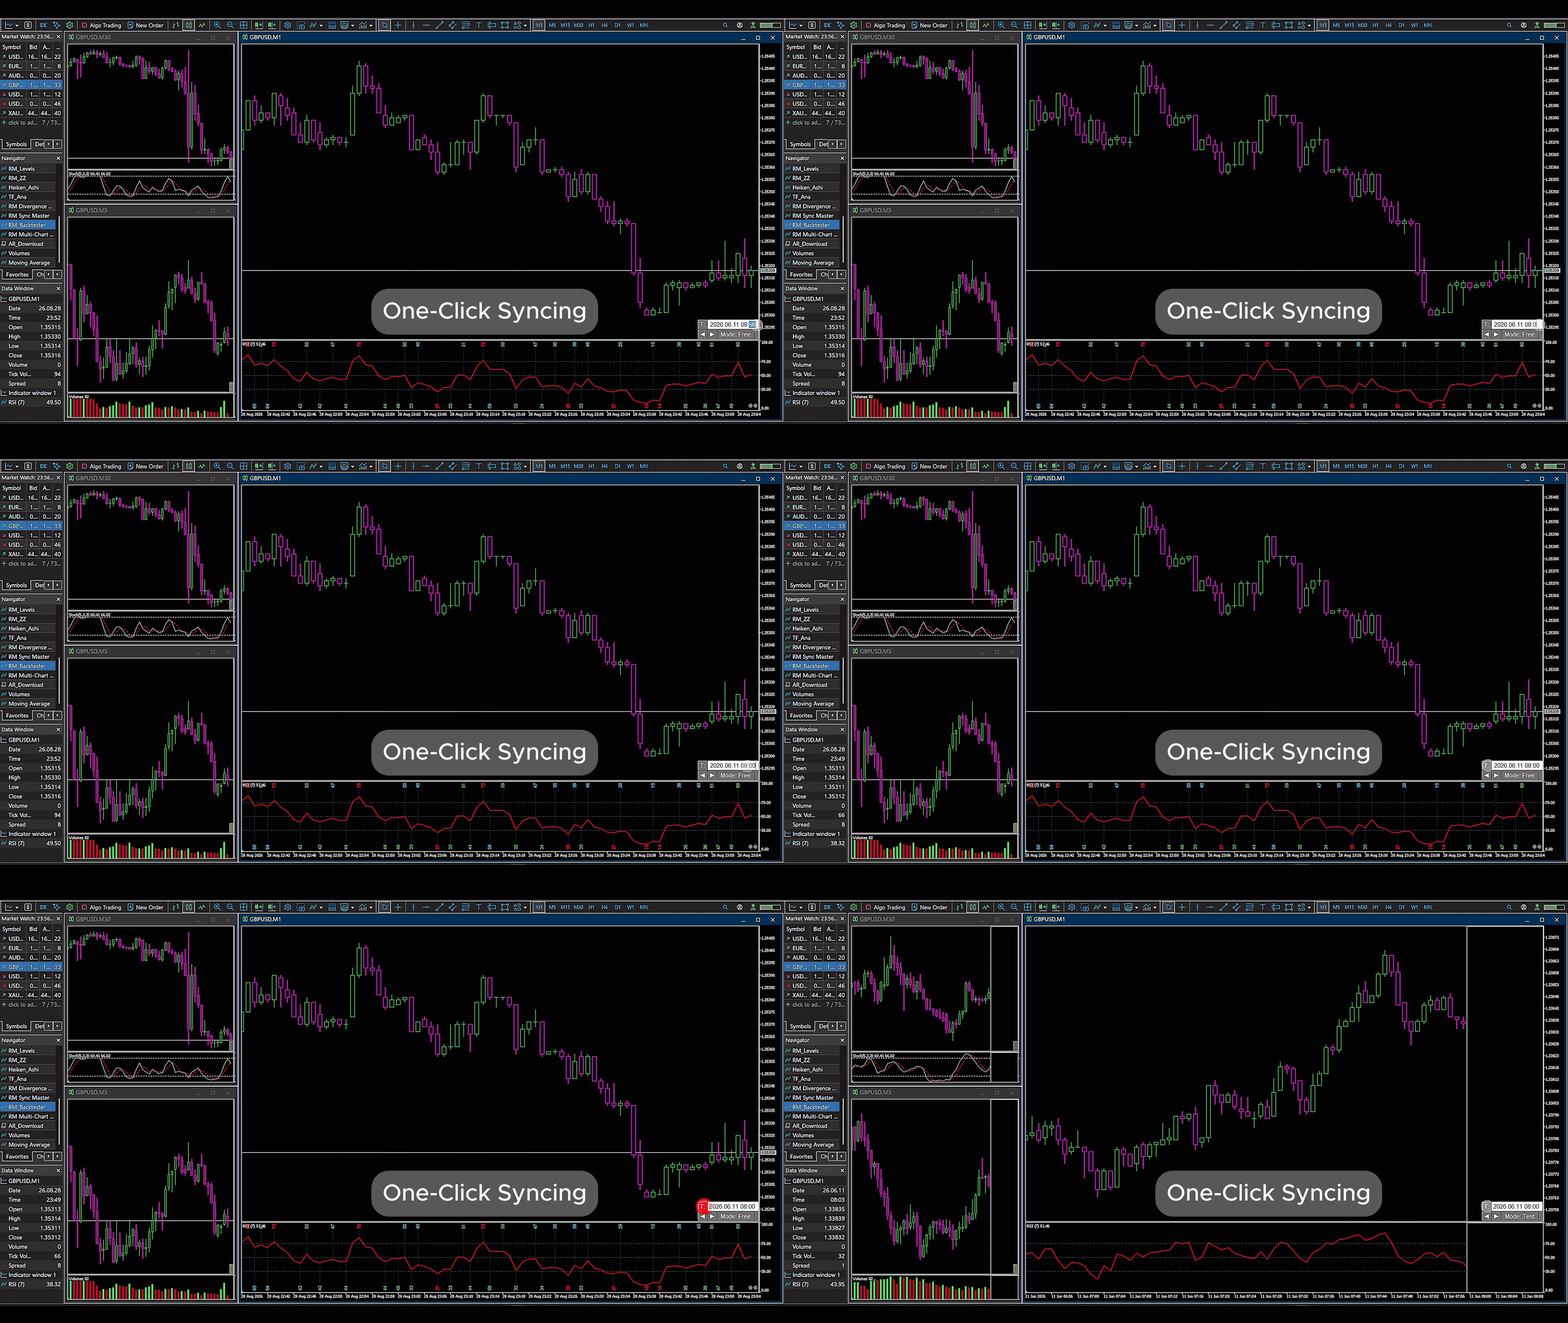
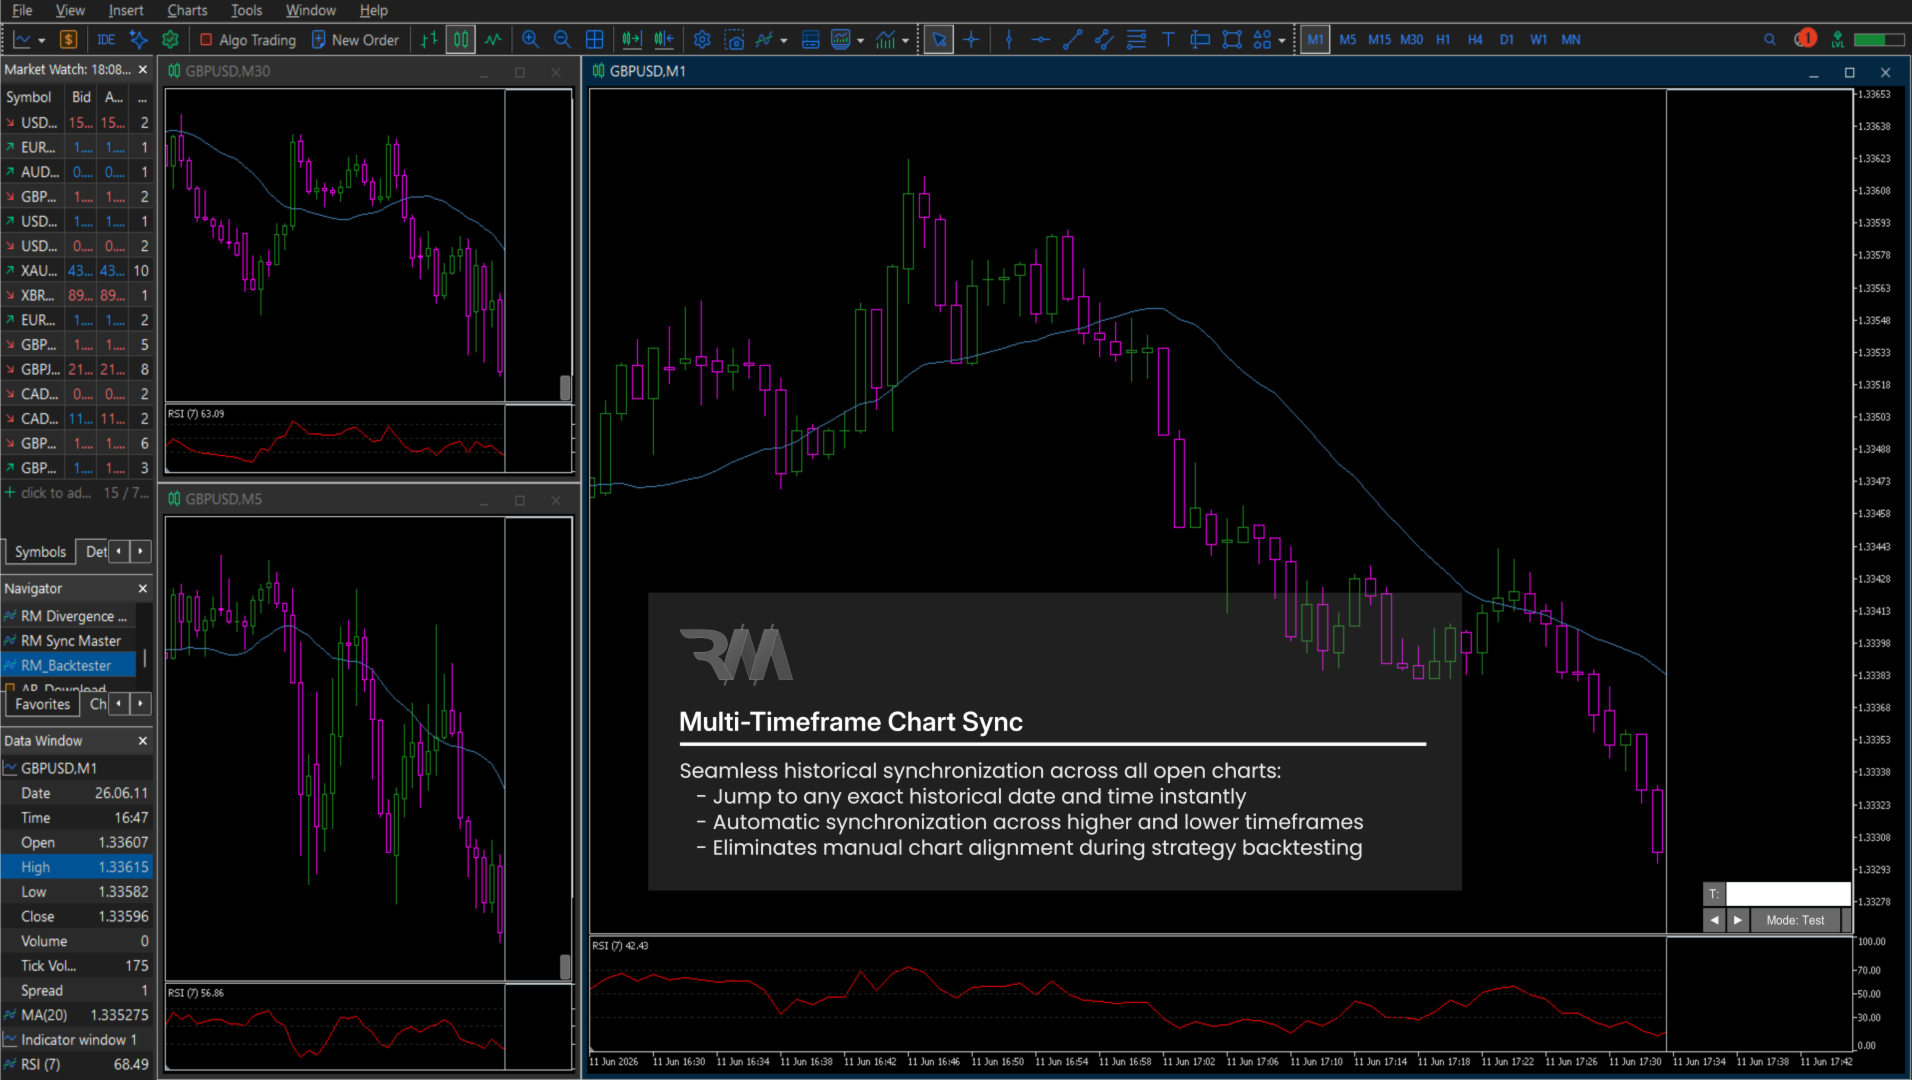
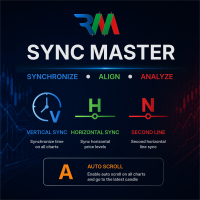
- True Multi-Timeframe Synchronization: Move bar-by-bar on any chart, and all other open charts (e.g., Daily, H4, M15, M1) instantly sync to the exact same historical timestamp.
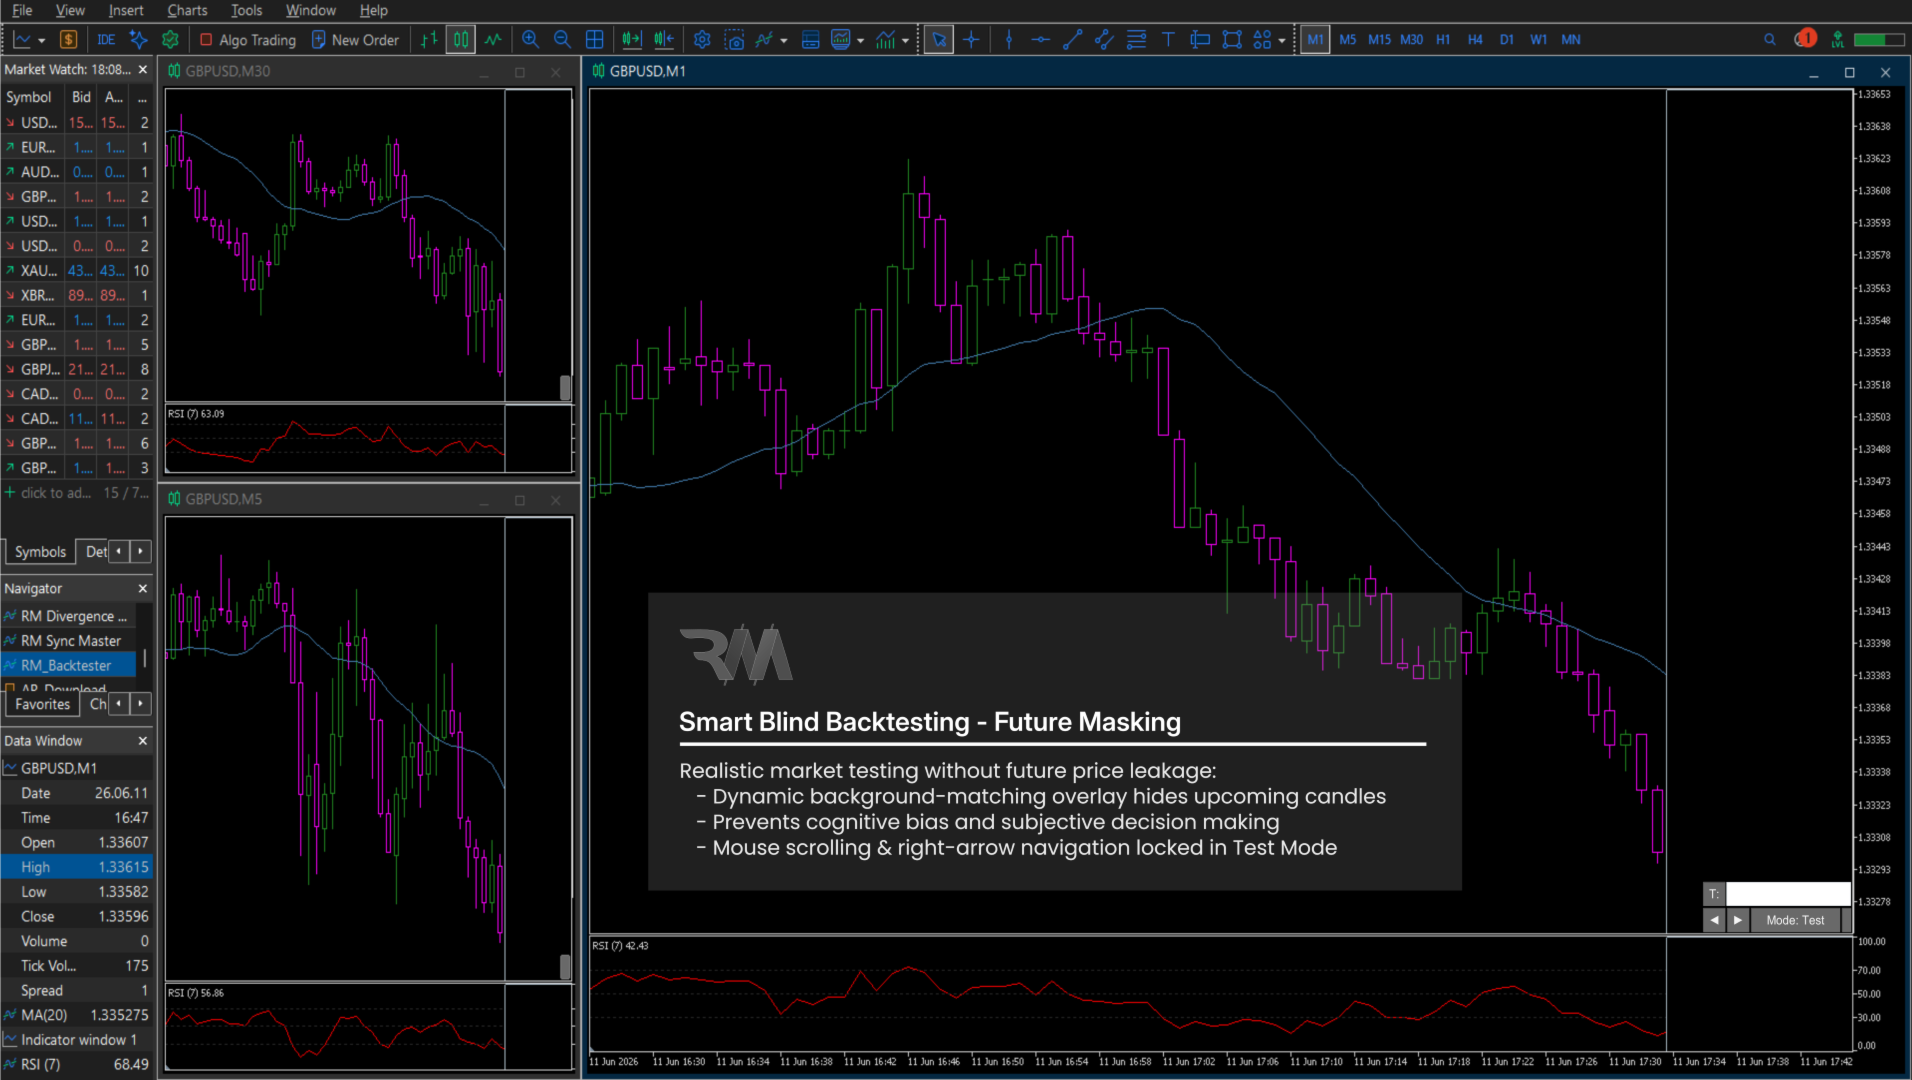
- Smart Blind Backtesting (Future Masking): Completely hides future price action using a dynamic background-matching overlay. Prevent cognitive bias and test your strategies with true market uncertainty.
- Zero Restrictions on Tools & EAs: Unlike MT5 Strategy Tester, you can freely use your custom indicators, moving averages, RSI, Fibonacci levels, drawing tools, and trade management EAs while backtesting.
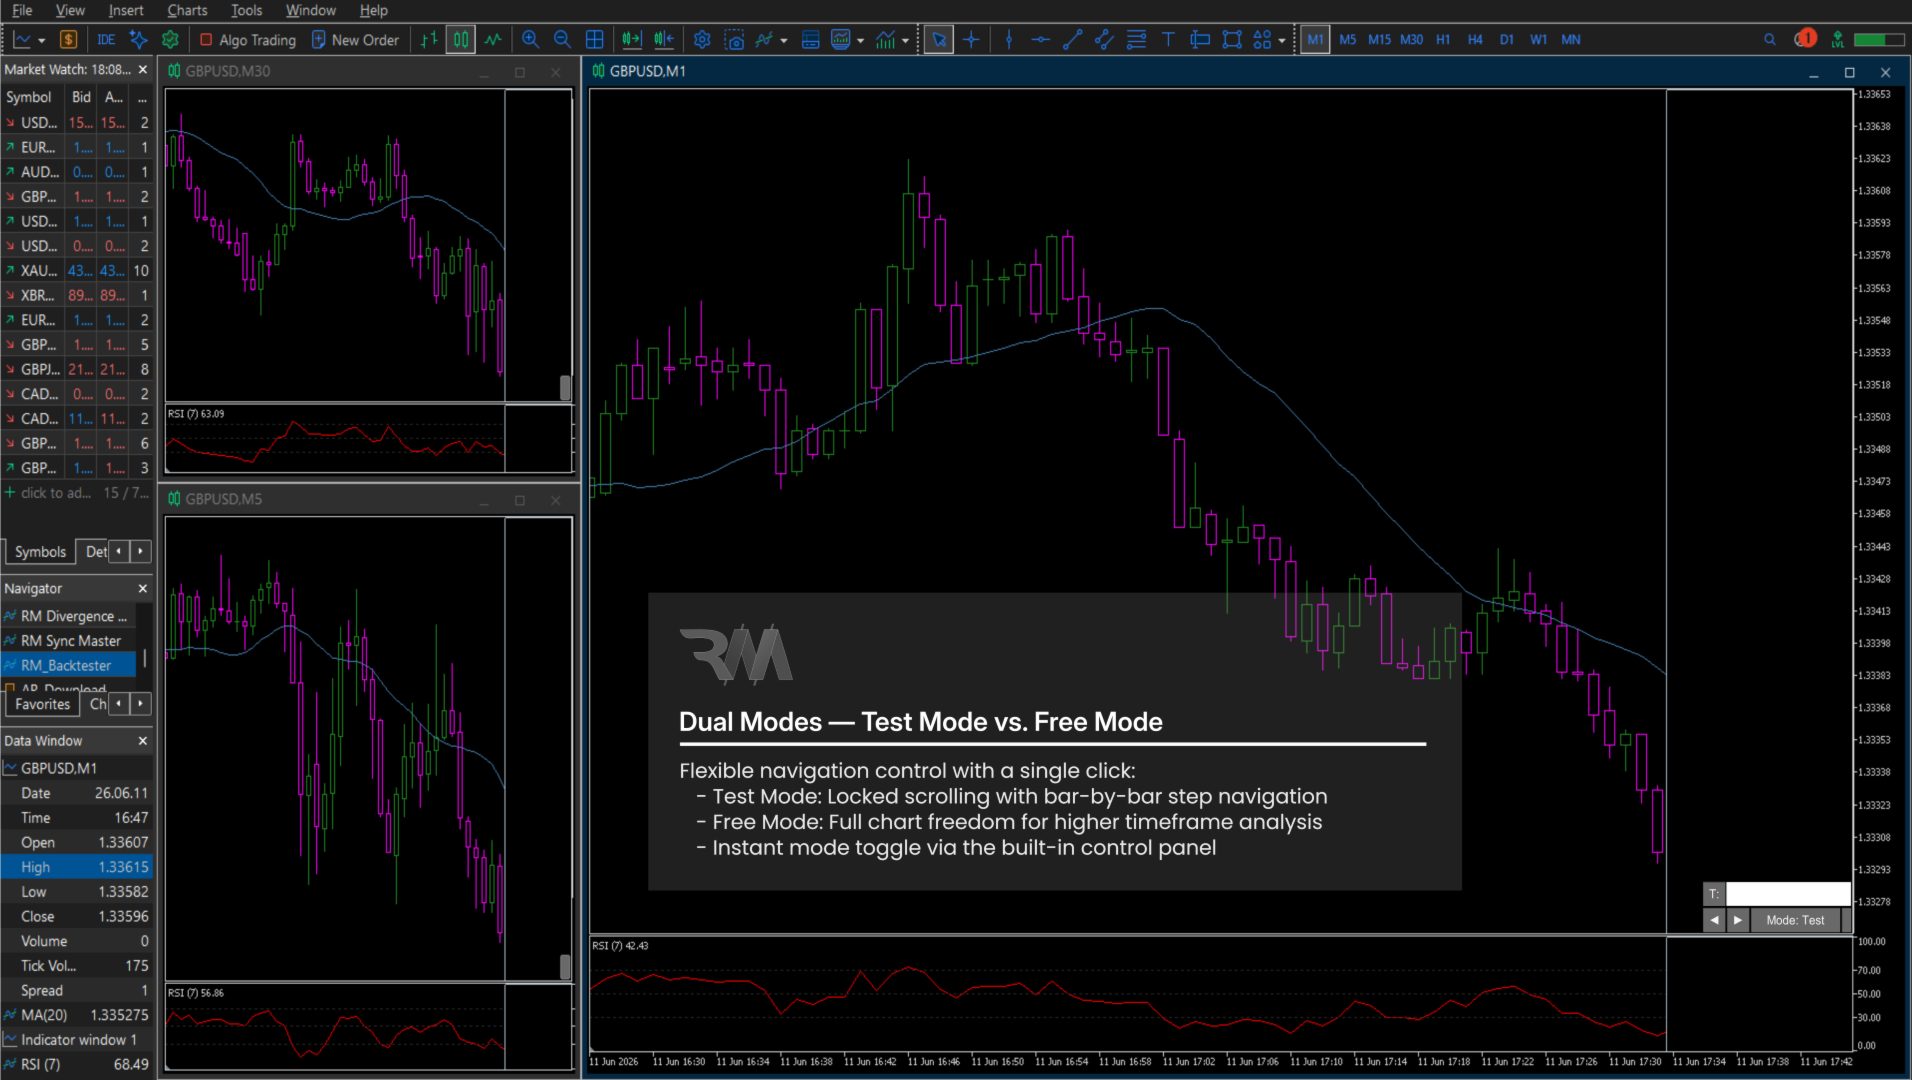
- Fail-Safe Test Mode: In Test Mode, accidental chart scrolling via mouse or horizontal arrows is completely blocked to prevent future-price leaks.
- Free Navigation Mode (Mode: Free): Switch effortlessly between Test Mode and Free Mode with a single click to review historical contexts or perform higher-timeframe analysis without limits.
- Customizable Chart Shift (Right Margin): Set your preferred right margin shift as a percentage of the chart width, ensuring perfect visibility for price action and execution setups.
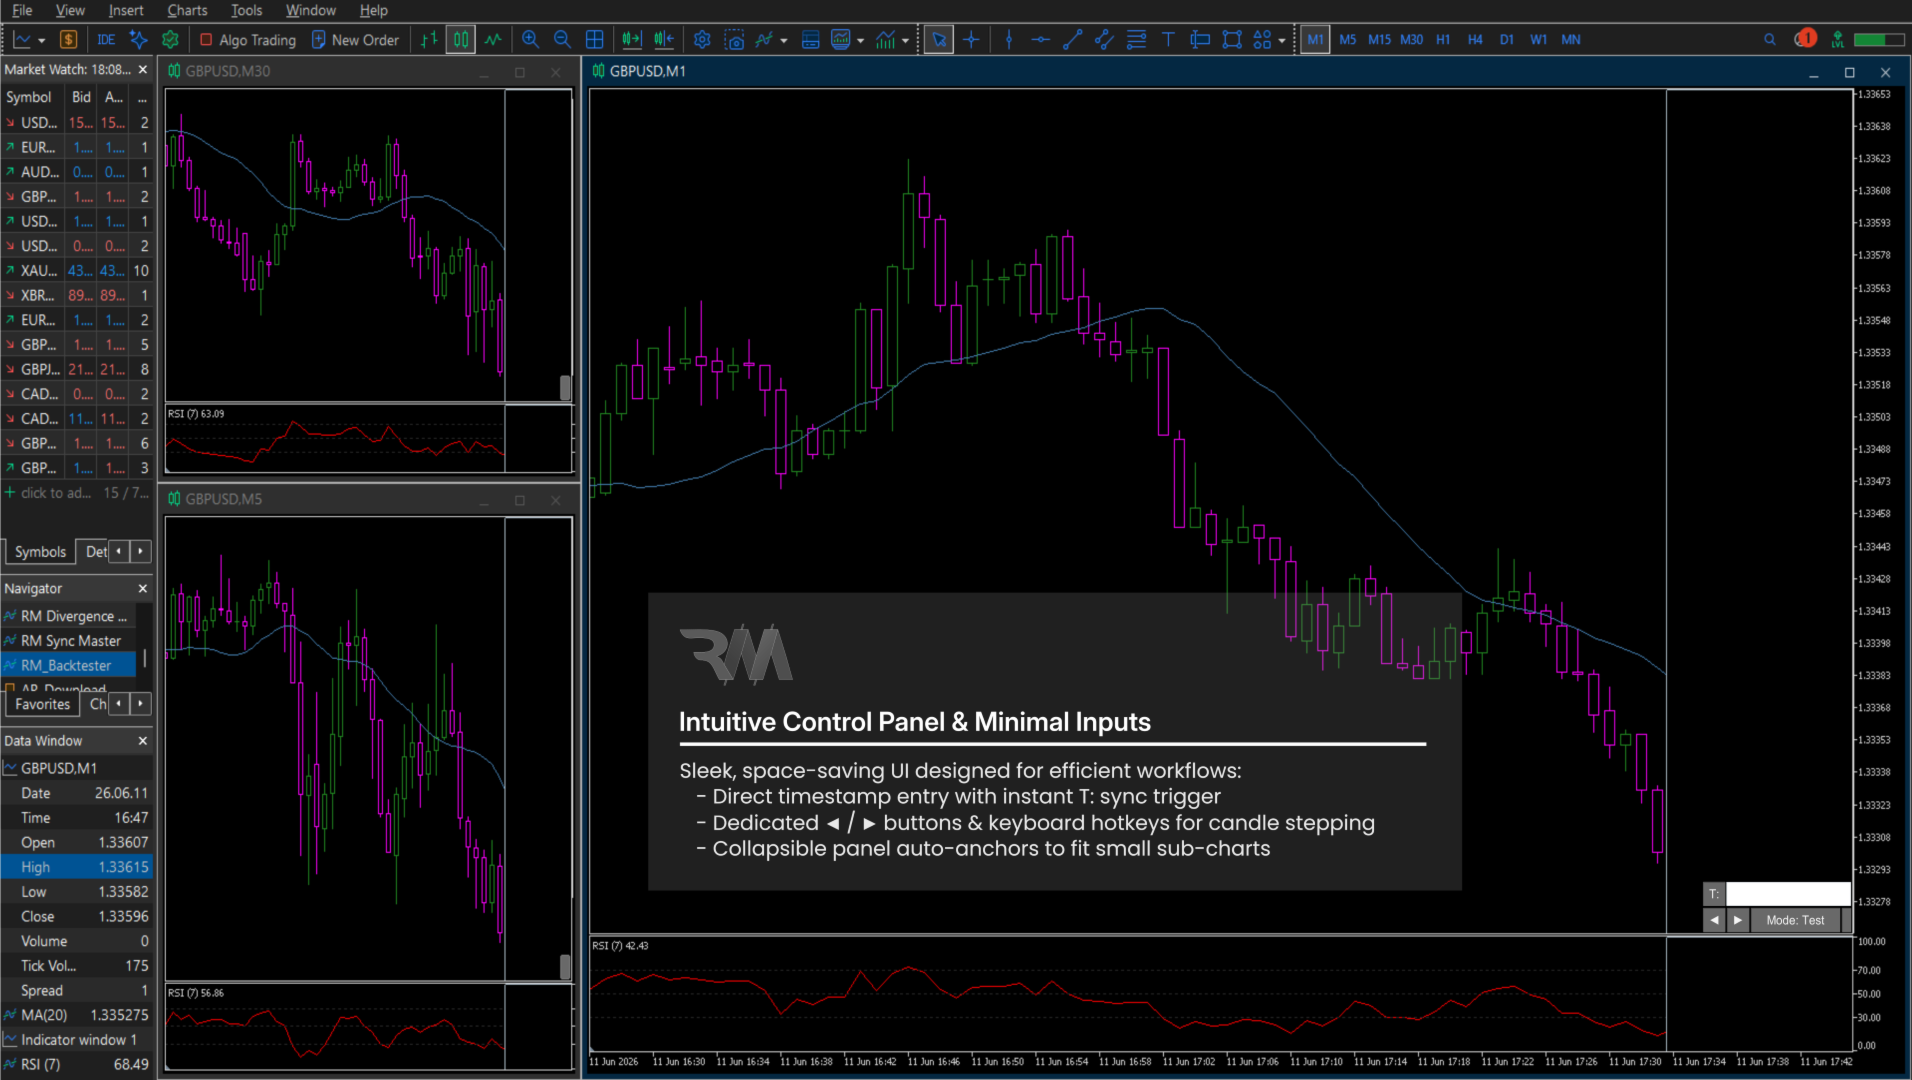
- Space-Saving Collapsible UI: Designed with a sleek, non-intrusive control panel that automatically anchors to the bottom-right corner. Minimize it on sub-charts to keep your workspace 100% clutter-free.
Control Panel Breakdown (6 Core UI Components)
The compact control panel is thoughtfully divided into 6 interactive sections for maximum efficiency:
- Time Input Box: Displays and accepts the target backtest timestamp in YYYY.MM.DD HH:MM format. You can update this time at any point during your test.
- Time Sync Button (T:): Clicking this button instantly jumps all open synchronized charts to the exact date and time specified in the input box.
- Step Backward Button (◀): Moves the simulation back by 1 bar across all synchronized charts.
- Step Forward Button (▶): Advances the simulation forward by 1 bar across all synchronized charts.
- Mode Switch Button (Mode: Test / Free): Toggles between Test Mode (blind backtesting with locked scrolling) and Free Mode (unrestricted chart navigation).
- UI Toggle Button (Side Switch): Minimizes the full dashboard into a tiny edge-docked button or expands it back, ideal for small sub-charts.
Keyboard Shortcuts & Controls:
Effortlessly control your simulation using dedicated hotkeys or the on-screen UI panel:| Control / Key | Mode | Function |
|---|---|---|
| Up Arrow (▲) | Test Mode | Step 1 Bar Forward across all synchronized charts. |
| Down Arrow (▼) | Test Mode | Step 1 Bar Backward across all synchronized charts. |
| Mouse Scroll / Left-Right Arrows | Test Mode | Disabled (Prevents accidental spoiling of future candles). |
| Mouse Scroll / Arrow Keys | Free Mode | Fully enabled for unrestricted chart pan and zoom. |
| Time Button (T:) | All Modes | Syncs all charts to the entered date/time string. |
| Mode Switch Button | All Modes | Toggle between Test and Free modes instantly. |
| Panel Toggle Button | All Modes | Expand / Minimize the dashboard UI. |
How to Use (Step-by-Step Instructions):
- Setup Your Workspace: Open all the timeframes and pairs you want to test simultaneously (e.g., EURUSD M30, M5, and M1).
- Attach Indicator: Apply Multi-Chart Sync Backtester Pro to each open chart window.
- Set Target Time: Type your desired historical date and time directly into the UI Time Box (e.g., 2026.06.22 05:20).
- Synchronize: Click the T: button next to the time box. All charts will jump to that exact historical moment and obscure the future data.
- Start Backtesting:
- Ensure you are in Mode: Test.
- Use the Up/Down Arrow keys or the ◀ / ▶ buttons to step candle-by-candle through the market.
- Watch all timeframes progress simultaneously!
- Switch or Reset: Need to inspect the full chart structure? Click Mode to switch to Mode: Free. Want to jump to another date? Simply type a new timestamp and click T: again.
Indicator Inputs:
- Start with open menu?: Defines whether the UI panel loads expanded (true) or minimized (false) by default.
- Chart shift in Test mode (%): Controls the percentage of empty right margin space on the chart.
- Blank Space color: Custom color for the future cover mask (clrNONE automatically matches your chart background).
Product License:
Includes 5 Activations per purchase (Standard MQL5 activation limit).