Mtf Vwap Pro
- Indicators
- Volkan Karatepe
- Version: 2.1
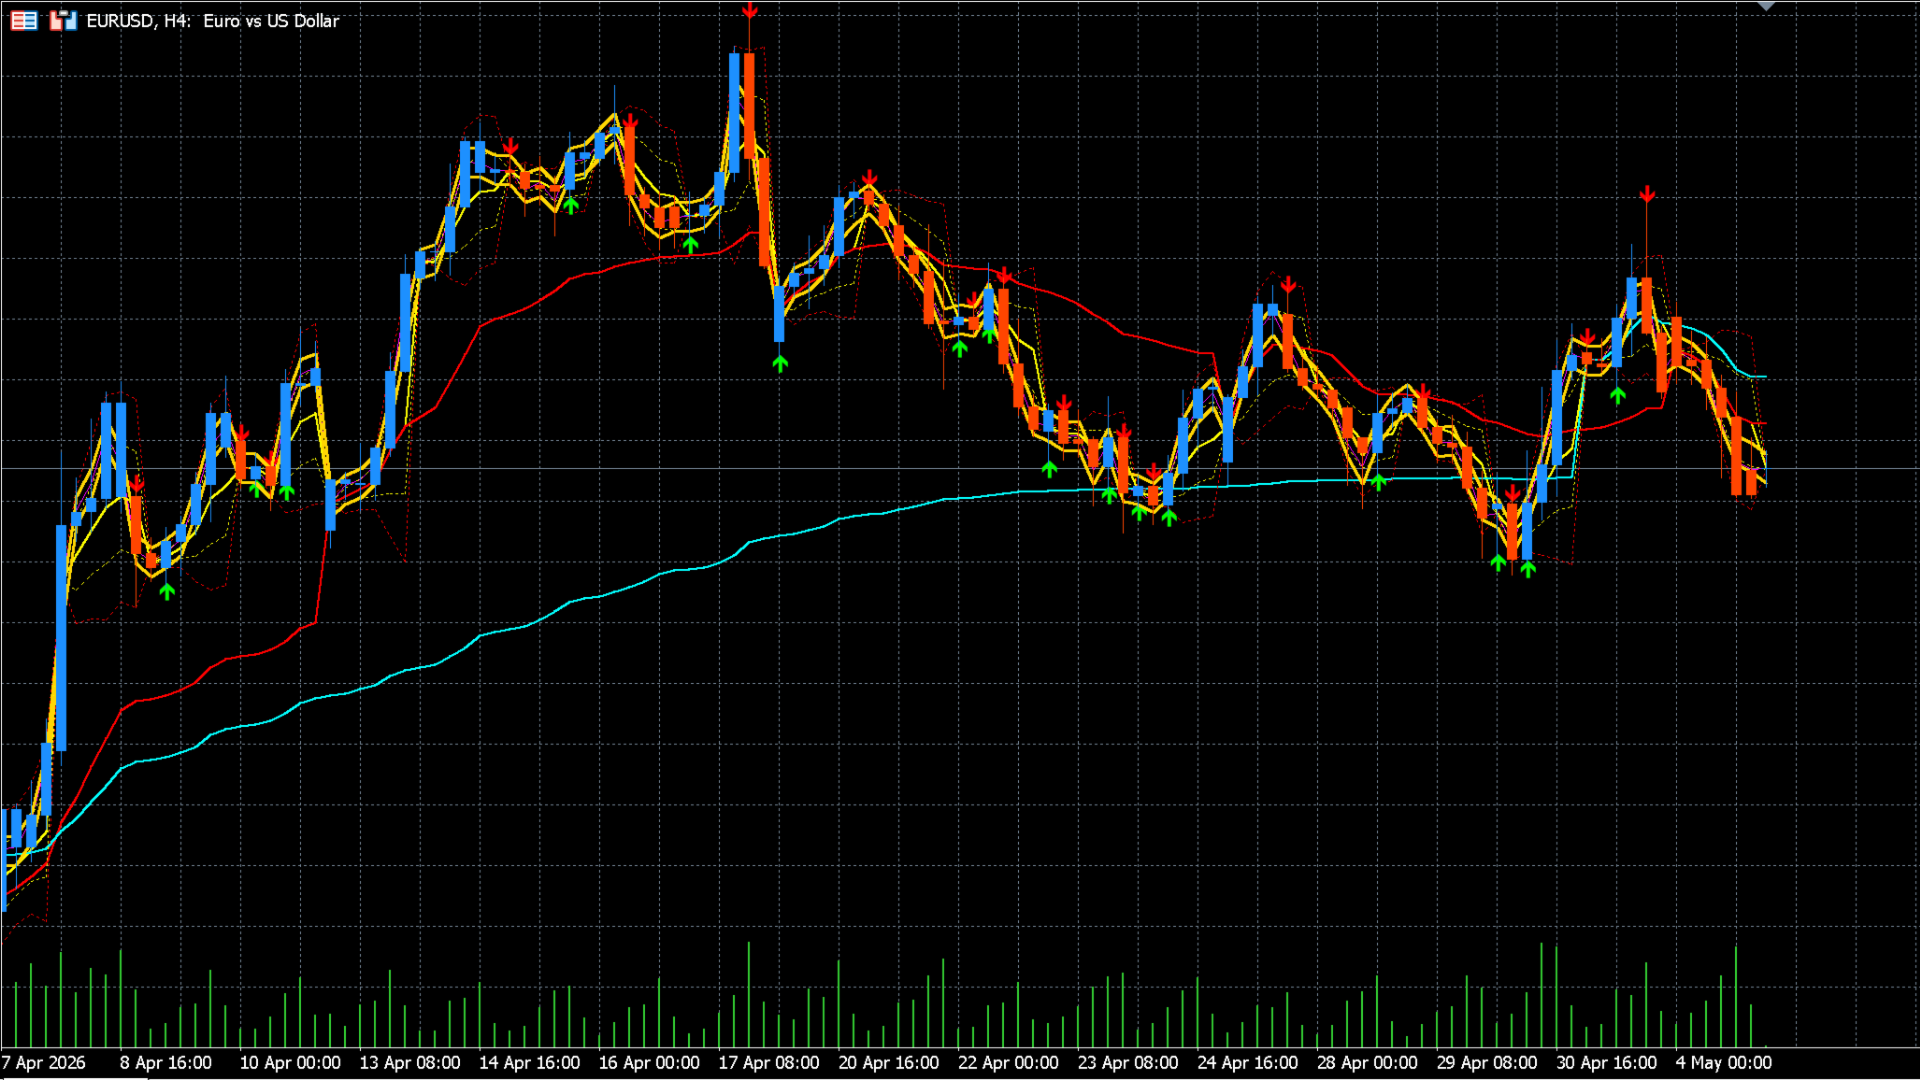
MTF VWAP Pro takes the Volume Weighted Average Price (VWAP) indicator—trusted most by institutional and algorithmic traders—to the next level. By combining VWAP levels from 8 different timeframes (from 1-Minute to Monthly) on a single chart, it allows you to instantly see the true market direction, strong support/resistance zones, and institutional cost levels.
Thanks to its superior coding architecture, it never repaints, eliminates historical signal spamming bugs, and runs at lightning speed without overloading your CPU.
🔥 Highlight Features
-
8 Different Timeframes: 1M, 5M, 15M, 1H, 4H, Daily, Weekly, and Monthly VWAP lines on one screen.
-
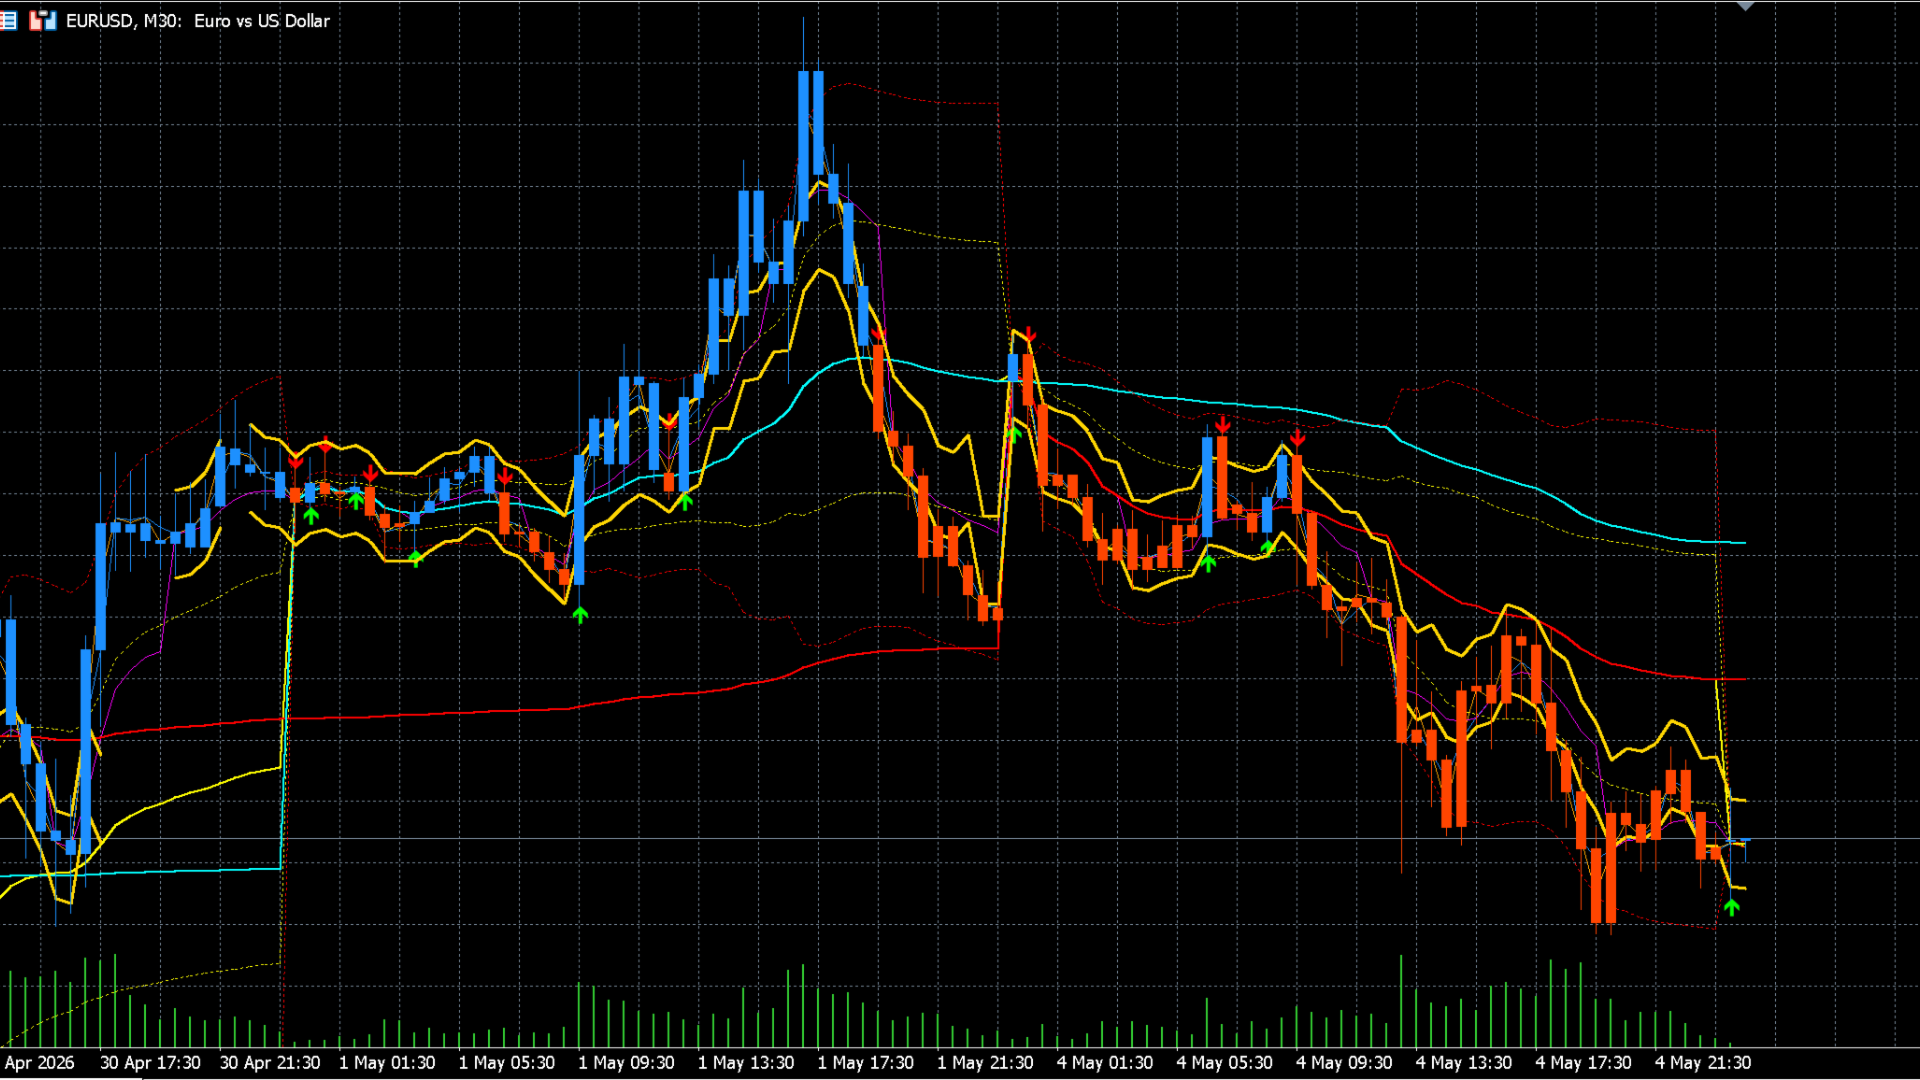
Confluence Zone Detection: Automatically detects where VWAP lines from multiple timeframes converge and draws them as golden strong support/resistance areas (Confluence Zones).
-
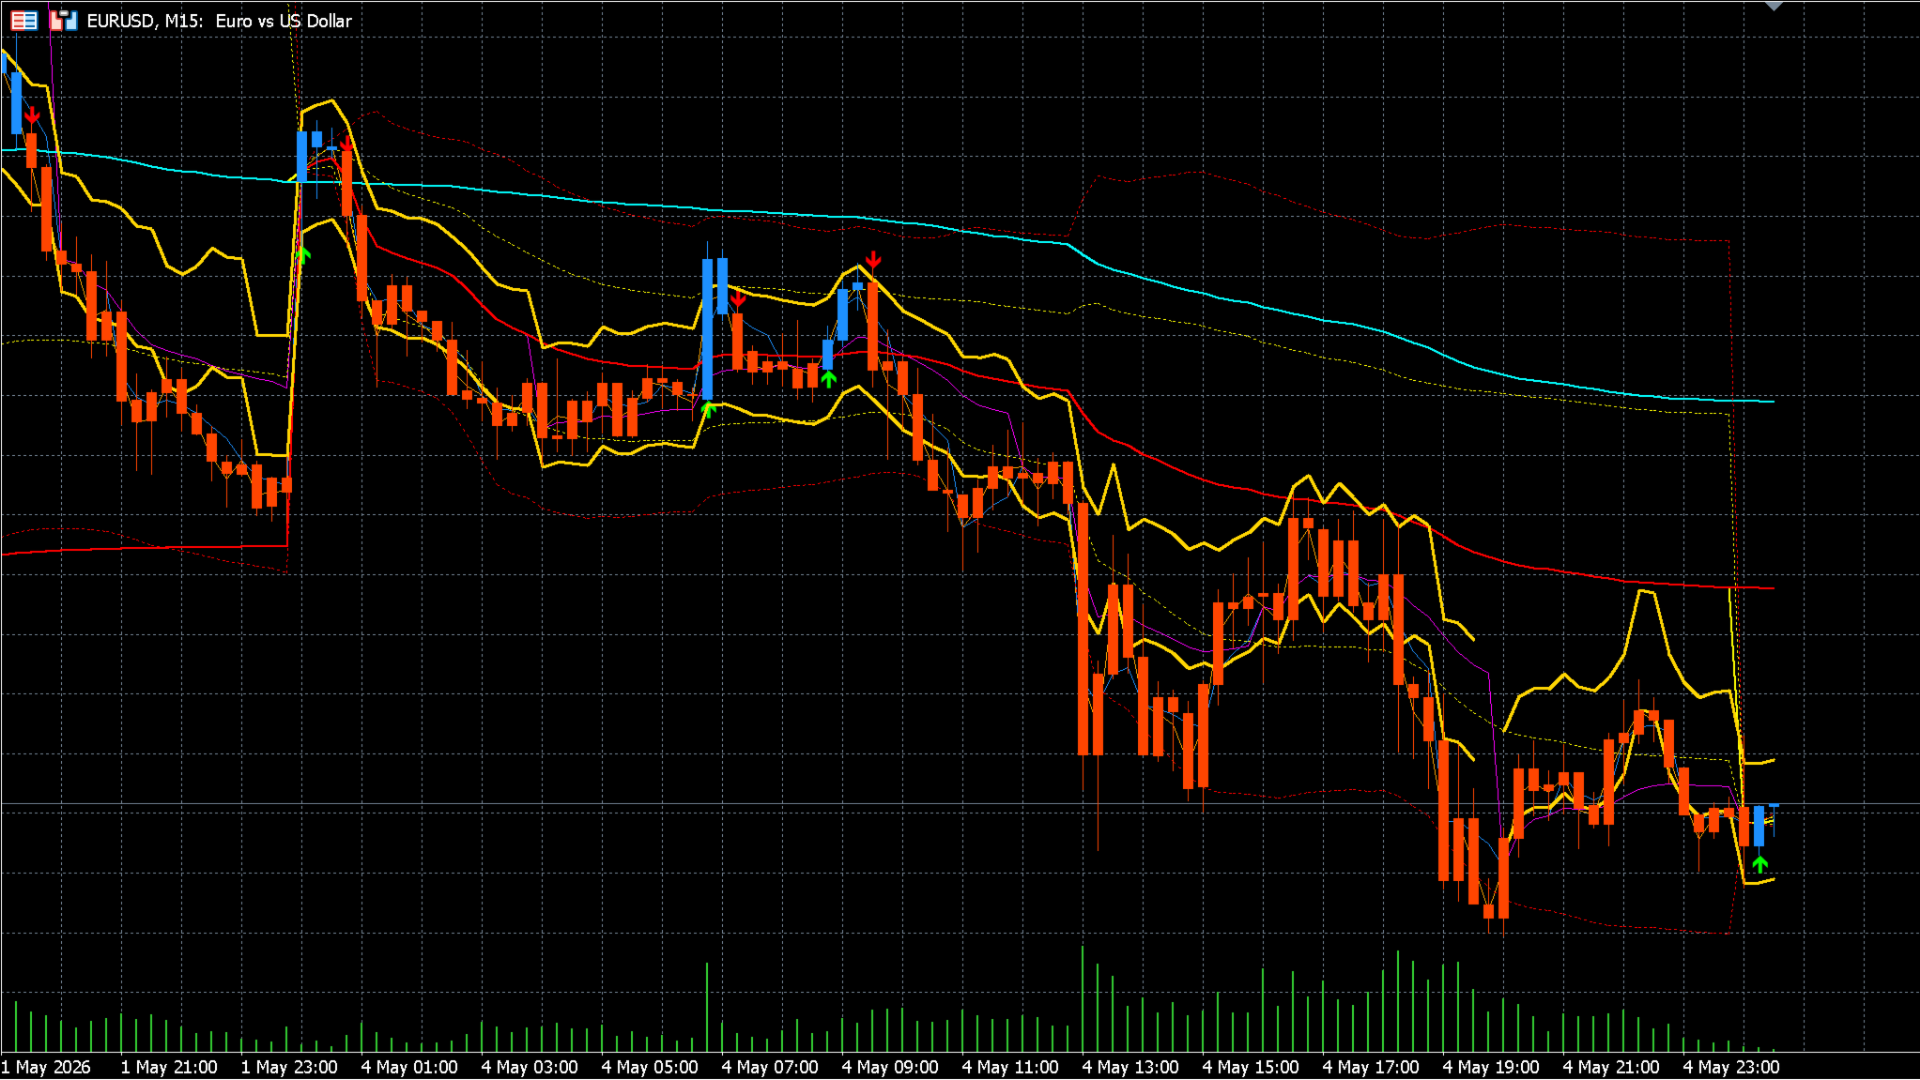
Standard Deviation Bands: Creates ±1 and ±2 standard deviation bands for your selected VWAP, highlighting overbought and oversold market conditions.
-
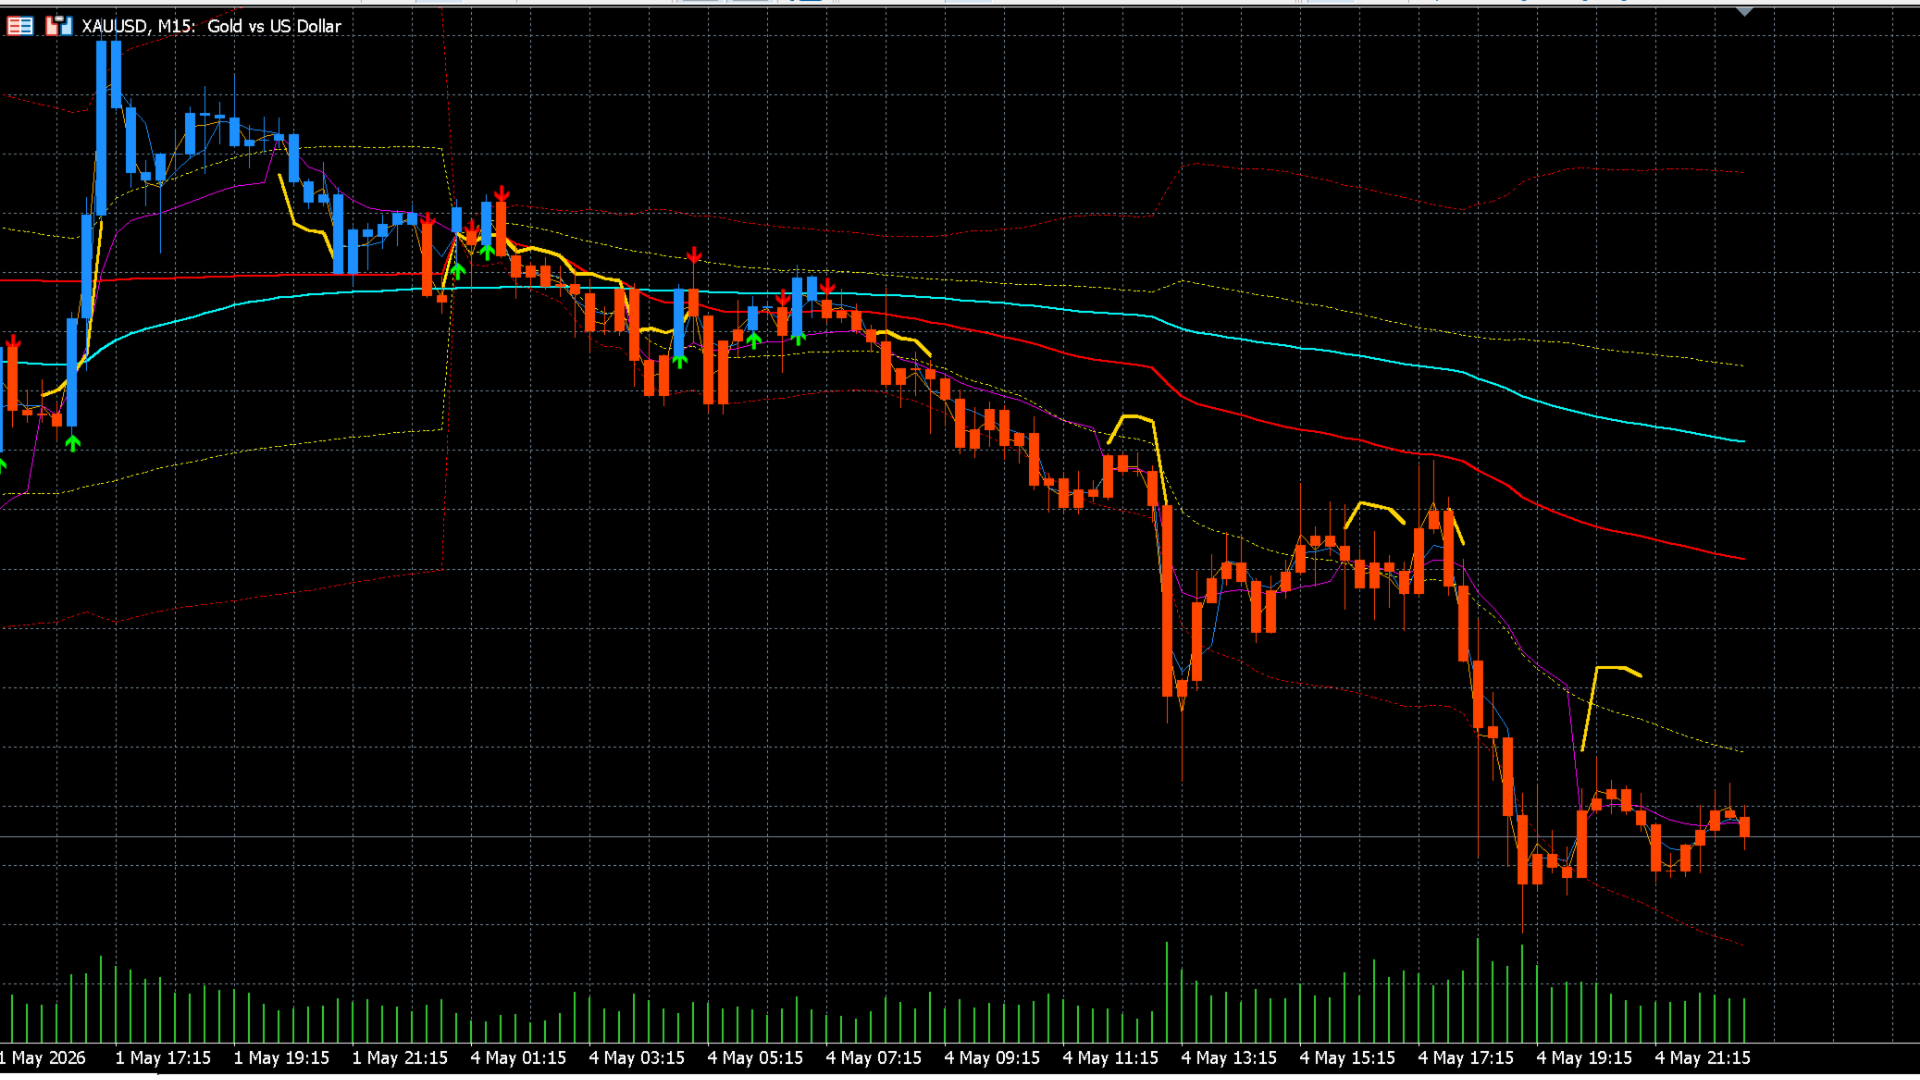
No-Repaint Signals: Generates arrows and sends alerts on candle close when the price crosses your reference VWAP level up or down.
-
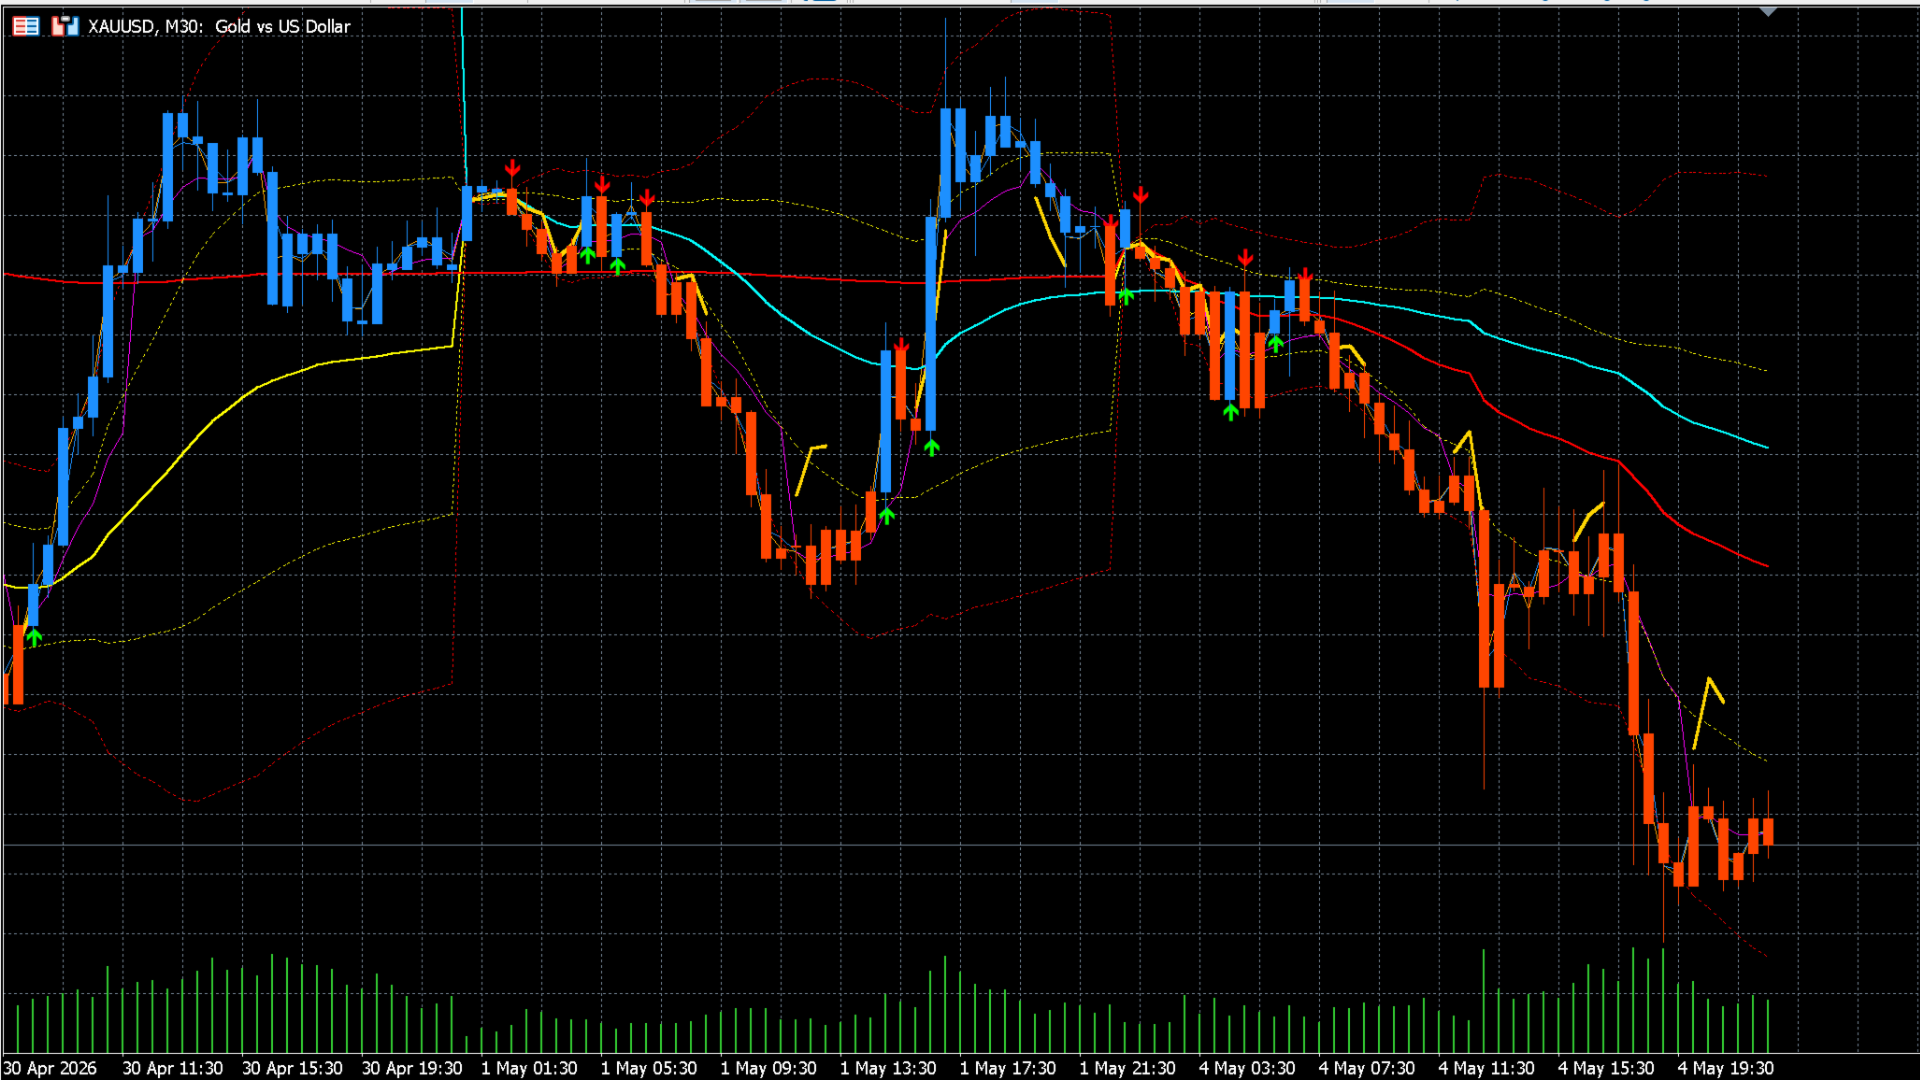
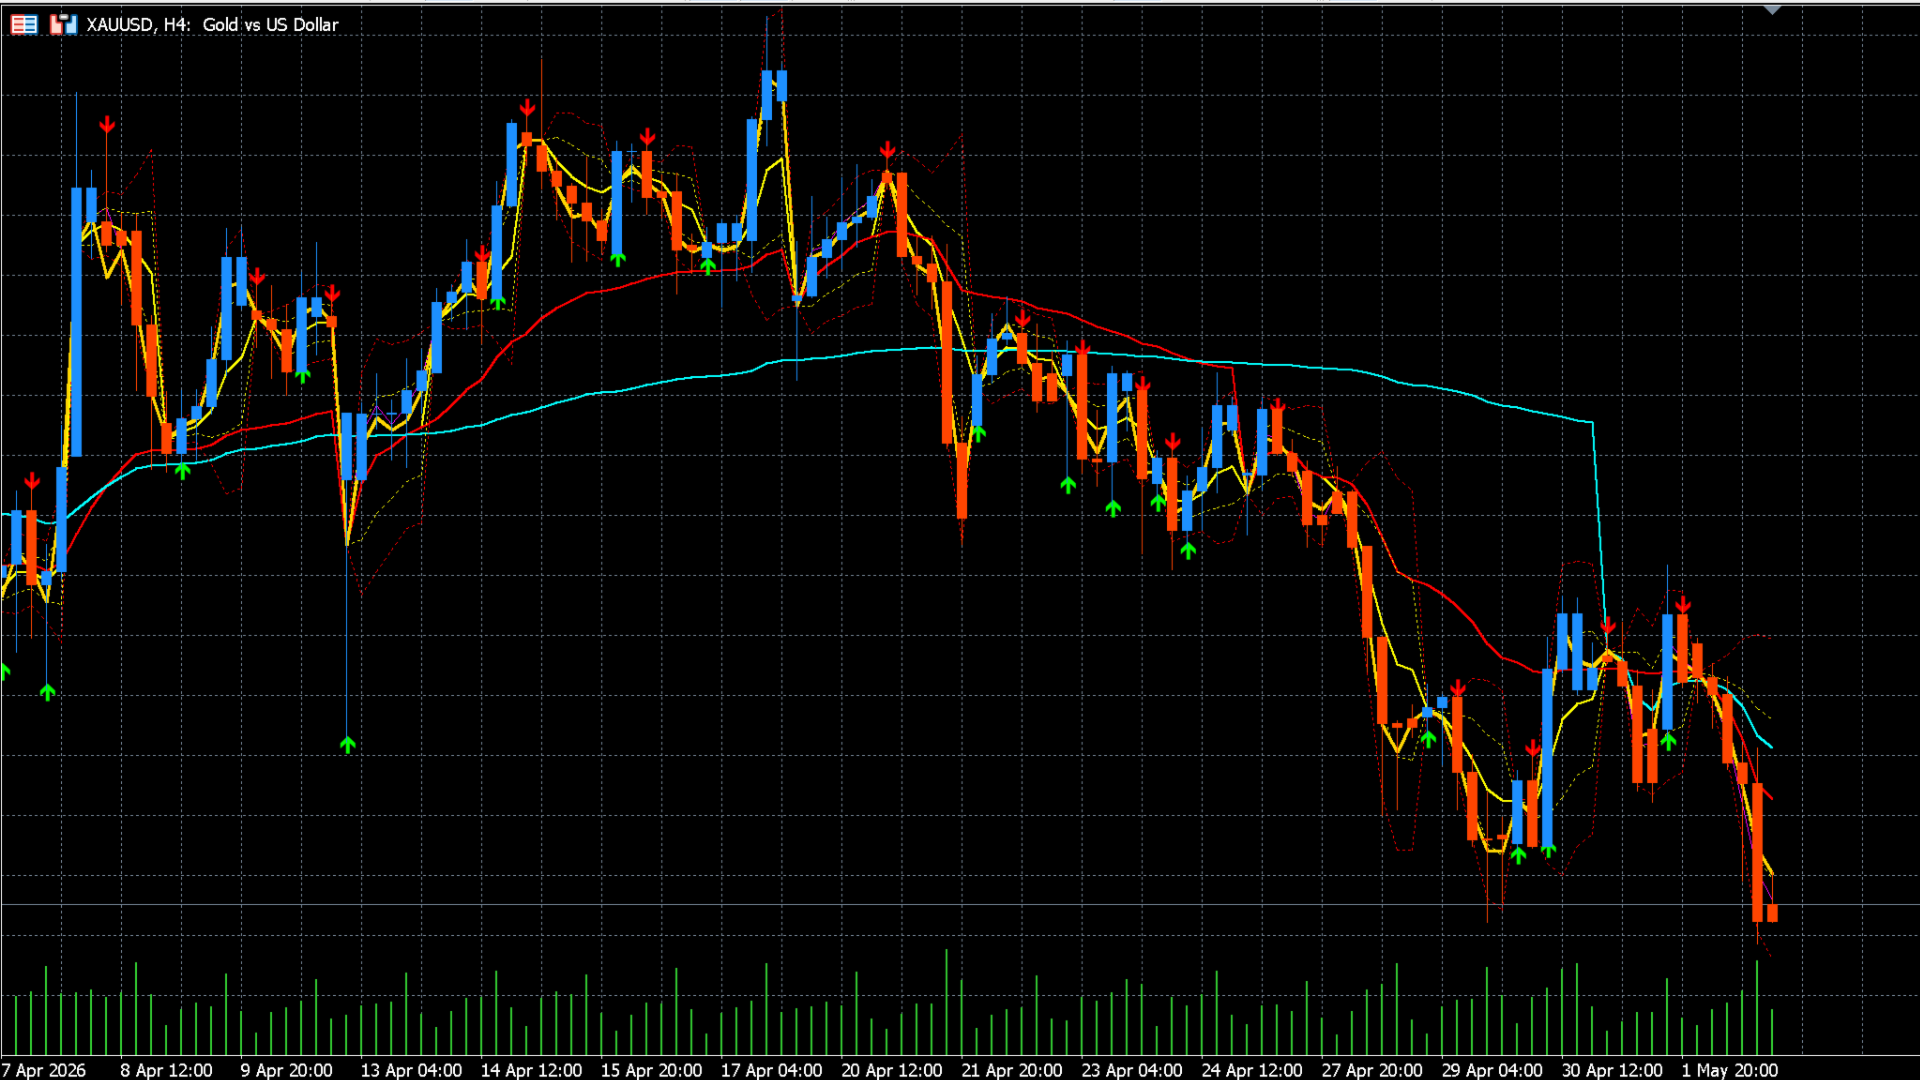
Visual Trend Filter: Automatically colors candles (Bar Color) based on whether they are above or below your selected VWAP, making the market trend visually clear.
-
Advanced Alerts: MT5 Pop-up alerts, Push Notifications to mobile, and Email support. (Only triggers on live bars, no spamming when loading historical data).
💡 How to Use / Trading Strategies
-
Institutional Cost Zones: Daily, Weekly, and Monthly VWAP levels act as the cost basis for institutional players. Price usually produces strong reactions (pullbacks) when approaching these levels.
-
Confluence Trading: The thick boxes drawn by the indicator (Confluence Zones) act as the hardest levels to break. Reversal candles forming inside these zones offer incredibly high risk/reward trading opportunities.
-
Mean Reversion: Prices touching the ±2 Standard Deviation Bands (Dotted Lines) are generally considered "overextended" and tend to revert to the mean (the VWAP).
-
Trend Following: Set the "Bar Coloring" feature to the Weekly VWAP. Look for buy opportunities only on blue (Bull) candles and sell opportunities only on red (Bear) candles to avoid trading against the major trend.
⚙️ Parameters & Settings Guide
You can fully customize the indicator to fit your own strategy. Here are the details of the inputs:
=== Timeframes ===
Enable ( true ) or disable ( false ) the specific VWAP lines you want to see on your chart.
-
Pro Tip: Keep your chart clean by only enabling the timeframes relevant to your trading style (e.g., if you are a day trader, just leave 1H, Daily, and Weekly on).
=== Standard Deviation Bands ===
-
ShowBands / ShowBand1 / ShowBand2: Toggles the ±1 and ±2 deviation bands on or off.
-
BandsTF: Select which VWAP the bands will be calculated from. For example, setting this to PERIOD_D1 calculates the deviation bands around the Daily VWAP.
=== Confluence Detection === [THE MOST POWERFUL FEATURE]
Finds areas where different VWAP lines cluster together to form a solid wall.
-
ShowConfluence: Toggles this feature on/off.
-
ConfluencePips (Pip Threshold): Determines how "close" the lines need to be to form a zone. Effect: Increasing this (e.g., 10) allows the indicator to group wider gaps, drawing thicker zones. Decreasing it (e.g., 2) draws zones only on millimeter-perfect alignments.
-
ConfluenceMin (Minimum Lines): Choose how many different VWAP lines must be clustered together to confirm a "Confluence" zone. Effect: If set to 4, at least 4 different timeframe VWAPs must merge. This gives you fewer but much stronger support/resistance blocks.
=== Signals & Alerts ===
-
ShowSignals: Toggles Buy/Sell arrows on the chart.
-
SignalTF (Signal Reference Period): Determines which VWAP line the arrows will interact with. Example: If set to PERIOD_D1 , a BUY signal arrow is generated when the price crosses above the Daily VWAP, and a SELL signal when it crosses below.
-
EnableAlerts / Push / Email: Turn on your preferred notification methods. Note: To guarantee 100% no-repaint accuracy, signals are only generated after the bar officially closes.
=== Bar Coloring ===
-
ColorBars: When enabled, this overrides your original MT5 candle colors and paints them according to the trend.
-
How it works: It looks at your SignalTF setting. If the price is above that reference VWAP, the candles paint BullBarColor (Blue by default); if below, they paint BearBarColor (Red by default).
=== Visual Settings ===
-
You can freely change the colors, thickness, and style of all lines here to perfectly match your personal chart template (light or dark mode).
⚠️ Important Notes
-
Usage Timeframe: In order to build an accurate matrix for the Multi-Timeframe calculations, you must attach this indicator to an H4 (4-Hour) chart or lower (e.g., M1, M5, M15, M30, H1). It will not function correctly if attached to a Daily or Weekly chart.
-
Volume Data: VWAP relies on volume. This indicator uses the volume data (Tick Volume or Real Volume) provided by your broker. Ensure the instrument you are trading actually provides volume data (It works flawlessly on Forex, Crypto, Indices, and Commodities).