SUM Market Profile Heat

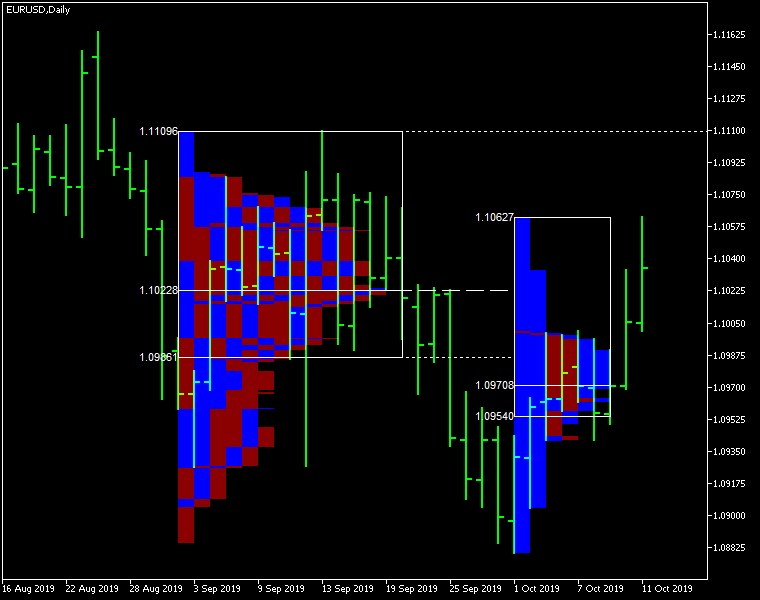
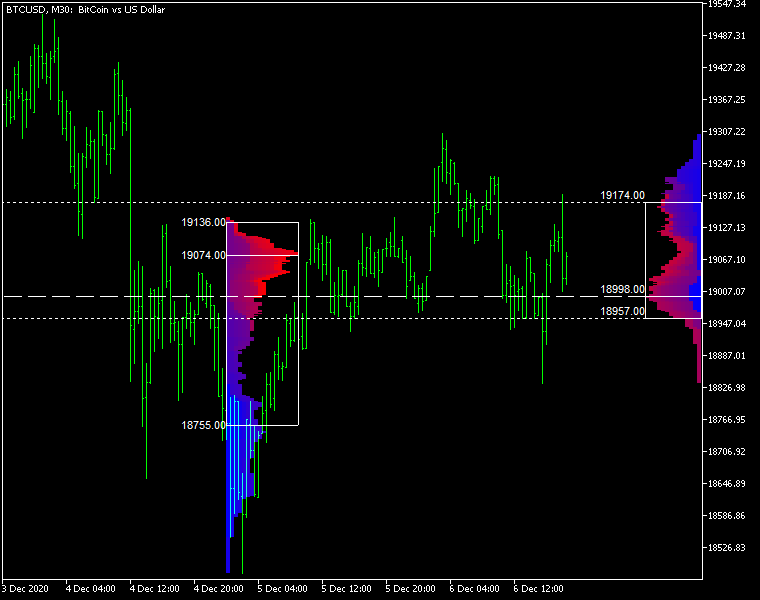
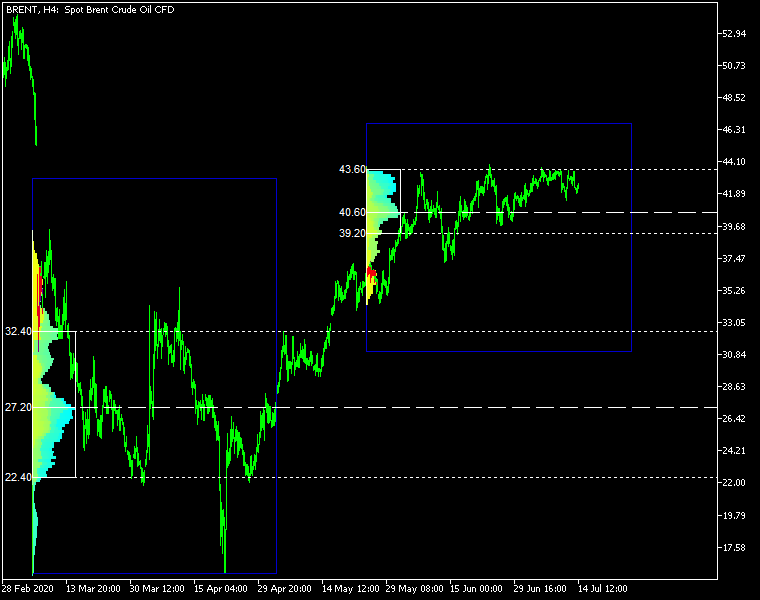
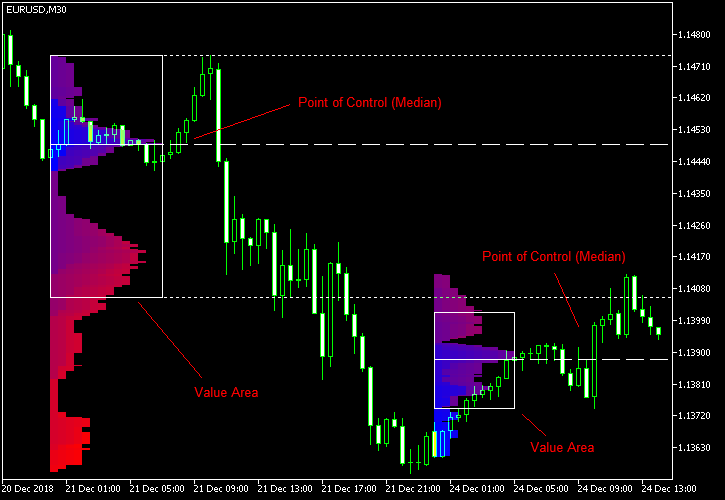
Market Profile Heat indicator — is a classic Market Profile implementation that can show the price density over time, outlining the most important price levels, value area, and control value of a given trading session.
This indicator can be attached to timeframes between M1 and D1 and will show the Market Profile for daily, weekly, monthly, or even intraday sessions. Lower timeframes offer higher precision. Higher timeframes are recommended for better visibility. It is also possible to use a free-draw rectangle session to create a custom market profile on any timeframe. Six different color schemes are available to draw the profile's blocks. Drawing profiles as a plain color histogram is also possible. Alternatively, you may choose to color the profile based on bullish/bearish bars. This indicator is based on bare price action and does not use any standard indicators.

Input parameters

Main

  • Session (default = Daily) — trading session for market profile: Daily, Weekly, Monthly, Intraday, and Rectangle. For a rectangle session to get calculated, a rectangle chart object with the name starting with MPR should be added to the chart. Pressing 'r' on the keyboard will add a properly named rectangle object automatically.
  • StartFromDate (default = __DATE__) — if StartFromCurrentSession is false, then the indicator will start drawing profiles from this date. It draws to the past. For example, if you set it 2018-01-20 and SessionsToCount is 2, then it will draw the profiles for 2018-01-20 and 2018-01-19.
  • StartFromCurrentSession (default = true) — if true, then the indicator starts drawing from today, else — from the date given in StartFromDate.
  • SessionsToCount (default = 2) — for how many trading sessions to draw the market profiles.
  • SeamlessScrollingMode (default = false) — if true, the StartFromDate and StartFromCurrentSession parameters are ignored; the sessions are calculated and displayed starting from the current chart position's rightmost bar. This allows scrolling back in time indefinitely to view past sessions.
  • EnableDevelopingPOC (default = false) — if true, multiple horizontal lines will be drawn to depict how the Point of Control developed through the session.
  • ValueAreaPercentage (default = 70) — a percentage share of the session's TPOs to include in the Value Area.

Looks and colors

  • ColorScheme (default = Blue to Red) — color scheme for profile's blocks:
    • blue to red
    • red to green
    • green to blue
    • yellow to cyan
    • magenta to yellow
    • cyan to magenta
  • SingleColor (default = clrBlue) — if ColorScheme is set to Single Color, this color will be used to draw market profiles.
  • ColorBullBear (default = false) — if true, the color of the profile blocks depends not on the age of the origin bar but on its direction.
  • MedianColor (default = clrWhite) — the color of the control value (median).
  • ValueAreaSidesColor (default = clrWhite) — the color of the value area side borders.
  • ValueAreaHighLowColor (default = clrWhite) — the color of the value area top and bottom borders.
  • MedianStyle (default = STYLE_SOLID) — the Point of Control (median) line style.
  • MedianRayStyle (default = STYLE_DASH) — the Point of Control (median) ray line style.
  • ValueAreaSidesStyle (default = STYLE_SOLID) — the style of the value area side borders.
  • ValueAreaHighLowStyle (default = STYLE_SOLID) — the style of the value area top and bottom borders.
  • ValueAreaRayHighLowStyle (default = STYLE_DOT) — the style of the value area top and bottom rays.
  • MedianWidth (default = 1) — the Point of Control (median) line width.
  • MedianRayWidth (default = 1) — the Point of Control (median) ray line width.
  • ValueAreaSidesWidth (default = 1) — the width of the value area side borders.
  • ValueAreaHighLowWidth (default = 1) — the width of the value area top and bottom borders.
  • ValueAreaRayHighLowWidth (default = 1) — the width of the value area top and bottom rays.
  • ShowValueAreaRays (default = None) — can be set so that the value area's High and Low price levels are projected to the right side of the chart. Can be set to previous session, current, previous and current, all previous, or all.
  • ShowMedianRays (default = None) — can be set so that the median is projected to the right side of the chart. Can be set to previous session, current, previous and current, all previous, or all.
  • RaysUntilIntersection (default = Stop_No_Rays) — defines the way median and value area rays will be cut off when they meet the next trading session's price range:
    • Stop_No_Rays — no rays are stopped anywhere.
    • Stop_All_Rays — all rays are stopped at an intersection with the price of another session.
    • Stop_All_Rays_Except_Prev_Session — all rays except the previous session's rays are stopped at an intersection with the price of another session.
    • Stop_Only_Previous_Session — only rays of the previous session are stopped at an intersection with the price of another session.
  • HideRaysFromInvisibleSessions (default = false) — if true, rays from sessions starting behind the left edge of the screen won't be displayed until you scroll back to them.
  • TimeShiftMinutes (default = 0) — time shift for the sessions, in minutes. Positive value will move the session start to the left; negative — to the right.
  • ShowKeyValues (default = true) — if true, Value Area High, Value Area Low, and Point of Control are displayed on the left of the market profile.
  • KeyValuesColor (default = clrWhite) — the color for Value Area High, Value Area Low, and Point of Control printout.
  • KeyValuesSize (default = 8) — the font size for Value Area High, Value Area Low, and Point of Control printout.
  • ShowSinglePrint (default = No) — can be set to Leftside or Rightside and will mark the single print profile — a part of the profile, which is only one TPO wide.
  • SinglePrintRays (default = false) — if true, single print edges are marked with rays.
  • SinglePrintColor (default = clrGold) — the color for single print marking if ShowSinglePrint isn't set to No.
  • SinglePrintRayStyle (default = STYLE_SOLID) — the single print ray line style.
  • SinglePrintRayWidth (default = 1) — the single print ray line width.
  • ProminentMedianColor (default = clrYellow) — the color for the prominent median (PPOC) if ProminentMedianPercentage is set to 100 or less.
  • ProminentMedianStyle (default = STYLE_SOLID) — the style for the prominent median (PPOC) if ProminentMedianPercentage is set to 100 or less.
  • ProminentMedianWidth (default = 4) — the width for the prominent median (PPOC) if ProminentMedianPercentage is set to 100 or less.
  • RightToLeft (default = false) — if true, the current session's market profile has its histogram drawn from right to left. In case Session is set to Rectangle, market profiles of all sessions are drawn right-to-left.

Performance

  • PointMultiplier (default = 0) — the higher it is, the wider are the profile's price boxes and the fewer are the chart objects. You can use it to reduce the indicator's load on CPU. When the value is zero, an adaptive multiplier is used — the indicator attempts to calculate the optimal value automatically.
  • ThrottleRedraw (default = 0) — a delay in seconds that will be applied before each redraw of the profiles. You can use it to reduce the indicator's load on CPU.
  • DisableHistogram (default = false) — if true, no market profile histogram is drawn, but Value Area and Median are still marked. This makes indicator work extremely fast, but is less useful for thorough market analysis.

Alerts

  • AlertNative (default = false) — if true, the indicator will issue the platform's native pop-up alert when some alert conditions are met.
  • AlertEmail (default = false) — if true, MetaTrader's email alerts will be sent when some alert conditions are met. Email should be properly configured in MetaTrader via Tools->Options->Email
  • AlertPush (default = false) — if true, MetaTrader's push notification alerts will be sent to your mobile device when some alert conditions are met. Notifications should be properly configured in MetaTrader via Tools->Options->Notifications. This alert type is not available in the cTrader version of the indicator.
  • AlertArrows (default = false) — if true, MetaTrader will draw arrows on the chart when some alert conditions are met.
  • AlertCheckBar (default = Previous) — controls the bar to check the alert conditions on. Current — the indicator will check the current unfinished bar; expect a lot of alerts. Previous — the indicator will check the previous (closed) bar; alerts will be delayed but more concise.
  • AlertForValueArea (default = false) — if true, alerts will be issued whenever a Value Area ray (high or low) is crossed by the price.
  • AlertForMedian (default = false) — if true, alerts will be issued whenever a Median ray is crossed by the price.
  • AlertForSinglePrint (default = false) — if true, alerts will be issued whenever a Single Print ray is crossed by the price.
  • AlertOnPriceBreak (default = false) — if true, alerts will be issued when the price breaks any of the trigger levels but then returns back behind it.
  • AlertOnBarClose (default = false) — if true, alerts will be issued when the bar opens on one side the trigger level and closes on the other side of it.
  • AlertOnGapCross (default = false) — if true, alerts will be issued when the trigger level appears inside a price gap between the last two bars.
  • AlertArrowCodePB (default = 108) — arrow code for price break alert arrows.
  • AlertArrowCodeCC (default = 110) — arrow code for candle close alert arrows.
  • AlertArrowCodeGC (default = 117) — arrow code for gap crossover alert arrows.
  • AlertArrowColorPB (default = clrRed) — arrow color for price break alert arrows.
  • AlertArrowColorCC (default = clrBlue) — arrow color for candle close alert arrows.
  • AlertArrowColorGC (default = clrYellow) — arrow color for gap crossover alert arrows.
  • AlertArrowWidthPB (default = 1) — arrow width for price break alert arrows.
  • AlertArrowWidthCC (default = 1) — arrow width for candle close alert arrows.
  • AlertArrowWidthGC (default = 1) — arrow width for gap crossover alert arrows.

Intraday sessions

  • EnableIntradaySessionN (default = true) — if true and Session is set to Intraday, then the indicator will attempt to drawn the intraday market profile #N on the chart.
  • IntradaySessionNStartTime (default = "HH:MM") — start time in HH:MM format for the intraday session #N.
  • IntradaySessionNEndTime (default = "HH:MM") — end time in HH:MM format for the intraday session #N.
  • IntradaySessionNColorScheme (default = Blue_to_Red) — color scheme for the intraday session #N.

Miscellaneous

  • SaturdaySunday (default = Normal sessions) — how to treat Saturday and Sunday sessions:
    • Normal sessions — Saturday and Sunday will be treated as normal sessions with their own daily and intraday sessions.
    • Ignore Saturday and Sunday — Saturday and Sunday candlesticks will be ignored.
    • Append Saturday and Sunday — Saturday candlesticks will be appended to the Friday session; Sunday candlesticks will be appended to the Monday session.
  • DisableAlertsOnWrongTimeframes (default = false) — if true, no pop-up alerts will appear on using Market Profile with wrong timeframe/session combination.
  • ProminentMedianPercentage (default = 101) — percentage of TPOs out of all possible that should occur inside a median for it to be considered prominent (PPOC). For example, if you set it to 50%, a median will be marked as prominent if it contains at least 24 TPOs in a daily session on M30 timeframe. If it is set to 101, no prominent median is possible.


Recommended products
Boom Crash SMC
Israr Hussain Shah
Here   our more valuable tools SMC Trend Trading   ,  Easy SMC Trading  ,  Institutional SMC Architect Volume Analysis Tools  ,  Volume flow Profile  ,  Market volume profile  , FVG with Volume  , Liquidity Heatmap Profile  ,  Volume Spread Analysis Deriv boom and crash index spike killer system you can use it only on m5 timeframe  follow the structure and get signal with alert on phone open trade set sl tp and enjoy easy analysis and trading made simple 
Money Flow Profile MT4  HERE   Use Guide Here our more valuable tools SMC Trend Trading   ,  Easy SMC Trading  ,  Institutional SMC Architect Volume Analysis Tools  ,  Volume flow Profile  ,  Market volume profile  , FVG with Volume  , Liquidity Heatmap Profile  ,  Volume Spread Analysis  Master Edition is a professional-grade analytical tool designed to visualize market structure through the lens of volume and money flow. Unlike standard volume indicators, this tool displays a Daily Vo
Liquidity HeatMap Profile
Israr Hussain Shah
5 (1)
Here   our more valuable tools SMC Trend Trading   ,  Easy SMC Trading  ,  Institutional SMC Architect Volume Analysis Tools  ,  Volume flow Profile  ,  Market volume profile  , FVG with Volume  , Liquidity Heatmap Profile  ,  Volume Spread Analysis 2. Key Features Dynamic Filtering : The core feature. As soon as the current price crosses a historical liquidity level, that level disappears. This reduces chart clutter and prevents you from trading off "dead" support/resistance. Liquidity Heatma
Here   our more valuable tools SMC Trend Trading   ,  Easy SMC Trading  ,  Institutional SMC Architect Volume Analysis Tools  ,  Volume flow Profile  ,  Market volume profile  , FVG with Volume  , Liquidity Heatmap Profile  ,  Volume Spread Analysis Boom: Take SELL signals only (price spikes up then crashes) Crash: Take BUY signals only (price drops then spikes up) SL goes beyond the line as labeled Interactive Market Watch Panel : A left-side sidebar showing real-time strength indicators (po
This Volume Delta Profile is an advanced MetaTrader 5 indicator that visualizes   volume delta (order flow imbalance)   using a volume profile-style histogram. It shows the difference between buying and selling pressure at specific price levels, helping traders identify supply and demand zones. This indicator provides a unique perspective on market dynamics by visualizing the imbalance between buying and selling pressure, offering insights beyond traditional volume analysis. Core Concept Positiv
Here   our more valuable tools SMC Trend Trading   ,  Easy SMC Trading  ,  Institutional SMC Architect Volume Analysis Tools  ,  Volume flow Profile  ,  Market volume profile  , FVG with Volume  , Liquidity Heatmap Profile  ,  Volume Spread Analysis Transform Your Trading with Intelligent Market Insights! The 2025 Spike Killer Dashboard is a powerful MQL5 indicator that combines cutting-edge signal generation with an intuitive crystal dashboard for real-time market analysis. Designed for tra
Here   our more valuable tools SMC Trend Trading   ,  Easy SMC Trading  ,  Institutional SMC Architect Volume Analysis Tools  ,  Volume flow Profile  ,  Market volume profile  , FVG with Volume  , Liquidity Heatmap Profile  ,  Volume Spread Analysis The    Liquidity Heatmap   is a sophisticated institutional trading tool designed to reveal where over-leveraged traders are trapped. By calculating estimated liquidation levels based on volume spikes and leverage, this indicator draws a dynamic "h
BoxChart MT5
Evgeny Shevtsov
5 (7)
The market is unfair if only because 10% of participants manage 90% of funds. An ordinary trader has slim changes to stand against these "vultures". This problem can be solved. You just need to be among these 10%, learn to predict their intentions and move with them. Volume is the only preemptive factor that faultlessly works on any timeframe and symbol. First, the volume appears and is accumulated, and only then the price moves. The price moves from one volume to another. Areas of volume accumu
MR Volume Profile 5
Sergey Khramchenkov
The "MR Volume Profile 5" indicator is a charting tool that displays trading volume at different price levels rather than time intervals. A key concept in volume profile is the point of control (POC)—the price level with the highest volume traded during the session or time range. While tools like VWAP or OBV provide volume trends, the "MR Volume Profile 5" indicator offers granular detail about where the most market activity occurs at specific price levels. This makes it a more precise tool for
Risk Control Tool
Israr Hussain Shah
Here   our more valuable tools SMC Trend Trading   ,  Easy SMC Trading  ,  Institutional SMC Architect Volume Analysis Tools  ,  Volume flow Profile  ,  Market volume profile  , FVG with Volume  , Liquidity Heatmap Profile  ,  Volume Spread Analysis Overview (Short Description) A professional risk management indicator that helps traders calculate lot size, risk percentage, and reward ratio in real time. Perfect for Forex, Indices, Gold, and Synthetic Indices traders who want precise control ov
Spike Blast Pro
Israr Hussain Shah
Here   our more valuable tools SMC Trend Trading   ,  Easy SMC Trading  ,  Institutional SMC Architect Volume Analysis Tools  ,  Volume flow Profile  ,  Market volume profile  , FVG with Volume  , Liquidity Heatmap Profile  ,  Volume Spread Analysis Spike Blaster Pro is a next-generation MT5 indicator designed specifically for synthetic markets. It works seamlessly on Boom Index and Weltrade Index , providing traders with sharp, reliable spike detection signals. What makes Spike Blaster Pro po
The indicator builds current quotes, which can be compared with historical ones and on this basis make a price movement forecast. The indicator has a text field for quick navigation to the desired date. Options: Symbol - selection of the symbol that the indicator will display; SymbolPeriod - selection of the period from which the indicator will take data; IndicatorColor - indicator color; Inverse - true reverses quotes, false - original view; Next are the settings of the text field, in w
Was: $249  Now: $99   Market Profile defines a number of day types that can help the trader to determine market behaviour. A key feature is the Value Area, representing the range of price action where 70% of trading took place. Understanding the Value Area can give traders valuable insight into market direction and establish the higher odds trade. It is an excellent addition to any system you may be using. Inspired by Jim Dalton’s book “Mind Over Markets”, this indicator is designed to suit the
Blahtech Supply Demand MT5
Blahtech Limited
4.54 (13)
Was: $299  Now: $99  Supply Demand uses previous price action to identify potential imbalances between buyers and sellers. The key is to identify the better odds zones, not just the untouched ones. Blahtech Supply Demand indicator delivers functionality previously unavailable on any trading platform. This 4-in-1 indicator not only highlights the higher probability zones using a multi-criteria strength engine, but also combines it with multi-timeframe trend analysis, previously confirmed swings a
VOLUME PROFILE SAF-XII                            Professional Market Profile Analysis for MT5   (The Definitive Tool for Grid & Mean-Reversion Traders)         WHAT IS VOLUME PROFILE? Volume Profile is a professional institutional tool that displays trading activity at specific price levels, unlike traditional volume indicators that show volume over time. It reveals WHERE trading occurred, within your window of choice, helping identify:   • FAIR VALUE AREAS (VAH/VAL) - Price levels wh
Volume Profile Delta
Juan Eduardo Verdala
Volume Profile Delta — Indicator for MetaTrader 5 Volume Profile Delta is an indicator that displays the difference between buying volume and selling volume recorded on each bar, represented as a histogram at the bottom of the chart. What this indicator does On each bar it calculates the difference between the volume associated with upward movements and the volume associated with downward movements. The result is shown as a bar in the lower histogram, making it possible to observe whether buying
FREE
Intraday Session TPO: Precision Volume Profiling for Day Traders Stop trading blind during the most volatile hours of the day. Standard daily volume profiles blend everything together, masking the true areas of liquidity and institutional interest. The Intraday Session TPO is engineered specifically for session-to-session traders. It empowers you to isolate and profile specific time windows—like the London Open, the New York Killzone, or the Asian range—so you can see exactly where the volume is
VPO Profile MT5
Kyra Nickaline Watson-gordon
5 (2)
Definition : VPO is a Volume Price Opportunity. Instead of using bars or candles with an Open, High, Low, and Close price, each "bar" in a Market Profile is represented by horizontal bars against the price It is called Market Profile terminology. In other words volume-price-opportunity (VPO) profiles are histograms of how many volumes were traded at each price within the span of the profile. By using a VPO chart, you are able to analyze the amount of trading activity, based on volume, for each
VolumeProfile MT5
Robert Hess
4.14 (7)
Description: The Volume Profile displays detailed informations of historical trading activities at certain price levels (Market Profile). Locate the areas with the best prices in the market and get an advantage over other market participants. Features: Customizable Market Profile Shows the "fair" Value Area with 70% of all Volume Shows critical low volume zones Shows VPOC, VAL and VAH Points integrated resource management to reduce the load while working with multiple charts Works on all timefr
English Version Unlock the Power of Volume with Next-Generation Volume Profile This advanced Volume Profile indicator transforms your MetaTrader 5 chart into a powerful volume analysis tool. Unlike standard volume indicators that only show volume over time, this tool displays volume distribution across   price levels , allowing you to pinpoint exactly where the "big money" is trading. Why choose this indicator? Dynamic Price Bins:   Set your own precision (number of rows) to view volume clust
Volume Profile FREE — Multi-Session Heatmap (POC · VAH · VAL) See where trading activity actually occurs—not just where price moves. This indicator builds a clear, color-coded Volume Profile Heatmap directly on your chart and highlights the market's most important price levels: the Point of Control (POC) and the Value Area (VAH/VAL) , where price is most likely to react.
FREE
Delta Profile Volume
Teresinha Moraes Correia
Technical Description of the Indicator – Delta Profile for MetaTrader 5 The Delta Profile is an indicator developed for MetaTrader 5 focused on detailed analysis of volume flow within a defined range of candles. It organizes and displays information about the imbalance of positive volumes (associated with upward movements) and negative volumes (associated with downward movements) at different price levels. The result is a clear view of the chart points where the highest concentration of trades o
Here   our more valuable tools SMC Trend Trading   ,  Easy SMC Trading  ,  Institutional SMC Architect Volume Analysis Tools  ,  Volume flow Profile  ,  Market volume profile  , FVG with Volume  , Liquidity Heatmap Profile  ,  Volume Spread Analysis Short Description: Stop overloading your charts with dozens of indicators.   Bollinger Fibo  Pro   is a sophisticated, all-in-one trading system for MetaTrader 5 that merges two legendary concepts into a single, powerful tool. It enhances standard
This indicator allows you to enjoy the two most popular products for analyzing request volumes and market deals at a favorable price: Actual Depth of Market Chart Actual Tick Footprint Volume Chart This product combines the power of both indicators and is provided as a single file. The functionality of Actual COMBO Depth of Market AND Tick Volume Chart is fully identical to the original indicators. You will enjoy the power of these two products combined into the single super-indicator! Below is
The Advanced POC Fixed Range Volume Profile is an interactive Volume Profile indicator developed for MetaTrader 5. Its operating concept and smooth user experience were inspired by TradingView's well-known Fixed Range Volume Profile tool. The indicator allows you to manually select any region of the chart to analyze the volume distribution within that period. This makes it easier to identify areas of higher volume concentration, rejection zones, and price regions considered relevant by the marke
Binary Rise Fall
Israr Hussain Shah
Here   our more valuable tools SMC Trend Trading   ,  Easy SMC Trading  ,  Institutional SMC Architect Volume Analysis Tools  ,  Volume flow Profile  ,  Market volume profile  , FVG with Volume  , Liquidity Heatmap Profile  ,  Volume Spread Analysis The Fractals_Price indicator is a technical analysis tool that identifies fractal patterns on price charts. Fractals are recurring patterns that signal potential trend reversals or continuation points. This indicator marks both upward and downward
Here   our more valuable tools SMC Trend Trading   ,  Easy SMC Trading  ,  Institutional SMC Architect Volume Analysis Tools  ,  Volume flow Profile  ,  Market volume profile  , FVG with Volume  , Liquidity Heatmap Profile  ,  Volume Spread Analysis 1. Institutional Supply & Demand Zones Auto-Detection:   Automatically draws zones at valid pivot points. Smart Extension:   Zones extend into the future for easy visibility but automatically cut off when price breaks them. Mitigation Logic:   When
LevelsHunter Pro
Dmitrii Kovalevskii
LevelsHunter Pro – Professional Volume Profile with History Analysis What it is LevelsHunter Pro is a volume profile indicator that not only shows current POC, VAH and VAL levels but also allows you to   go back in time   and see where these levels were at the moment of any past trade. This is not a tool for guessing on the chart. It is for   cold analysis   of what has already happened. Why a trader needs this The problem:   Most indicators only show "here and now". You close a trade and want t
IMPORTANT NOTICE – LICENSE & ACTIVATION REQUIRED   Activation Instructions: Upon completing your purchase, please contact us immediately to receive your   license key, password, or activation details . Without these, the software will not function. We are here to ensure a seamless activation process and assist you with any questions. Multilingual Customization To enhance your trading experience, we offer full customization of the software in multiple languages. Our team can provide tra
Advanced Volume Profile Analysis Tool for MetaTrader 5 The Kecia Volume Profile Order Finder provides traders with volume profile analysis capabilities. This MT5 indicator combines volume profile visualization with statistical calculations to help identify potential trading opportunities and suggests entry, stop loss, and take profit levels based on market structure. Market Profile Visualization Transform your chart with customizable volume profile visualizations: Multiple visualization options
Buyers of this product also purchase
Neuro Poseidon MT5
Daria Rezueva
4.79 (53)
Neuro Poseidon is a new indicator by Daria Rezueva. It combines precise trading signals with adaptive TP/SL levels - creating best possible trades as a result! Message me and get  Neuro Poseidon Assistant  as a gift to automize your trading process! What makes it stand out? 1. Proven profitability on all assets and timeframes 2. Only confirmed BUY and SELL signals present on the chart 3. Adaptive TP & SL levels generated by the software for each trade 4. Easy to understand - suitable for al
The UZFX {SSS} Scalping Smart Signals v5.0 MT5  is a Non Repaint high-performance trading indicator designed for Scalpers, Day Traders, and Swing Traders who demand accurate, real-time signals in fast-moving markets. Developed by (UZFX-LABS), this indicator combines price action analysis, trend confirmation, and smart filtering to generate high-probability buy and sell signals, Warning Signals, and Trend Continuation Opportunities across all currency pairs and timeframes.  Stop second-guessing
Gem SIGNAL
Shengzu Zhong
5 (1)
GEM Signal Pro GEM Signal Pro is a trend-following indicator for MetaTrader 5, designed for traders who want clearer signals, more structured trade setups, and practical risk management directly on the chart. Instead of showing only a simple arrow, GEM Signal Pro helps present the full trade idea in a cleaner and more readable way. When conditions are confirmed, the indicator can display the entry price, stop loss, and take profit targets on the chart, helping traders review the setup more effic
Azimuth Pro
Ottaviano De Cicco
5 (7)
Azimuth Pro V2: Synthetic Fractal Structure and Confirmed Entries for MT5 Overview Azimuth Pro is a multi-level swing structure indicator by Merkava Labs . Four nested swing layers, swing-anchored VWAP, ABC pattern detection, three-timeframe structural filtering, and closed-bar confirmed entries — one chart, one workflow from micro-swings to macro-cycles. This is not a blind signal product. It is a structure-first workflow for traders who care about location, context, and timing. ️ Summer Sale
M1 Quantum MT5
Hamed Dehgani
4.27 (11)
Live Trading Signals Using M1 Quantum : Signal  (Trade executed automatically by the Quantum Trade Assistant , included free with this product.) Latest News : Version 1.64 has been released, All trades now have a Stop Loss placed behind the relevant Support/Resistance zones. The Smart Close function has also been improved to increase the EA’s performance in this version. Since August 9, the live signal has been running on Version 1.64. Price Plan: Current Price: $169 (Early Adopter Offer) Next
ICT PO3 (Power of 3) AMD Protocol Framework Indicator True Time & Structure Integration   |  Non-Repainting | Real-Time  | Multi-Asset  | MT4 Version Available Full Setup Guide & Strategy Playbook: https://www.mql5.com/en/blogs/post/768683 MT4 Version: https://www.mql5.com/en/market/product/171742 Indicator Overview The ICT PO3 AMD Protocol Framework is a complete structural overlay for MetaTrader 5 that maps the True Daily Cycle directly onto your lower-timeframe execution chart. It project
Precision Spike Detector
Francisco Mandomo Simbine
5 (2)
Precision Spike Detector V3 – Institutional-Grade AI Trading System Attention: The price increases by US$50 for every 10 purchases.  Final price: US$599 Precision Spike Detector V3   is a   state-of-the-art, institutional-grade market analysis system   for   MetaTrader 5 , designed to detect   high-probability market movements   in synthetic indices such as   Boom, Crash, GainX, and PainX . After purchase, send me a private message to receive the optimized configuration files,  the installation
Title:FX-AIEA Supply and Demand Zone Indicator (MT5) — Technical Overview Version: 2.51 | Platform: MetaTrader 5 Introduction Supply and demand zones are considered a core manifestation of institutional order flow, providing a more direct reflection of buying and selling pressure than traditional support/resistance levels. This indicator attempts to automate the identification of high-probability supply and demand zones using an adaptive ZigZag algorithm, reducing the subjectivity and time asso
KURAMA GOLD SIGNAL PRO (MT5) — 7-Layer Filter, Auto TP/SL, Quality Score & Signal History Save | Complete XAUUSD Trading System No repaint in real time. The moment a signal appears, the arrow, entry, TP and SL are locked on the spot and never move afterward. What you trade is this real-time signal. And in v7.20, every signal that is actually sent is auto-saved and restored exactly after restart. BUYER BONUS Buy the lifetime license and receive AI Zone Radar (
PrimeScalping
Temirlan Kdyrkhan
PrimeScalping is a powerful trading companion designed to generate high-probability entry signals with dynamic TP/SL/DP levels based on volatility. Built-in performance tracking shows win/loss stats, PP1/PP2 hits, and success rates — all updated live. Key Features: Buy/Sell signals with adaptive volatility bands Real-time TP/SL/DP levels based on ATR Built-in MA Filter with optional ATR/StdDev volatility Performance stats panel (Success, Profit/Loss, PP1/PP2) Alerts via popup, sound, push, or e
The Oracle Pro
Ottaviano De Cicco
5 (1)
The Oracle Pro: Synthetic Multi-Timeframe Bias Engine for MT5 ️ Summer Launch Offer — Get The Oracle Pro for USD 199 (early buyers). Price rises with traction; final price USD 399. The Oracle Pro is a premium multi-timeframe bias engine for MetaTrader 5, built for demanding and professional traders. It answers one question with discipline: what is the directional bias on each timeframe right now, how strong is it, and how much do the timeframes agree? Everything is computed on closed bars only
TrendMaestro5
Stefano Frisetti
note: this indicator is for METATRADER4, if you want the version for METATRADER5 this is the link:  https://www.mql5.com/it/market/product/108106 TRENDMAESTRO ver 2.5 TRENDMAESTRO recognizes a new TREND from the start, he never makes mistakes. The certainty of identifying a new TREND is priceless. DESCRIPTION TRENDMAESTRO identifies a new TREND in the bud, this indicator examines the volatility, volumes and momentum to identify the moment in which there is an explosion of one or more of these da
Quant Direction MT5
Georgios Kalomoiropoulos
Quant Direction is a 3 dimensional market analysis tool. It provides a purely objective, algorithmic view of the market by calculating exact percentage-based biases across multiple dimensions simultaneously. Developed utilizing advanced AI modeling tools and subjected to thorough testing, this algorithm is engineered to read the market with unique precision. It can analyze any currency pair or financial instrument available on your platform.  Quant Direction is the ideal tool whether you are a S
Smart Market Structure Toolkit
Garry James Goodchild
5 (1)
Smart Market Structure Pro by G-Labs — ICT and Smart Money Concepts toolkit with built-in multi-symbol scanner for MetaTrader 5. Break of structure, change of character, order blocks, fair value gaps, liquidity sweeps, premium and discount zones, ICT sessions, confluence scoring, AI trade ideas, and a traffic-light scanner across up to 30 pairs and four timeframes from one chart. Map SMC and ICT on the active chart while the built-in scanner monitors your full watchlist. Each cell shows BUY, S
Btmm state engine pro
Garry James Goodchild
5 (4)
BTMM State Engine Pro by G-Labs — Beat The Market Maker indicator for MetaTrader 5. Asian session range, London and New York kill zones, level progression (L1/L2/L3), peak formation detection (PFH/PFL), entry signals, and a multi-pair scanner from one chart. Stop scanning charts one pair at a time. The State Engine tracks the BTMM daily cycle automatically — Asian box, room boundaries, level blocks, peak formations, and filtered entries — while the scanner dashboard shows level, peak status, d
Ace Trend
Mikhail Sergeev
5 (3)
We present you a revolutionary indicator that changes the rules of the game in the world of trend trading. The indicator is designed to rethink performance and elevate your trading experience to unprecedented heights. Our indicator boasts a unique combination of advanced features that set it apart from its competitors. The advanced technology of "Real Pricing Factors" ensures unsurpassed stability even in the most difficult and volatile market conditions. Say goodbye to unstable patterns, broken
This indicator is an indicator for automatic wave analysis that is perfect for practical trading! Case... Note:   I am not used to the Western name for wave classification. Influenced by the naming habit of Chaos Theory (Chanzhongshuochan), I named the basic wave as   pen   , the secondary wave band as   segment   , and the segment with trend direction   as main trend segment   (this naming method will be used in future notes, let me tell you in advance), but the algorithm is not closely relate
TPA True Price Action indicator reveals the true price action of the market makers through 100% non-repainting signals strictly at the close of a candle! TPA shows entries and re-entries, every time the bulls are definitely stronger than the bears and vice versa. Not to confuse with red/green candles. The shift of power gets confirmed at the earliest stage and is ONE exit strategy of several. There are available now two free parts of the TPA User Guide for our customers. The first "The Basics"
SMC Sweep Fvg MT5
Daniil Sleptsov
5 (1)
SMC Sweep Fvg MT5 — see the market the way smart money does, right on your chart You know the feeling: price takes out your stop, turns around, and goes exactly where you expected. You were right about the direction. You were only wrong about the entry. This indicator exists to make that happen less often. It takes over the hardest part of the analysis — mapping the chart — and leaves you with what matters: the decision. What you see on the chart Market structure — real structural highs and
The Precision Index Oscillator (Pi-Osc) for MT5 by Roger Medcalf of Precision Trading Systems First of all, if you have any questions please contact me via my website which you can find by searching the above title. Version 2 has been carefully recoded to be super fast to load up on your chart and some other technical improvements have been incorporated to enhance experience. Pi-Osc was created to provide accurate trade timing signals designed to find   extreme     exhaustion points, the points
The Zone Trading Indicator is a technical analysis tool for MetaTrader 5 that automatically identifies and displays tradable price zones across multiple timeframes to assist with structured market analysis. The indicator plots Monthly, Weekly, Daily, and H4 tradable zones , allowing traders to view higher- and lower-timeframe price areas simultaneously. These zones are designed to support one-candle–based entry approaches by highlighting predefined areas where price interaction may be monitored.
SmartScalping
Temirlan Kdyrkhan
SmartScalping is a powerful trading companion designed to generate high-probability entry signals with dynamic TP/SL/DP levels based on volatility. Built-in performance tracking shows win/loss stats, PP1/PP2 hits, and success rates — all updated live. Key Features: Buy/Sell signals with adaptive volatility bands Real-time TP/SL/DP levels based on ATR Built-in MA Filter with optional ATR/StdDev volatility Performance stats panel (Success, Profit/Loss, PP1/PP2) Alerts via popup, sound, push, or e
ScalpPoint
Temirlan Kdyrkhan
ScalpPoint is a powerful trading companion designed to generate high-probability entry signals with dynamic TP/SL/DP levels based on volatility. Built-in performance tracking shows win/loss stats, PP1/PP2 hits, and success rates — all updated live. Key Features: Buy/Sell signals with adaptive volatility bands Real-time TP/SL/DP levels based on ATR Built-in MA Filter with optional ATR/StdDev volatility Performance stats panel (Success, Profit/Loss, PP1/PP2) Alerts via popup, sound, push, or emai
Boom & Crash & PainX & GainX Ultimate Spike Detector Trade Spikes With Confidence — Not Guesswork Catching spikes should be one of the most profitable strategies in synthetic markets. But for most traders, it becomes one of the most frustrating. You enter too early… price goes against you. You wait for a spike… it never comes. You finally catch one… but don’t know whether to hold or close. You make profit… then give it all back because there’s no exit plan. This is exactly the problem the Ultim
TrendProMaster
Temirlan Kdyrkhan
MasterTrend Indicator for MT5 A powerful trend-following and signal-evaluation tool MasterTrend   is a custom MT5 indicator that combines Moving Averages and ATR-based risk/reward logic to generate clear buy/sell signals. It visualizes dynamic SL/TP levels, evaluates past trade outcomes, and displays win/loss statistics in a clean on-chart panel. Key features include: Buy/Sell signals based on MA crossovers ATR-based SL/TP1/TP2/TP3 levels with visual lines and labels Signal outcome tracking wit
Spike detector Rider
Francisco Mandomo Simbine
5 (1)
Spike Detector Rider – Intelligent Trading in Volatile Markets Introduction The Spike Detector Rider  is an advanced system for MetaTrader 5 designed to detect explosive price movements in high-volatility assets such as synthetic indices and commodities. It combines volatility filters, trend analysis, and automated risk management to provide intelligent trade confirmations. After purchase, send me a private message to receive the optimized configuration files,  the installation manual and setup
The indicator highlights zones where interests are being declared then shows their accumulation zone. Transaction Speed works like an order book in big scale. This is the indicator for the biggest money. It's performance is exceptional. Whatever interest there is in the market you will see it. The Transaction Speed is a new concept indicator that shows where and when large orders accumulates on the market and benefits of this. It detects trend changes at very early stage. In Forex, volume is
KT Alpha Hunter Arrows MT5
KEENBASE SOFTWARE SOLUTIONS
Most arrow indicators give you a signal and leave you to figure out the rest. KT Alpha Hunter Arrows gives you the full trading plan. Every signal arrow prints with a full plan already drawn: entry line, stop-loss, four take-profit levels, and a live edge verdict telling you whether this symbol and time-frame is worth trading right now. An included Trade Manager EA handles the execution after you enter, so discipline stays intact when the market gets loud. Non-repaint. Closed-bar signals only. B
RelicusRoad Pro MT5
Relicus LLC
4.96 (24)
RelicusRoad Pro: Quantitative Market Operating System 70% OFF LIFETIME ACCESS (LIMITED TIME) - JOIN 2,000+ TRADERS Why do most traders fail even with "perfect" indicators? Because they trade Single Concepts in a vacuum. A signal without context is a gamble. To win consistently, you need CONFLUENCE . RelicusRoad Pro is not a simple arrow indicator. It is a complete Quantitative Market Ecosystem . It maps the "Fair Value Road" price travels on, distinguishing between random noise and true structur
More from author
Indicator for fast navigation through financial instruments. When you click on the button, you go to the chart of the financial instrument, the name of which was written on the button. In other words, the indicator opens or unfolds an existing chart window. For each chart, you can customize the name of the financial instrument, text color and background color; in total, you can customize symbols buttons that you trade often. The indicator can be installed on any charts for which you need to swit
FREE
Indicator for fast navigation through financial instruments. When you click on the button, you go to the chart of the financial instrument, the name of which was written on the button. In other words, the indicator opens or unfolds an existing chart window. For each chart, you can customize the name of the financial instrument, text color and background color; in total, you can customize symbols buttons that you trade often. The indicator can be installed on any charts for which you need to swit
FREE
This indicator labels swing highs and swing lows as well as the candle pattern that occurred at that precise point. The indicator can detect the following 6 candle patterns:   hammer ,  inverse   hammer ,   bullish engulfing ,   hanging man ,   shooting star   and   bearish engulfing . The notations HH, HL, LH, and LL you can see on the labels are defined as follows: HH : Higher high HL : Higher low LH : Lower high LL : Lower low Setting Length: Sensitivity of the swing high/low detection,
Lets dabble a bit into Elliot Waves. This is a simple indicator which tries to identify Wave 1 and 2 of Elliot Impulese Wave and then projects for Wave 3. Ratios are taken from below link: https://elliottwave-forecast.com/elliott-wave-theory/ - Section 3.1 Impulse Wave 2 is 50%, 61.8%, 76.4%, or 85.4% of wave 1 - used for identifying the pattern. Wave 3 is 161.8%, 200%, 261.8%, or 323.6% of wave 1-2 - used for setting the targets Important input parameters MaximumNumBars : To calculate back
Market Profile Heat indicator  — is a classic Market Profile implementation that can show the price density over time, outlining the most important price levels, value area, and control value of a given trading session. This indicator can be attached to timeframes between M1 and D1 and will show the Market Profile for daily, weekly, monthly, or even intraday sessions. Lower timeframes offer higher precision. Higher timeframes are recommended for better visibility. It is also possible to use a fr
This indicator labels swing highs and swing lows as well as the candle pattern that occurred at that precise point. The indicator can detect the following 6 candle patterns:   hammer ,  inverse   hammer ,   bullish engulfing ,   hanging man ,   shooting star   and   bearish engulfing . The notations HH, HL, LH, and LL you can see on the labels are defined as follows: HH : Higher high HL : Higher low LH : Lower high LL : Lower low Setting Length: Sensitivity of the swing high/low detection,
Lets dabble a bit into Elliot Waves. This is a simple indicator which tries to identify Wave 1 and 2 of Elliot Impulese Wave and then projects for Wave 3. Ratios are taken from below link:   https://elliottwave-forecast.com/elliott-wave-theory/   - Section 3.1 Impulse Wave 2 is 50%, 61.8%, 76.4%, or 85.4% of wave 1 - used for identifying the pattern. Wave 3 is 161.8%, 200%, 261.8%, or 323.6% of wave 1-2 - used for setting the targets Important input parameters MaximumNumBars : To calculate
Filter:
No reviews
Reply to review