 MetaTrader 5
 Experts
 Indicators
 Libraries
 Utilities
 Widgets
 Rules
Watch the Market tutorial videos on YouTube
How to buy а trading robot or an indicator
Run your EA on
virtual hosting
virtual hosting
Test аn indicator/trading robot before buying
Want to earn in the Market?
How to present a product for a sell-through
Free Technical Indicators for MetaTrader 5 - 21
 Signals from technical indicators play a crucial role in opening and closing deals on stock and Forex markets. The essence of indicators is a mathematical transformation of a financial symbol price aimed at forecasting future price changes.
Test technical indicators to better predict market behavior and profit from it.

The stocks of the US500 in one heat map, right on your MetaTrader 5 chart. JET Market Monitor US500 shows the stocks that make up the S&P 500 index as a heat map. Each box is a stock: its size follows the stock's weight in the index and its color follows the daily change (green up, red down, gray at 0.00%). The stocks are grouped into 11 sectors, so you can see at a glance which sectors are leading and which are lagging. It is an indicator only: it never opens, closes or changes orders . What yo
FREE

History Curtain — Test the Market, Not the History History Curtain is a MetaTrader 5 indicator that lets you hide the future part of the chart and reveal market history step by step, simulating real trading decision-making conditions. Simply place a special star anywhere on the chart, and all history to the right of it will be hidden. Use the left and right arrows to reveal or hide the chart one candle at a time. Key benefits: • Full control over history. You choose the point where testi
FREE

LTL Long Trend Locator v3.0 - Professional Trend Trading Indicator ( Trade with clarity. Follow the trend with confidence). The LTL Long Trend Locator helps traders find the best times to enter and exit the market by identifying strong, lasting trends. It gives clear signals when trends are starting and ending, helping you trade in the right direction at the right time. Whether you trade Forex, Gold, Indices, Commodities, or Cryptocurrencies, UZFX LTL provides a structured approach to trend-foll
FREE

This indicator finds Double Top and Double bottom Example : What is Double Top When price establishes a new high and then falls, then reverse to the same candle area of High then its considered a valid double top and vice versa for double bottom. 1. It plots and high and low on visible chart if ChartChange is set to true else it searches on new bar opening
2. If there is double top and double bottom found in visible chart window then it plots a line 3. It has options to customize text color, tex
FREE

Shows when the Bollinger Bands contract inside the Keltner Channel (squeeze on) together with a momentum histogram that points to the likely breakout direction. Key features Calculated on closed bars, values do not repaint Works on any symbol and timeframe All periods, levels and colours can be changed in the inputs Light on resources with a maximum bars setting Buffers available for use in your own Expert Advisors (iCustom) Buffers 0 Momentum, 1 Momentum colour, 2 Squeeze dots, 3 Dot colour (0
FREE

ICT market structure from any timeframe - HH, HL, LH, LL, every BOS and CHoCH, with alerts - and a table that measures how often price really followed each break on your chart. ICT Market Structure Honest Stats labels every swing high and low, draws each break of structure (BOS) and change of character (CHoCH), shows the levels the next break needs, alerts you the moment a new break forms, and measures on your chart's own history how often price went on in the break's direction compared with ran
FREE
MACD MultiTF Smooth is a professional quantitative analysis and trend-following indicator developed based on Alexander Elder's classic Triple Screen methodology. It elevates traditional MACD analysis by fully automating the combination of multiple timeframes into a single clean oscillator, normalized from 0 to 100 and smoothed by an Exponential Moving Average (EMA). Designed for both beginner traders and advanced operators alike, the indicator eliminates common market noise and filters out false
FREE

View the main Smart Money Concepts areas of interest directly on your chart and make decisions with greater clarity, agility, and context. The SMC Indicator identifies areas that may act as potential price reaction or reversal points, helping traders plan the entire trade: entry, stop-loss placement, trade management, and profit-taking. With these areas mapped out, you can look for better-positioned entries, define potentially tighter technical stops, assess the risk-to-reward ratio more effecti
FREE
The indicator analyzes the chart and identifies Doji candlesticks. Shows their appearance and signals the appearance of such a candle (if allowed in the parameters). Also, this indicator shows the strength of the reversal in the form of bars of different colors (the more green, the more likely the rise, the more red - the fall in price). The direction of the signal depends on the direction of the previous candles, as the Doji signals a reversal or correction. In the indicator settings, you can
FREE

======================================================== OFX DASHBOARD — MQL5 MARKET PRODUCT DESCRIPTION (formatting notes: **bold** = editor Bold button; lines starting with "•" = bullet-list button; UPPERCASE lines = section headings) ========================================================
SHORT TITLE (product name field): OFX Dashboard — All-Engine OrderFlow Cockpit for XAUUSD (Gold)
------------------------------------------------------- OVERVIEW --------------------------------------
FREE
Moving average indicator to work with the F12 Replay simulation and replay tool.
In this way, the F12 Replay tool now supports the moving average indicator.
F12 Replay: https://www.mql5.com/pt/market/product/38313
This is a product developed by Renato Fiche Junior and available to all MetaTrader 5 users!
Partners: "Águia Traders" team ( Eagle Traders ) by Larissa Sihle #aguiatraders #larissasihle
Input Parameters
Period Shift Method
FREE

KD HTF Candles projects transparent higher-timeframe candle bodies and wicks (e.g. M15/H1) directly onto your lower-timeframe chart, allowing you to view higher-timeframe candlestick patterns while trading a lower timeframe. Reviewing a higher-timeframe candle typically requires switching charts, which can interrupt focus on the execution timeframe. This tool displays the higher-timeframe candle directly on the lower-timeframe chart. Key Features Transparent HTF Overlay: Semi-transparent higher-
FREE
This indicator automatically draws vertical lines at your preferred times of the day and optionally adds a horizontal line based on the opening price at those moments. It is designed to help traders mark key events, such as market sessions, strategy-specific times, or custom time ranges. Features: Draws up to two customizable vertical lines each day. Option to add a horizontal line from the opening price of the selected time. Fully customizable line color, style, and width . Lightweight, fast, a
FREE

Fair Value Gap Fill Tracker finds Fair Value Gaps (FVG, also called imbalances) and draws them on the chart as colored zones. A Fair Value Gap is a three-candle pattern in which the wicks of the first and the third candle do not overlap, so the middle candle leaves an area of the chart that price moved through very quickly. The indicator marks this area, extends it to the right and follows what price does with it: the zone stays open until price fills it. Features Bullish gaps - the low of the t
FREE

Meridian Flow — Smart Money Structure Indicator for MT5 Meridian Flow is a MetaTrader 5 indicator built for traders who follow Smart Money Concepts (SMC) and ICT price action methodology. It automatically detects BOS (Break of Structure) and CHoCH (Change of Character) events on any symbol and timeframe, then plots a complete risk map — Entry, Stop Loss, TP1, TP2, and TP3 — for every signal, including historical ones. Signals fire only on confirmed, closed bars. No repainting. No guesswork.
MT5
FREE

Shadow Flare Indicator is a non-repainting trend & liquidity tool for MetaTrader 5. It runs a configurable moving-average baseline (HMA, EMA, SMA, or RMA) wrapped in an Average True Range envelope and produces a sticky trend state that only flips when price closes through the upper or lower band. The same trend engine drives an automatic supply/demand zone module that detects pivot highs and pivot lows, draws coloured boxes around them, and mitigates each zone the moment price closes through it.
FREE

The indicator shows buy and sell signals. Timeframe - any, currency pair - any. Parameters: alertsMessage - enable/disable the message window. alertsSound - enable/disable sound. Arrow Type - select arrow type. There are three simple ways to filter the indicator signals: Compare direction with the indicator from the older timeframe. Use standard MACD diagram. Use Parabolic indicator. Disclaimer of liability : You should also not forget about money management and stop loss . Trading Forex and oth
FREE
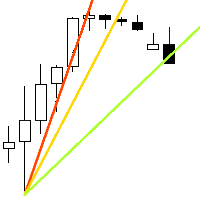
Speed resistance lines are a powerful tool for determining trend and resistance lines. The indicator builds lines using chart extremes and special mathematical formulas. The indicator can be used to determine the trend direction and pivot points.
<---------------------------->
Indicator Parameters:
"Depth of search" - depth (in bars) of the search for chart extremes "Back step of search" - minimum distance (in bars) between extremes "Deviation of price" - permissible price difference between
FREE

In many strategies, it's quite common to use a scaled ATR to help define a stop-loss, and it's not uncommon to use it for take-profit targets as well. While it's possible to use the built-in ATR indicator and manually calculate the offset value, it's not particularly intuitive or efficient, and has the potential for miscalculations.
Features Configurable ATR offset Upper and Lower Band. configurable ATR scaling factor alternate(non-chart) ATR timeframe explicitly defined input types to improv
FREE

RR Ratio KS Simple Calculator Indicator Overview The RR Ratio KS Simple Calculator Indicator is a free, lightweight tool for MetaTrader 5 that automatically visualizes risk-reward (RR) ratios on your chart. Designed for manual traders and automated systems (EAs), it detects open positions with defined stop-loss (SL) and take-profit (TP) levels, then overlays clear visual zones to show potential risk and reward areas, including precise dollar amounts. This helps traders quickly assess trade setup
FREE

Candle Time Phases Et Indicator - Split any candle into three time-based phases and control the sequential development of the candle in real time. Candle Time Phases is a precision timing indicator that divides the current candle into three time-based phases as a percentage of its total duration.
The indicator determines and clearly separates the initial uncertainty phase, the main movement, and the completion phase, while also analyzing the structure and sequential development of the candle in
FREE

LC Reference Level Structure Visualizer – Version 2.10 MetaTrader 5 (MT5) Market Structure Indicator – BOS, CHoCH, Break of Structure, Change of Character, Fair Value Gaps (FVG), Swing Highs/Lows and Multi-Timeframe Price Action Overview LC Reference Level Structure Visualizer is a multi-timeframe market structure and price action indicator for MetaTrader 5 (MT5) . It displays Break of Structure (BOS) , Change of Character (CHoCH) , confirmed swing highs and swing lows , and Fair Value Gap (FVG)
FREE
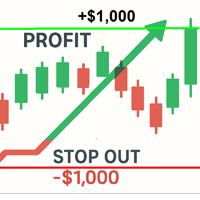
I s a professional visual radar for your trading account. The indicator calculates and displays the key mathematical levels of your open positions directly on the chart in real-time (fully accounting for commissions and swaps). No more blind spots or mental math: you will clearly see exactly where your desired profit will be reached and where the broker will forcefully close your account. Key Features Complete Margin Level Map: Automatic calculation and drawing of Margin Call, Stop Out, "Loc
FREE

SuperTrendNew 2.0 is a clean, non-repainting SuperTrend indicator for MetaTrader 5. It draws one trend line you can actually trade from, marks every reversal with an arrow, tells you about it by popup, sound and mobile push, and keeps a live dashboard on the chart with the trend state, the line price, the distance to the line in points and in ATR, and the age of the current trend. Free, no time limit, no ad banner on your chart. What is new in 2.0 Version 1.1 has been on the Market since January
FREE

This is a free product , feel free to use it for your needs! If you like this indicator, please leave a short positive review ! Thanks a lot!
Click here to see high quality Trading Robots and Indicators! Forex Spread Display for MT5 is a great auxiliary trading tool . It shows the current spread of the currency pair right on your chart. Y ou can easily place the display in any corner of the chart, as well as customize its color and font size . This is an original product available exclusively
FREE

AI Fair Value Gap Finder automatically detects and highlights Fair Value Gaps (FVG) - the price imbalances left behind when a candle's range fails to overlap with candles two bars away. These gaps are a core concept in smart-money and institutional order-flow trading, often acting as magnets that price returns to fill. The indicator scans every new bar for bullish and bearish imbalances, draws a shaded rectangle over each gap, and can automatically change or remove the zone once price has filled
FREE

UT Bot MTF is an ATR trailing stop and the flip signals it produces. The stop follows price at a distance of a chosen multiple of ATR, ratchets in the direction of the move and never gives ground back. When price closes through it, the stop flips to the other side and the indicator marks a BUY or a SELL. That is the whole engine, and it is deliberately simple. What this product adds around it is the part that decides whether you can actually use it: four independent filters, an honest account of
FREE

MSM Daily Bias Liquidity Target is an indicator for MetaTrader 5 that shows the direction the day leans to and the nearest liquidity level price may move toward. It reads the previous day and week, the daily structure and the daily range, then shows BULLISH, BEARISH or UNCLEAR in a small panel and draws the liquidity target on the chart. It does not open trades. You decide if and when to trade. Daily bias score Previous day candle (weight 2): a close above the prior day high counts bullish. Taki
FREE

SMC Donchian Suite The SMC Donchian Suite for MetaTrader 5 is a comprehensive, all-in-one indicator that combines the power of Donchian Channels, Anchored VWAP, and Visible Range Volume Profile (VRVP) to provide a complete and actionable view of the market. It's designed for traders who want to understand market structure, volume, and momentum in a single, integrated tool. Key Features: Multi-faceted Market Analysis: The indicator integrates three powerful analytical tools: Donchian Channels: T
FREE

VOLATILITY AGGRESSION FLOWMATRIX
Volatility Aggression FlowMatrix is a market analysis indicator developed for MetaTrader 5 . It transforms internal measurements of volatility, directional flow and market pressure into synthetic Flow Candles , providing a structured visual representation of market behavior. The calculation model evaluates price displacement, candle efficiency, closing position, relative volatility and directional pressure . It also includes internal analysis of Delta, Cumulativ
FREE

Institutional SMC and Confluence Engine (MTF Scanner) The Institutional SMC and Confluence Engine is a professional grade Smart Money Concepts indicator for MetaTrader 5. Engineered for high frequency dynamic structure mapping, it automatically identifies, scores, and filters institutional Supply and Demand zones while monitoring multiple assets and timeframes through an interactive scanner dashboard. Key Operational Features Automated Supply and Demand Detection Institutional Pivot Radius Engin
FREE

ICT Premium Discount Ote Tjmas is a FREE institutional MetaTrader 5 indicator that automatically maps Multi-Timeframe Dealing Ranges (100% Premium, 50% Equilibrium EQ, 0% Discount) and the Optimal Trade Entry (OTE 0.62 - 0.705 - 0.79) zone with clean Right-Margin Brackets ']'. Built 100% natively in MQL5 with zero lag for Index Futures/CFDs (US100/NQ, US500/ES, US30/YM), Gold (XAUUSD), Crypto (BTCUSD), and Forex. KEY INSTITUTIONAL FEATURES: 1. Multi-Timeframe Dealing Range (100% Premium / 50% EQ
FREE

clock, Server Time, Local Time, MT5 Clock, Clock Indicator, Digital Clock
DualClockPro - Local and Server Clock for MetaTrader 5 DualClockPro is a visual clock indicator for MetaTrader 5 that displays local computer time and trading server time directly on the chart. It also supports displaying the corresponding dates, helping traders monitor time differences between their local environment and the broker's server. The panel has a compact design and customizable settings, allowing users to ada
FREE
This indicator is the mql version of the Linear Regression Candles indicator. There are many linear regression indicators out there, most of them draw lines or channels, but this one actually draws a chart.This script includes features such as linear regression for open, high, low, and close prices, signal smoothing with simple or exponential moving averages. Find out more here: https://www.mql5.com/en/users/rashedsamir/seller I welcome your suggestion for improving the indicator
To incre
FREE

Auto Candle Sequence Counter – MT5 Indicator Overview
Auto Candle Sequence Counter is a professional MetaTrader 5 indicator that automatically detects and highlights consecutive bullish and bearish candle sequences. Instead of manually counting candles, the tool provides real-time visualization, alerts, and statistics to support price action trading strategies. It is designed for professional traders who want a clean and efficient way to confirm momentum, identify exhaustion points, and integra
FREE

SMC Blue Shadow Signals SMC Blue Shadow Signals is an all-in-one technical analysis suite engineered for traders utilizing Smart Money Concepts (SMC). The indicator automates the identification of market structure, liquidity zones, and institutional order flow, providing a comprehensive visual framework for multi-timeframe market analysis. Technical Features 1. Advanced Market Structure Mapping The indicator utilizes automated structural logic to map price action in real-time: Break of Structure
FREE

Indicator name : Impulse Factor 2.14/2.6. Category: Indicators / Technical analysis / Trading panels Brief description A semi‑automatic professional tool for marking correction zones based on the author’s mathematical coefficients 2.14 and 2.6. The indicator instantly calculates the exact potential of the impulse wave, builds a target zone, sets Take Profit/Stop Loss levels, and automatically calculates the recommended lot for entry based on your balance and risk! Full description Impulse Fa
FREE

QCL Market Structure Zones is a chart-based analytical indicator for identifying confirmed swing points, supply and demand zones, and breaks of market structure. The indicator uses confirmed swing highs and swing lows to create volatility-adjusted zones. Zone height and overlap filtering are calculated using the Average True Range, allowing the indicator to adapt to different symbols and timeframes. Main features Confirmed swing high and swing low detection Automatic supply and demand zones Aver
FREE
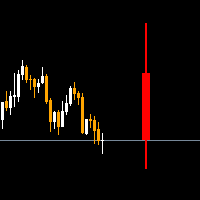
The Higher timeframe candle tracker is used to get a glimpse of what the selected higher time frame candle is like. It plot the candle after the current price. It can come in handy for day traders and short term traders that often worry about how the current higher timeframe candle may look like. You can select the higher time frame or lower time frame from the options provided: By default the color for bears is red and for bulls is green. You are able to change the width of the candle, its wick
FREE

Master HMA for MetaTrader 5 Master HMA is a technical indicator for MetaTrader 5 that combines different Hull Moving Average calculations into a visual structure designed to analyze price direction, slope, and movement behavior. The indicator uses three HMA periods: Fast, Main, and Slow. The relationship between these lines helps identify changes in the movement structure and follow different market phases. The Main HMA uses different colors to represent the states identified by the system. The
FREE

Stop entering trend flips that have no momentum behind them. One line, one chart, no second indicator. No repaint.
Any pair, any market, any timeframe. On your chart in 2 minutes. Free to test in the Strategy Tester.
Get more indicators here
Baselines, volatility filters and oscillators. No repaint.
Why you need it You enter because the line turned green. Price drifts for ten bars, then reverses. The signal was real, but the momentum was not. Every entry on a weak flip costs you a stop loss.
FREE

GDXM Period Open Line The GDXM Period Open Line is a powerful institutional tool designed for traders who follow ICT concepts , SMC (Smart Money Concepts) , or price action strategies that rely on time-based price levels. In institutional trading, the opening price of a specific period (Yearly, Monthly, Weekly, or Daily) serves as the "Equilibrium" point. Trading above the opening price is considered a premium (seek shorts), and trading below is considered a discount (seek longs). This indicator
FREE

Custom Candle – Multi-Timeframe Visualization Analyzing multiple timeframes is essential for accurate trading decisions, but switching between charts can be inconvenient and inefficient. The Custom Candle indicator solves this problem by overlaying higher-timeframe (HTF) candles directly onto your lower-timeframe (LTF) chart. This allows you to see the bigger picture at a glance, align with the higher trend, and improve trade accuracy—without leaving your current chart. Key Features: Multi-Timef
FREE

Welcome to HiperCube Renko Candles Discount code for 25% off at Darwinex Zero: DWZ2328770MGM This indicator provide you a real info of market transform it to Renko Candle Style. Definition Renko charts are a type of financial chart that measures and plots price changes, using bricks (or bars) to represent price movements . Unlike traditional candlestick charts, Renko charts do not display time-based information, focusing solely on price fluctuations. Features: Indicator in separate windows
FREE

This is an MQL5 custom indicator for MetaTrader 5 called "Swing Highs and Lows Detector"
What it does
The indicator identifies and labels **market structure swing points** on a price chart:
HH (Higher High) – A new swing high that's higher than the previous swing high (bullish signal, colored lime green) HL (Higher Low) – A new swing low that's higher than the previous swing low (bullish signal, colored lime green) LH (Lower High) – A new swing high that's lower than the previous swing hig
FREE

Deep Momentum Analyzer is an AI-powered trend detection indicator that visualizes market momentum through an intuitive histogram display, helping traders identify bullish and bearish market conditions with precision and clarity. Overview The Deep Momentum Analyzer transforms complex market data into clear, actionable trading signals using advanced analytical algorithms. This professional-grade indicator gives traders instant visual feedback on market momentum shifts, making it easier to time ent
FREE

AI Round Number Psychological Levels Indicator automatically plots the "00" and "50" round-number price levels around current price - the same psychological price zones where institutional orders, stop clusters, and retail reactions consistently pile up, on every symbol and every timeframe. KEY FEATURES
- Automatically calculates and draws round-number levels above and below the current price based on a configurable step distance (in points), adapting to any symbol's price scale.
- Distinguishes
FREE

This indicator is based on the famous fractal indicator but with much customization and flexibility ,
this is a powerful tool for identifying trend reversals and maximizing your profit potential.
With its advanced features and user-friendly interface, it's the ultimate choice for traders of all levels. MT4 Version : Ultimate Fractals MT4 Features :
Customizable Fractal Candle count. Reversal Lines. Customizable Settings. User-Friendly Interface. Main Parameters: Candles On Left - number
FREE

Market Structure Highs and Lows Overview:
Market Structure Highs and Lows is a professional indicator that automatically detects and visualizes key price structure points — Higher Highs (HH), Higher Lows (HL), Lower Highs (LH), and Lower Lows (LL). It helps traders clearly see trend direction, reversals, and market flow through a clean ZigZag structure. How it works:
The indicator analyzes swing points using a ZigZag algorithm to define structural highs and lows. Uptrend: Sequence of HH and H
FREE
Like most things that work in trading, it's really simple. However, it's one of the most powerful tools I have that makes entries of many systems much more precise.
In its essence, it measures the recent volatility against the medium-term average. How does it work? Markets tend to be prone to strong trending movements when relative volatility is low and tend to be mean-reverting when relative volatility is high.
It can be used with both mean-reversion systems (like the Golden Pickaxe) and mo
FREE

General Description The Fair Gap Value Indicator identifies and highlights “fair value gaps” on the MetaTrader 5 chart. A fair gap occurs when a price void forms between the low of one bar and the high of another, separated by an intermediate bar. The indicator draws colored rectangles (bullish and bearish) to emphasize these areas, providing clear visual support for price-action strategies. Key Features Bullish Gap Detection : highlights gaps between a bar’s low and the high of two bars prior w
FREE

DoubleRSI — Dual RSI Crossover Indicator with Signal Filters Description DoubleRSI displays two RSI lines with configurable periods on a separate window and generates buy/sell signals based on crossovers between the two RSI lines within defined price zones. How it works A buy signal is generated when the short RSI crosses above the long RSI while the long RSI is within the configured buy zone (default 50-70). A sell signal is generated when the short RSI crosses below the long RSI while the long
FREE
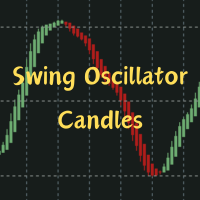
Description:
Heikin-Ashi-like swing oscillator candles. It can be used in the same way as RSI or Stochastic.
For example: Zero crossing. Above the zero line is bullish, below the zero line is bearish.
Overbought or oversold. 100 line is the extreme bought level, -100 line is the extreme sold level.
Divergences.
Time frame: Any time frame.
Instrument: Any instrument.
FREE
DRX SPREAD MONITOR is a professional utility designed to visualize and analyze broker spreads in real-time. It helps traders identify hidden costs caused by spread widening during news events, rollovers, or low liquidity sessions. This tool is essential for Scalpers and Gold traders who need to ensure execution quality and avoid entering trades when trading costs are statistically too high. Key Features Real-Time Histogram: Displays the spread history in a separate window with color-coding for N
FREE

Two moving averages, clean cross arrows and alerts so you never miss a crossover. How it works Choose the period and method (SMA, EMA, SMMA, LWMA) of the fast and slow moving average and the applied price. Arrows are drawn only on closed bars, so they do not repaint. An optional trend moving average and a minimum gap filter remove weak crosses. Alerts can be sent as popup, sound, push notification or email. Key features Fast and slow MA with any method and price Non-repainting cross arrows Optio
FREE

Volume Weighted Average Price is used by financial institutions to place large trades at what is considered the fair value for the session. Standard deviation channels around VWAP provide potential entry points for mean reversion or breakout strategies, and the VWAP itself can act as a high quality exit level. If you've heard that volume-based analysis doesn't work for forex and CFDs, try looking at VWAP with standard deviation bands on a chart, and note the frequency with which price reacts to
FREE

Stochastic indicator alerts when EA Available in comments , must have indicator installed buys stochastic main line is above signal line stochastic is below 30 rsi 5 is below 20 sell stochastic main line is below signal line stochastic is above 70 rsi 5 is above 80 ADD to chart Stochastic k 30 - d 9 - slowing 3, levels 30/70 rsi 5 lelels 20.80
Full alerts push, mobile , email ect All input settings variable feel free to contact for more information or alert sugestions
FREE

Stochastic MTF Dashboard The Stochastic MTF Dashboard is a high-performance visual solution designed for efficiency. It allows you to monitor the status of the Stochastic Oscillator across up to 6 different timeframes simultaneously , all without ever leaving your current chart. Its goal is to eliminate confusion and provide an instant reading of market strength: Red: Overbought Zone – Possible price exhaustion (Potential Sell). Green: Oversold Zone – Possible price recovery (Potential Buy). Gra
FREE

Description:
Ultimate RR Toolkit is a professional risk -to-reward (R:R) visualization and position sizing tool for MetaTrader 5. It allows traders to plan trades directly on the chart with full control over entry, stop loss, and take profit levels while automatically calculating lot size, pip distance, and risk-to-reward ratio based on a predefined risk amount. This tool is designed for traders who value precision and clarity in trade planning. It provides an interactive on-chart interface wit
FREE

Full description PhuongJ-SessionVWAP is a standalone MetaTrader 5 indicator that turns the session-VWAP and session-volume-profile overlay of the FVG_AutoBot into a reusable tool. It tracks the four reference sessions used by the bot — Sydney, Asia, London and New York — on the Vietnam clock (UTC+7) and follows the DST rules of Sydney, London and New York automatically. For every session the indicator draws a cumulative VWAP line in the session colour and, when enabled, a volume profile built fr
FREE

Supertrend Master — Multi-Timeframe Supertrend Indicator
A clean, visual Supertrend indicator for MetaTrader 5 with a multi-timeframe dashboard.
The chart displays a clear Supertrend line with colored candles and directional arrows on trend changes — designed to be readable at a glance.
A compact HUD shows the current Bull / Bear direction across 7 timeframes simultaneously:
M5 | M15 | M30 | H1 | H4 | D1 | W1
No need to switch charts. See the full market picture in one view. The HUD c
FREE

Mapa płynności KREDZIA organizuje aktywną płynność opartą na brokerach powyżej i poniżej ceny, pomagając inwestorom planować potencjalne cele płynności i monitorować obszary, w których może rozwinąć się zmiatanie, reakcja lub odwrócenie.
PEŁNY OPIS Ważne maksima i minima mogą stanowić potencjalne cele w zakresie wykorzystania płynności, ale ręczne śledzenie bieżących poziomów wraz ze starszymi, niesprawdzonymi odniesieniami szybko staje się trudne. Mapa płynności KREDZIA tworzy ustrukturyzowa
FREE
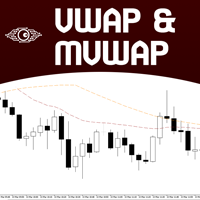
Volume Weighted Average Price (VWAP) is a trading benchmark commonly used by Big Players that gives the average price a Symbol has traded throughout the day. It is based on both Volume and price. Additionally we put in this indicator the MVWAP (Moving Volume Weighted Average Price). For those who do not know the usage and the importance od this indicator I recommend a great article about this subject at Investopedia ( https://www.investopedia.com/articles/trading/11/trading-with-vwap-mvwap.asp )
FREE

No Wick Candle Scanner is a powerful, lightweight tool built for MetaTrader 5 designed to isolate pure market momentum. In trading, candles that close without an upper or lower tail (wick) represent absolute dominance by buyers or sellers. This indicator scans your charts in real-time, instantly flagging these high-probability momentum bars with clean visual markers, allowing you to catch strong trend continuations and sudden breakouts with ease. Key Advantages & Features: 6-in-1 Filtering Matr
FREE
Koryu Delta Koryu Delta is a MetaTrader 5 indicator. It identifies trend reversal points using pivot point analysis and delta volume data. It detects Market Shift patterns and shows signals based on market dynamics. This tool can be used by traders who scalp, swing trade, or invest long-term. It analyzes up to 500 historical bars to find past patterns. It uses closed-bar logic for signals. Features of Koryu Delta Pattern Detection : It identifies bullish and bearish Market Shift patterns using
FREE

ATR Trend Channel — Adaptive ATR-Based Trend Channel Indicator For MetaTrader 5 · Main chart window indicator Overview ATR Trend Channel is an adaptive trend channel indicator drawn directly on the price chart. It builds an upper band and a lower band around the median price of each bar, using ATR (Average True Range) as the scaling unit. Unlike a regular moving-average channel, this channel does not slide smoothly from bar to bar. It stays anchored to a specific bar and is re-anchored — and
FREE

ABC Fib Extension — 自动 A-B-C 斐波那契扩展 产品概述 ABC Fib Extension 是 MetaTrader 5 图表指标。它自动监测价格摆动结构,标注通过内置过滤条件的结构的 A、B、C 三个点,并从 C 点出发绘制斐波那契扩展位。所有比例、颜色、线型与标签均可自定义。 同时可显示两个更高周期图层:当图表层的扩展位与更高周期的扩展位彼此靠近时,指标会把这段共同的价格区间标注为共振区。 本指标只做图表分析,不下单、不改单、不平仓,不是交易机器人。 指标画什么 A、B、C 三个结构点 ,带可选标签;C 点标签显示回撤幅度,鼠标悬停可看到简短说明。 最多七条扩展位 ,从 C 点起算,每条都有独立的开关、比例与颜色。 高亮价格带 :在选定的两个比例之间填充半透明色块,用于标记关注区间。 A-B 与 B-C 两条腿线 (点线),让结构来源保持可读。 历史结构 :最多保留五个此前的结构,以弱化颜色显示。 共振区 :图表层与更高周期图层扩展位重合的区间,最多同时显示六个。 右边缘价格标签 (可选):在图表右侧标出每条可见扩展位的价格。 结构状态 每个结构会在以下几
FREE

Idea extracted from the books by Anna Coulling and Gavin Holmes using Volume and Spread Analysis (VSA) techniques coupled with Al Brooks' expertise with Price Action these candles are magical, identify the exact moment
of the performance of the big players are acting in the market represented by the colors:
1) Red Candles we have an Ultra High activity,
2) Candles Orange we have a Very High Activity
3) Candles Yellow we have one High Activity
4) White Candles represent normal activity in
FREE

RelicusRoad Trading Sessions is a trading sessions indicator for MetaTrader 4 and MetaTrader 5 that marks the opening time of the Tokyo, London and New York sessions with dotted vertical lines on M1, M5 and M15 charts. Each session open is shown as a line, a small rotated name label and an event marker in the session's color, for the current day and the previous weekdays. Hovering over one shows the session name and its opening time. The indicator marks opens only: it does not shade session rang
FREE

SAR Colored Indicator with Alarm – Enhance Your Trading Strategy Are you tired of constantly monitoring charts for trend reversals? Introducing the SAR Colored Indicator with Alarm – a powerful, user-friendly tool designed to transform the classic Parabolic SAR (Stop and Reverse) into a dynamic, visually intuitive, and alert-driven system. Perfect for traders of all levels, this indicator is now available in the MQL Market and ready to elevate your trading experience.
What is the SAR Colored In
FREE
The MetaTrader Market is the best place to sell trading robots and technical indicators.
You only need to develop an application for the MetaTrader platform with an attractive design and a good description. We will explain you how to publish your product on the Market to offer it to millions of MetaTrader users.

You are missing trading opportunities:
- Free trading apps
- Over 8,000 signals for copying
- Economic news for exploring financial markets
Registration
Log in
You agree to website policy and terms of use
If you do not have an account, please register