Wick Map
- Indicators
-
Anna Makwana
 MetaTrader tools and indicators that measure the odds on your own chart: how often levels were reached, how far days and sessions usually run, and what followed past signals. Every figure comes from the symbol’s own price history and uses closed bars only, so nothing repaints. Questions are welcome
- Version: 1.0
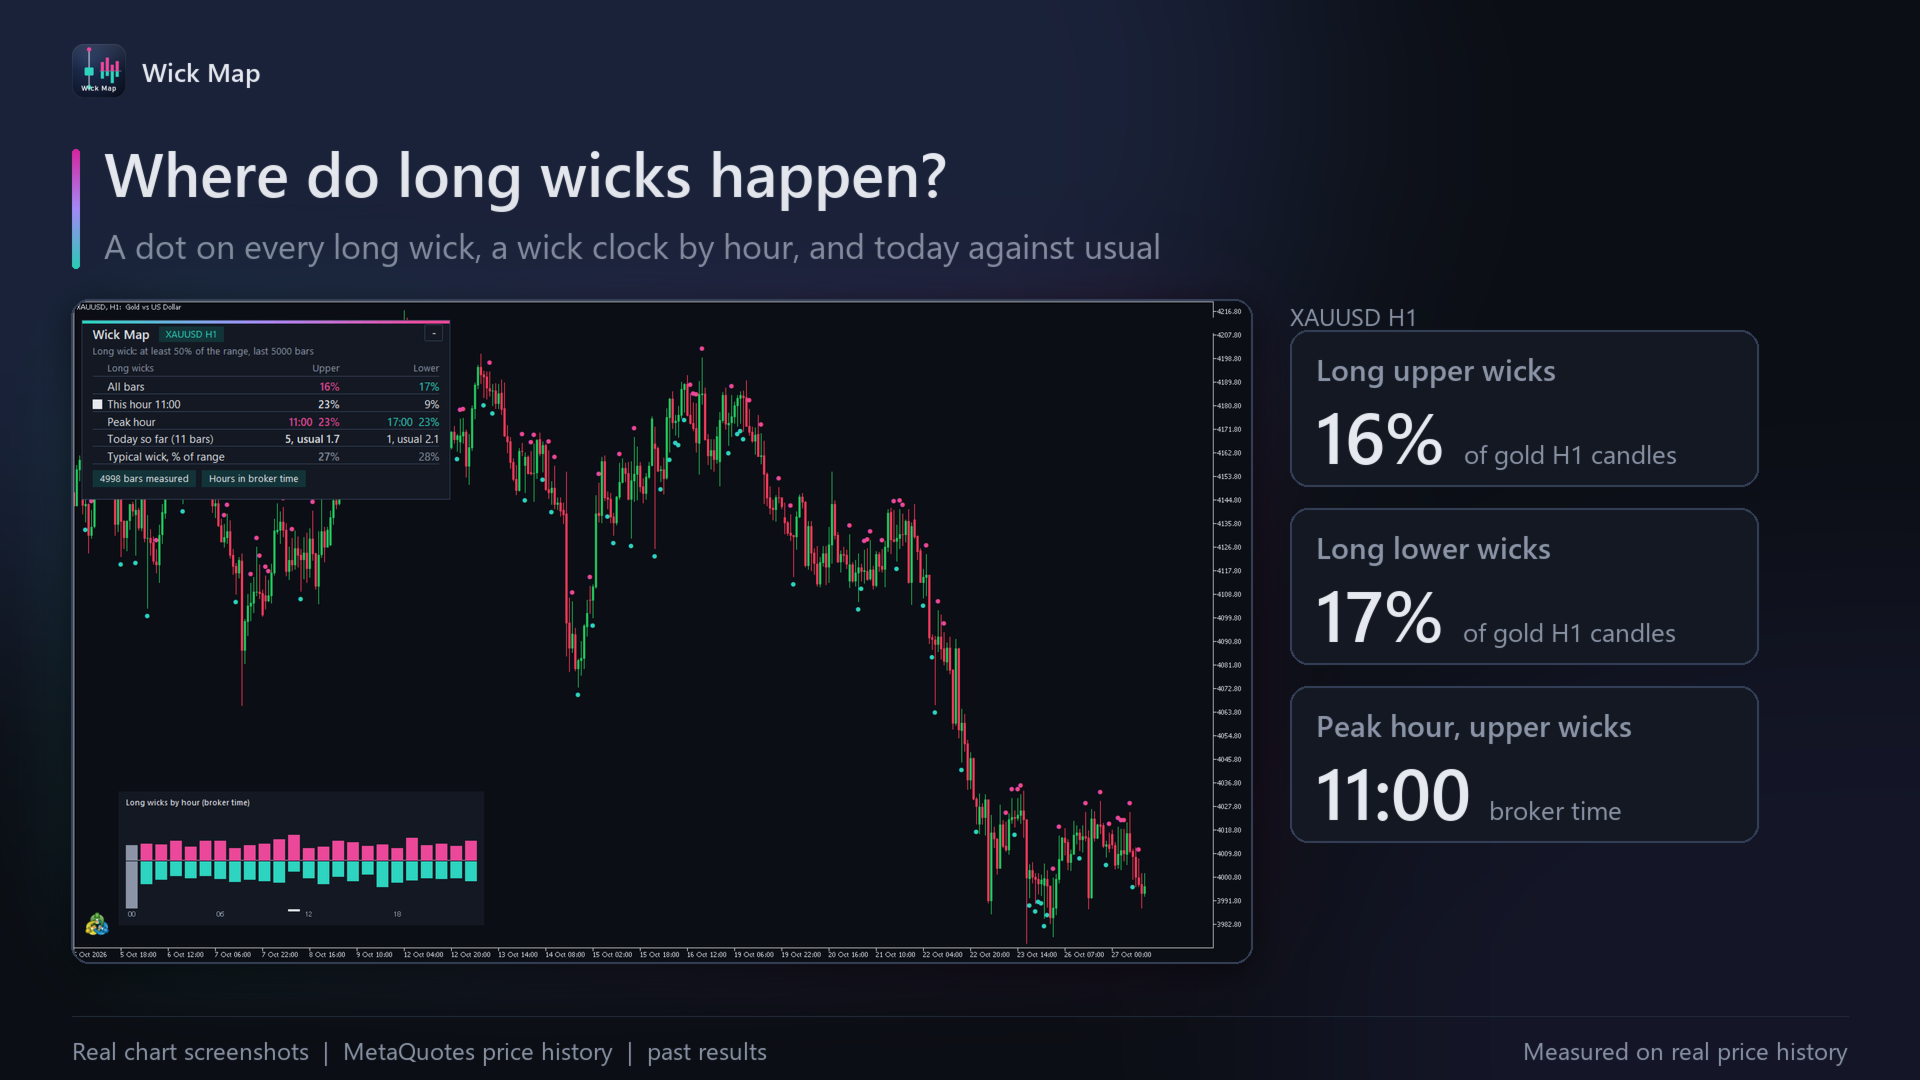
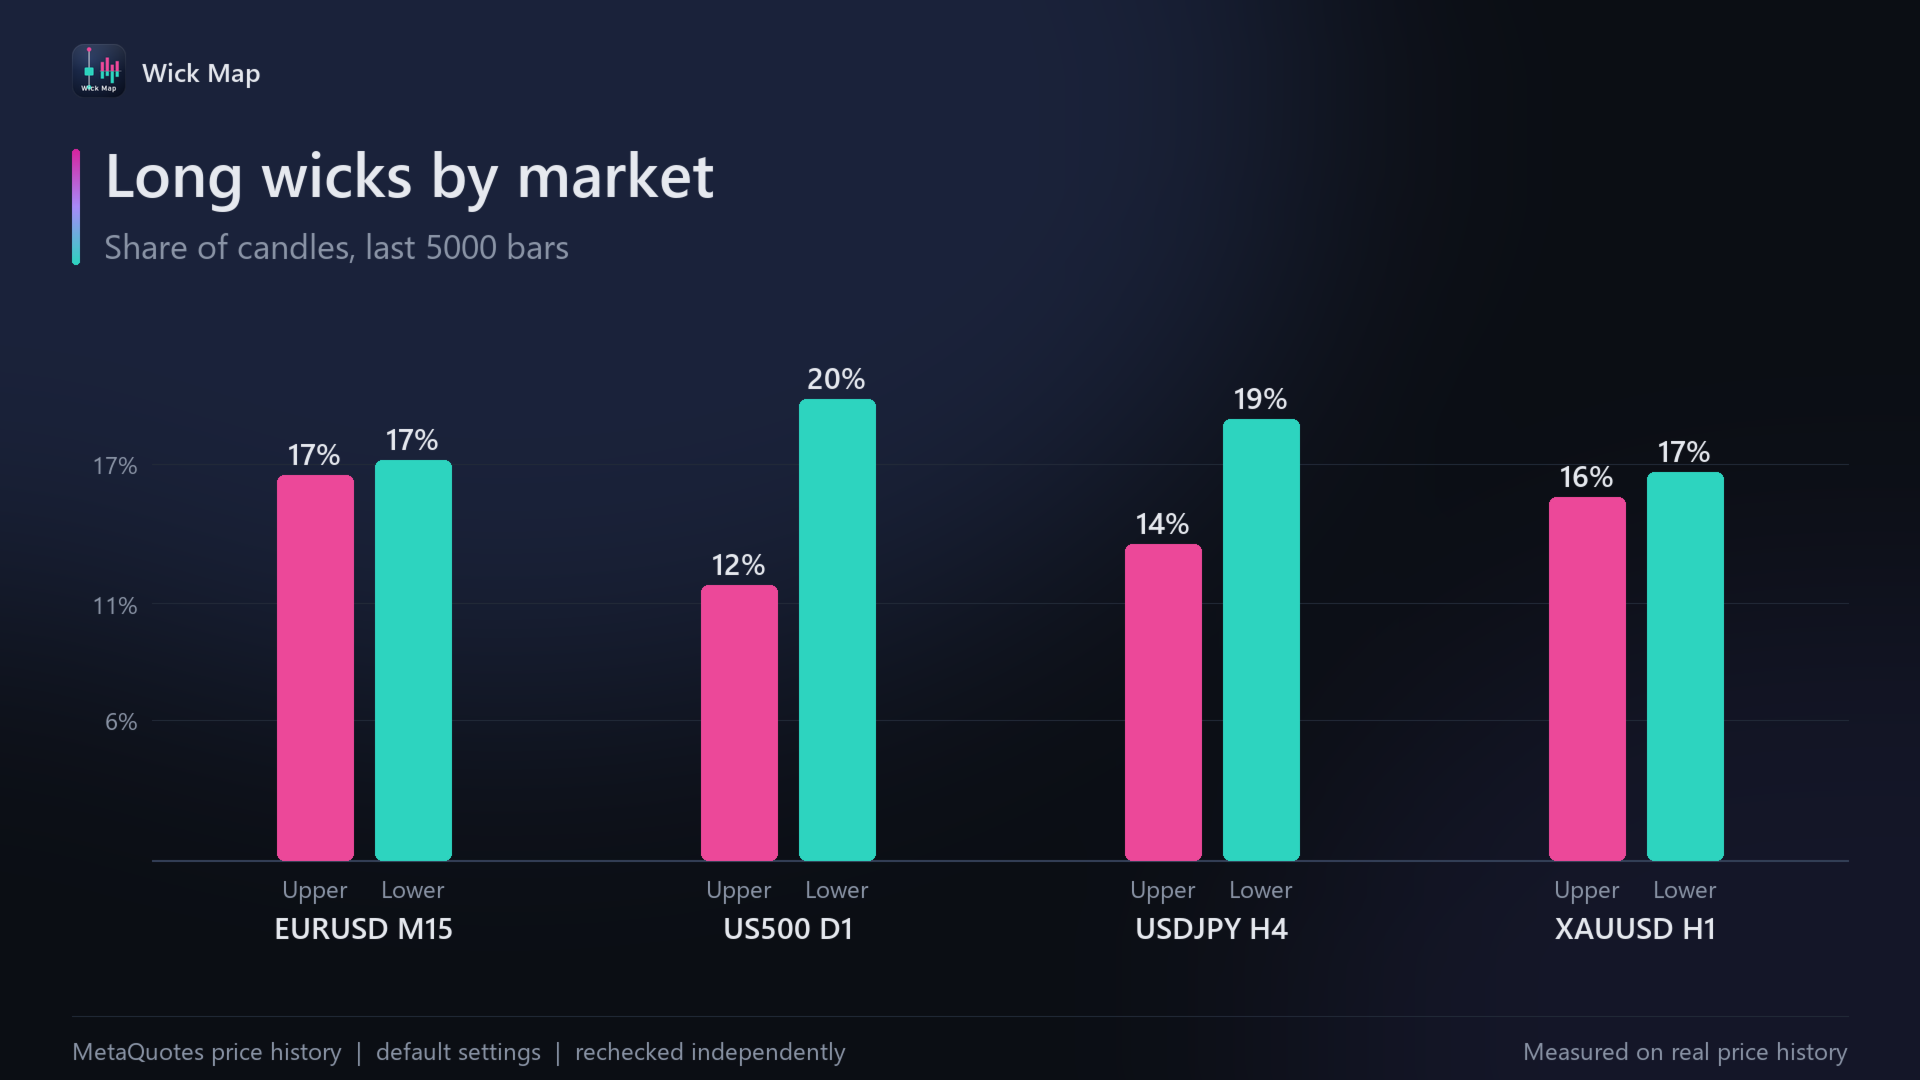
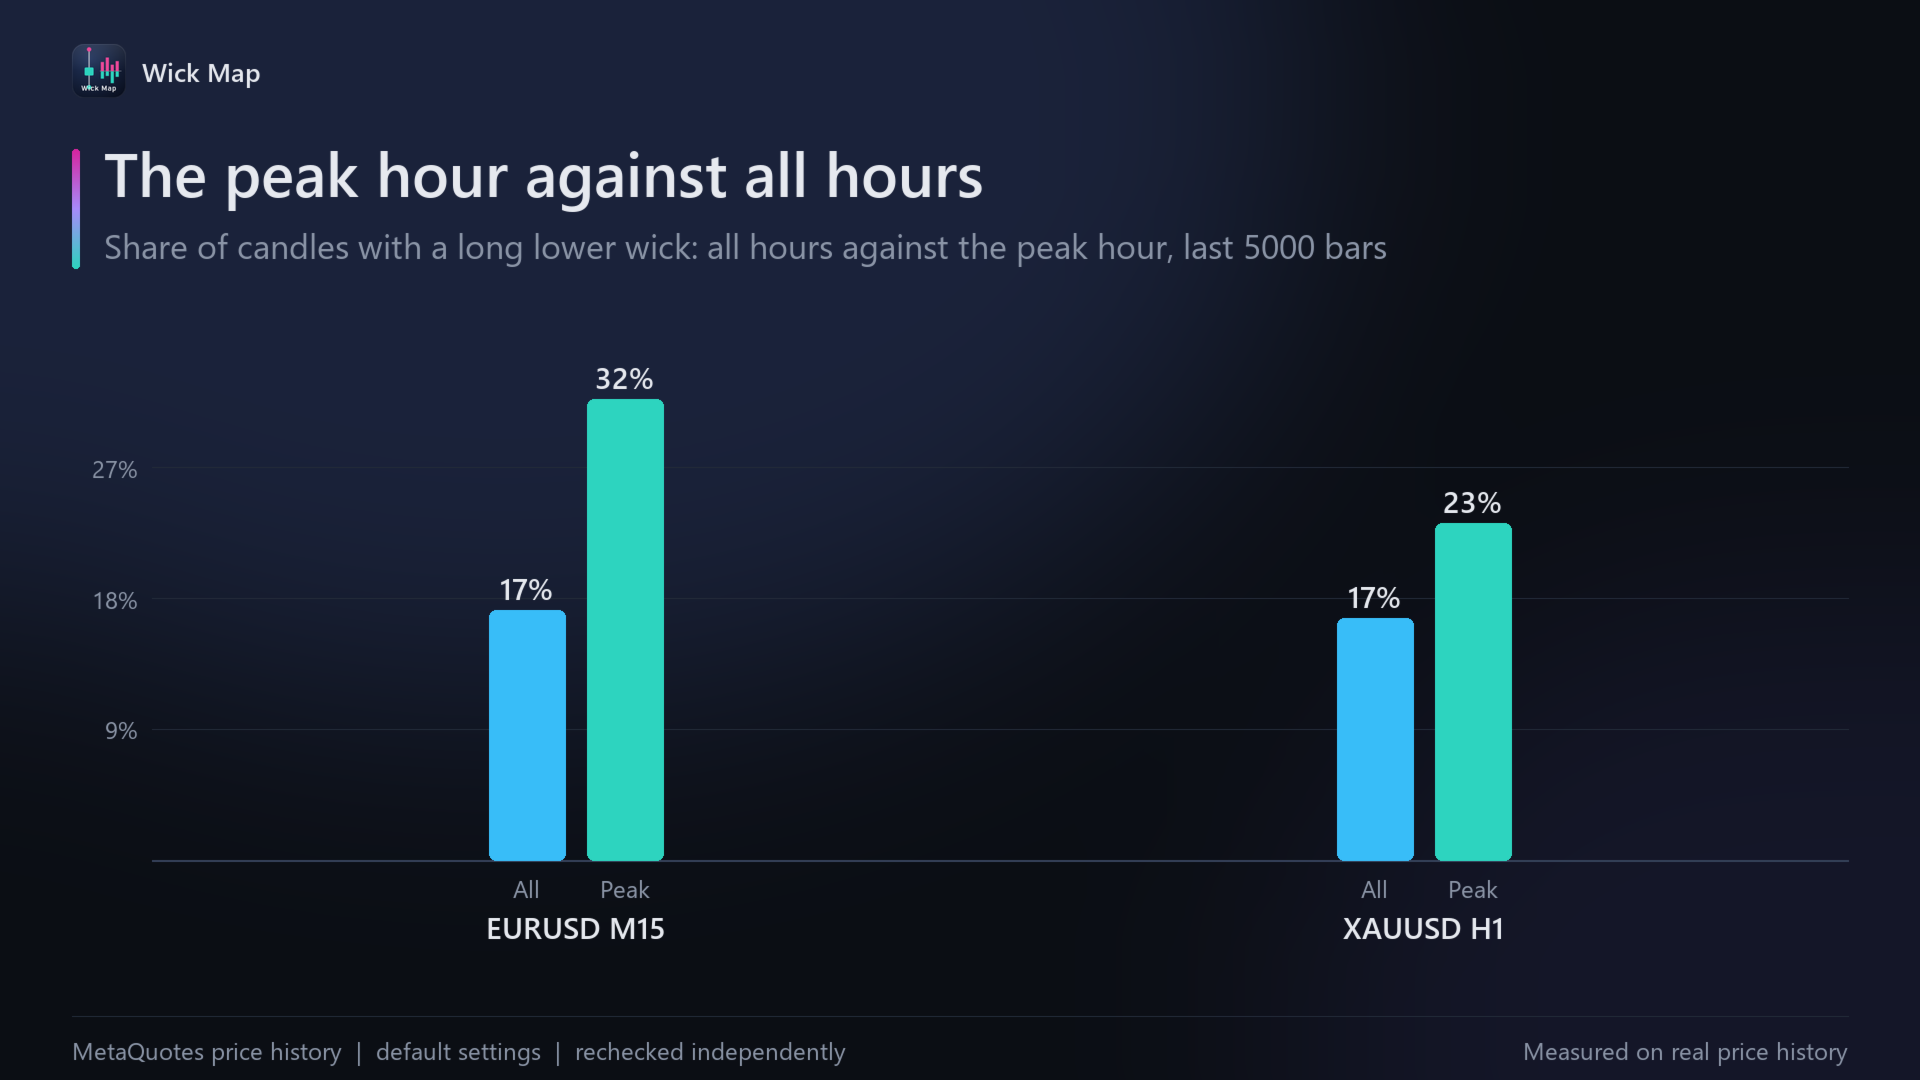
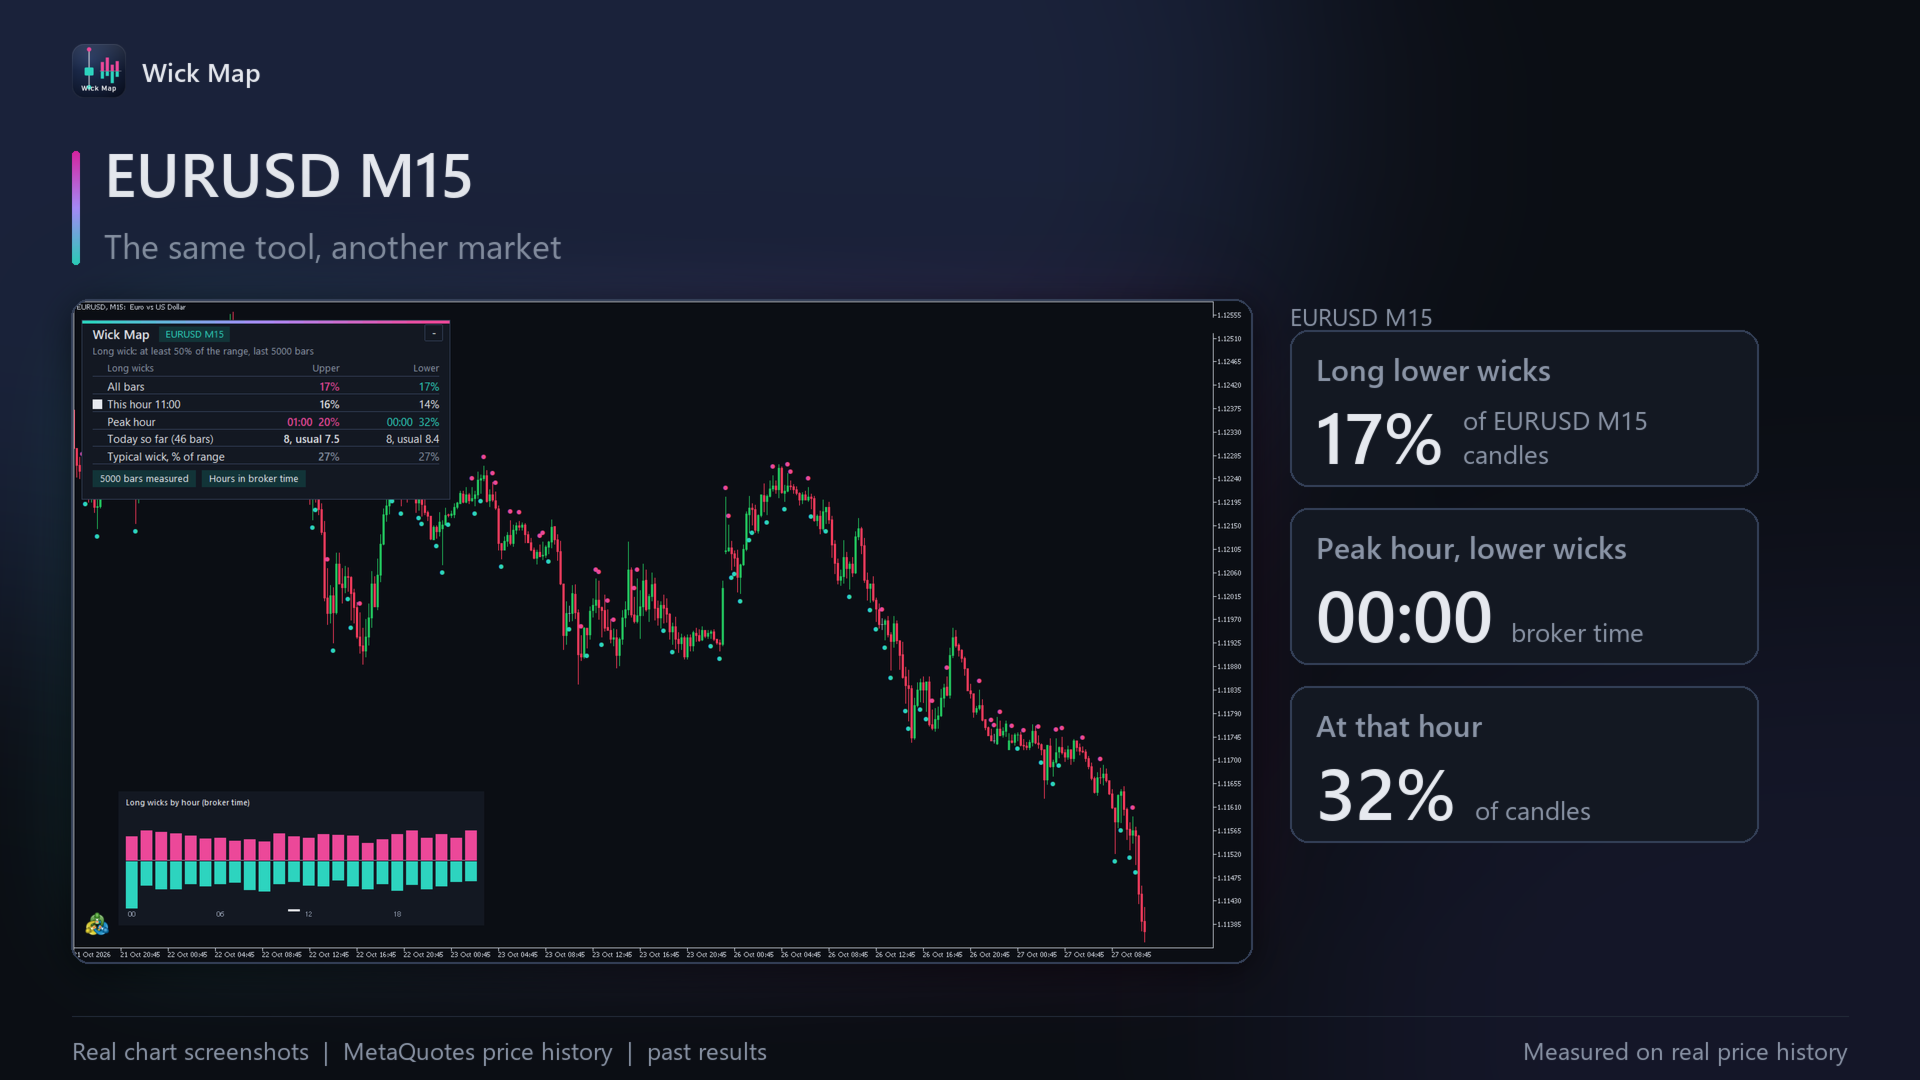
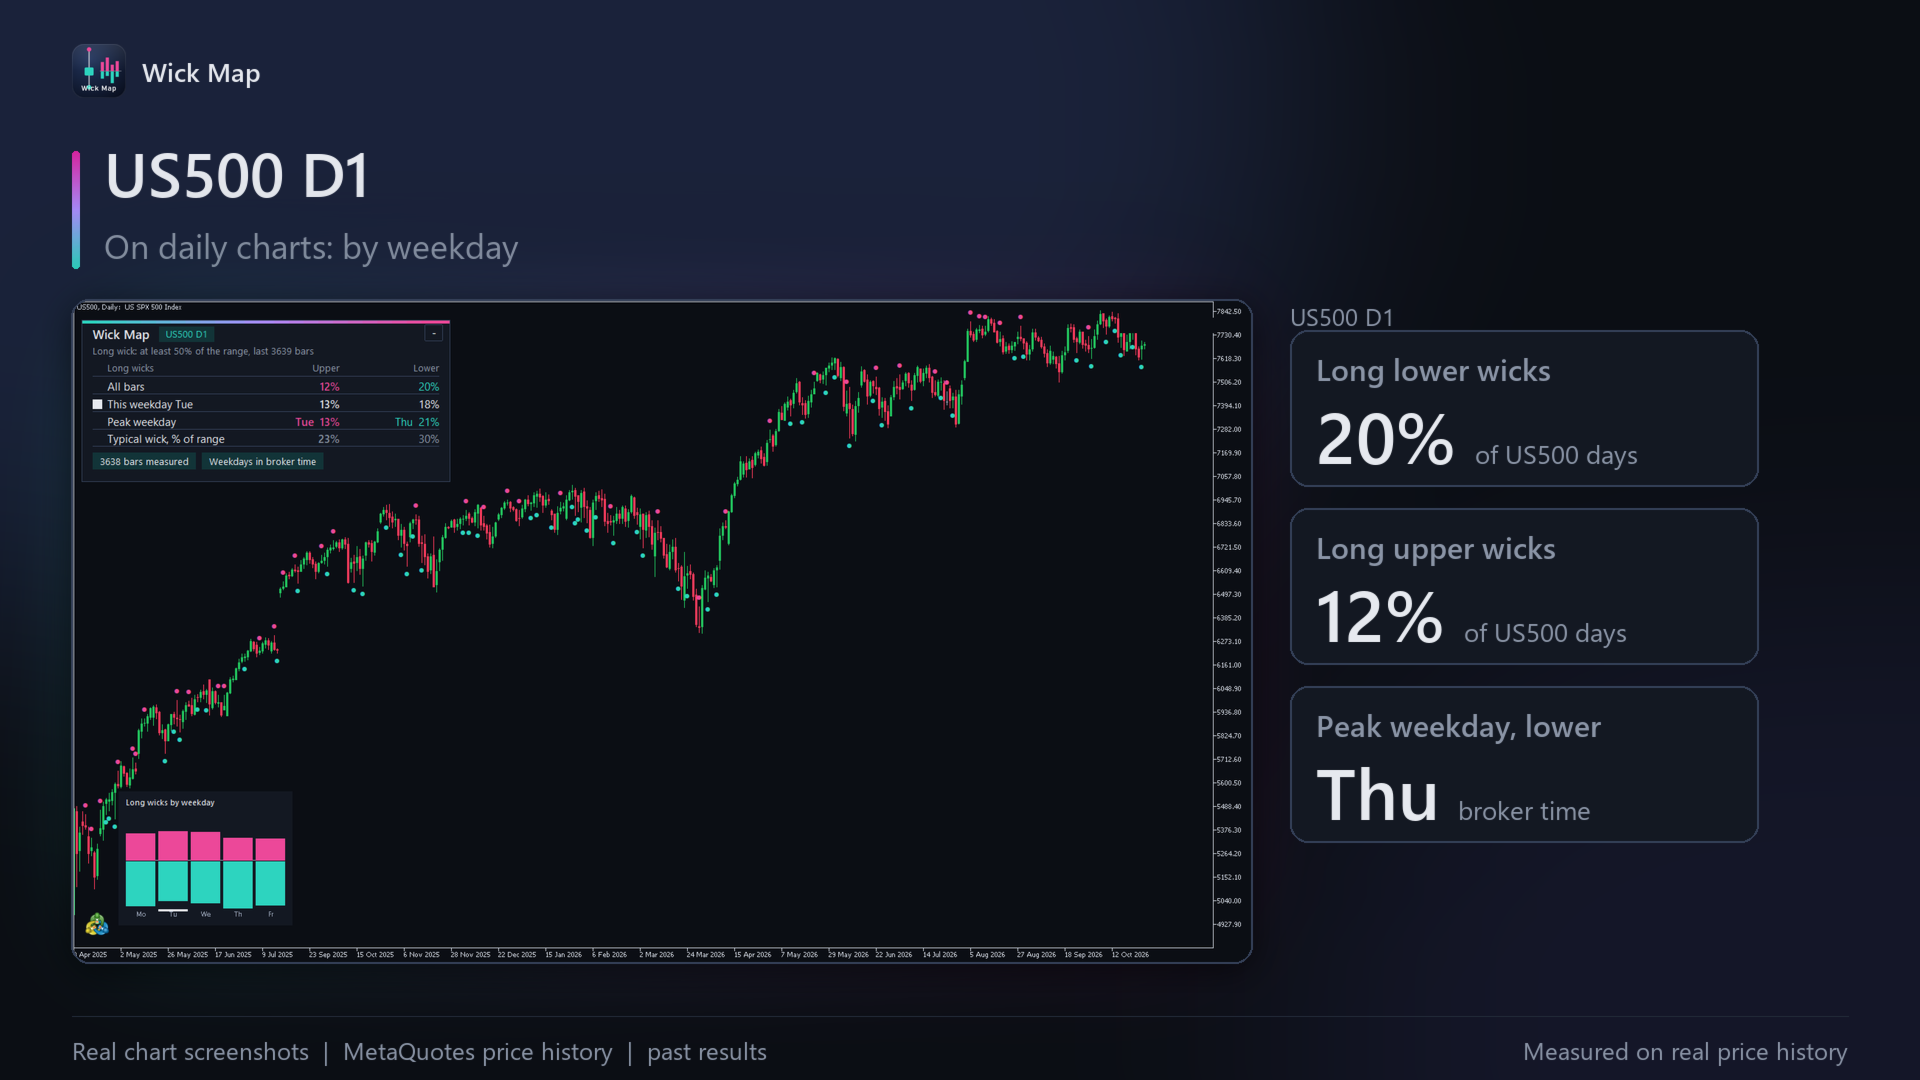
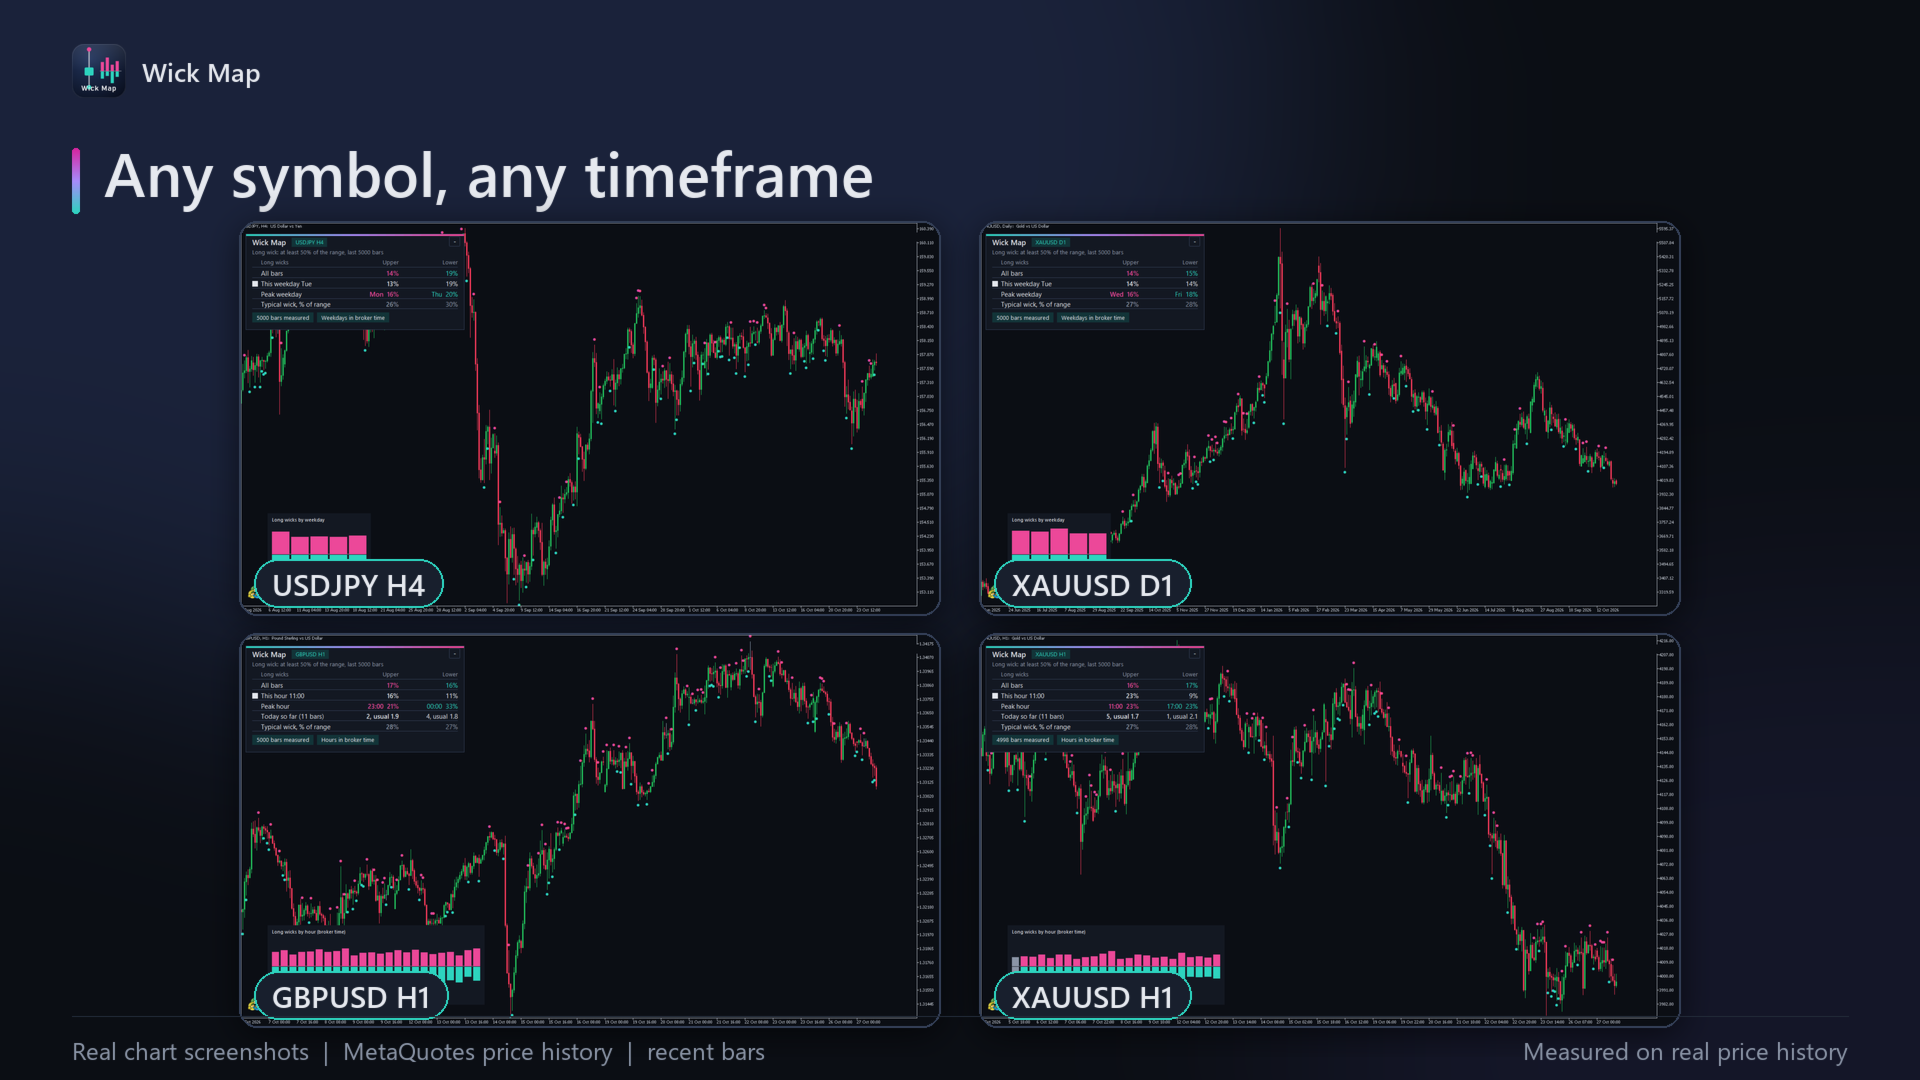
Wick Map shows where long wicks happen on your symbol: a dot on every long upper and lower wick, a wick clock that splits them by hour of the day, and today's long wicks against the usual for the same hours. On EURUSD M15, 32% of the candles opening at 00:00 broker time had a long lower wick, against 17% over all hours. On US500 D1, long lower wicks came on 19.8% of days and long upper wicks on 11.8%. Closed bars only, so it never repaints. Every number is verified against a separate implementation before each release.
What it does
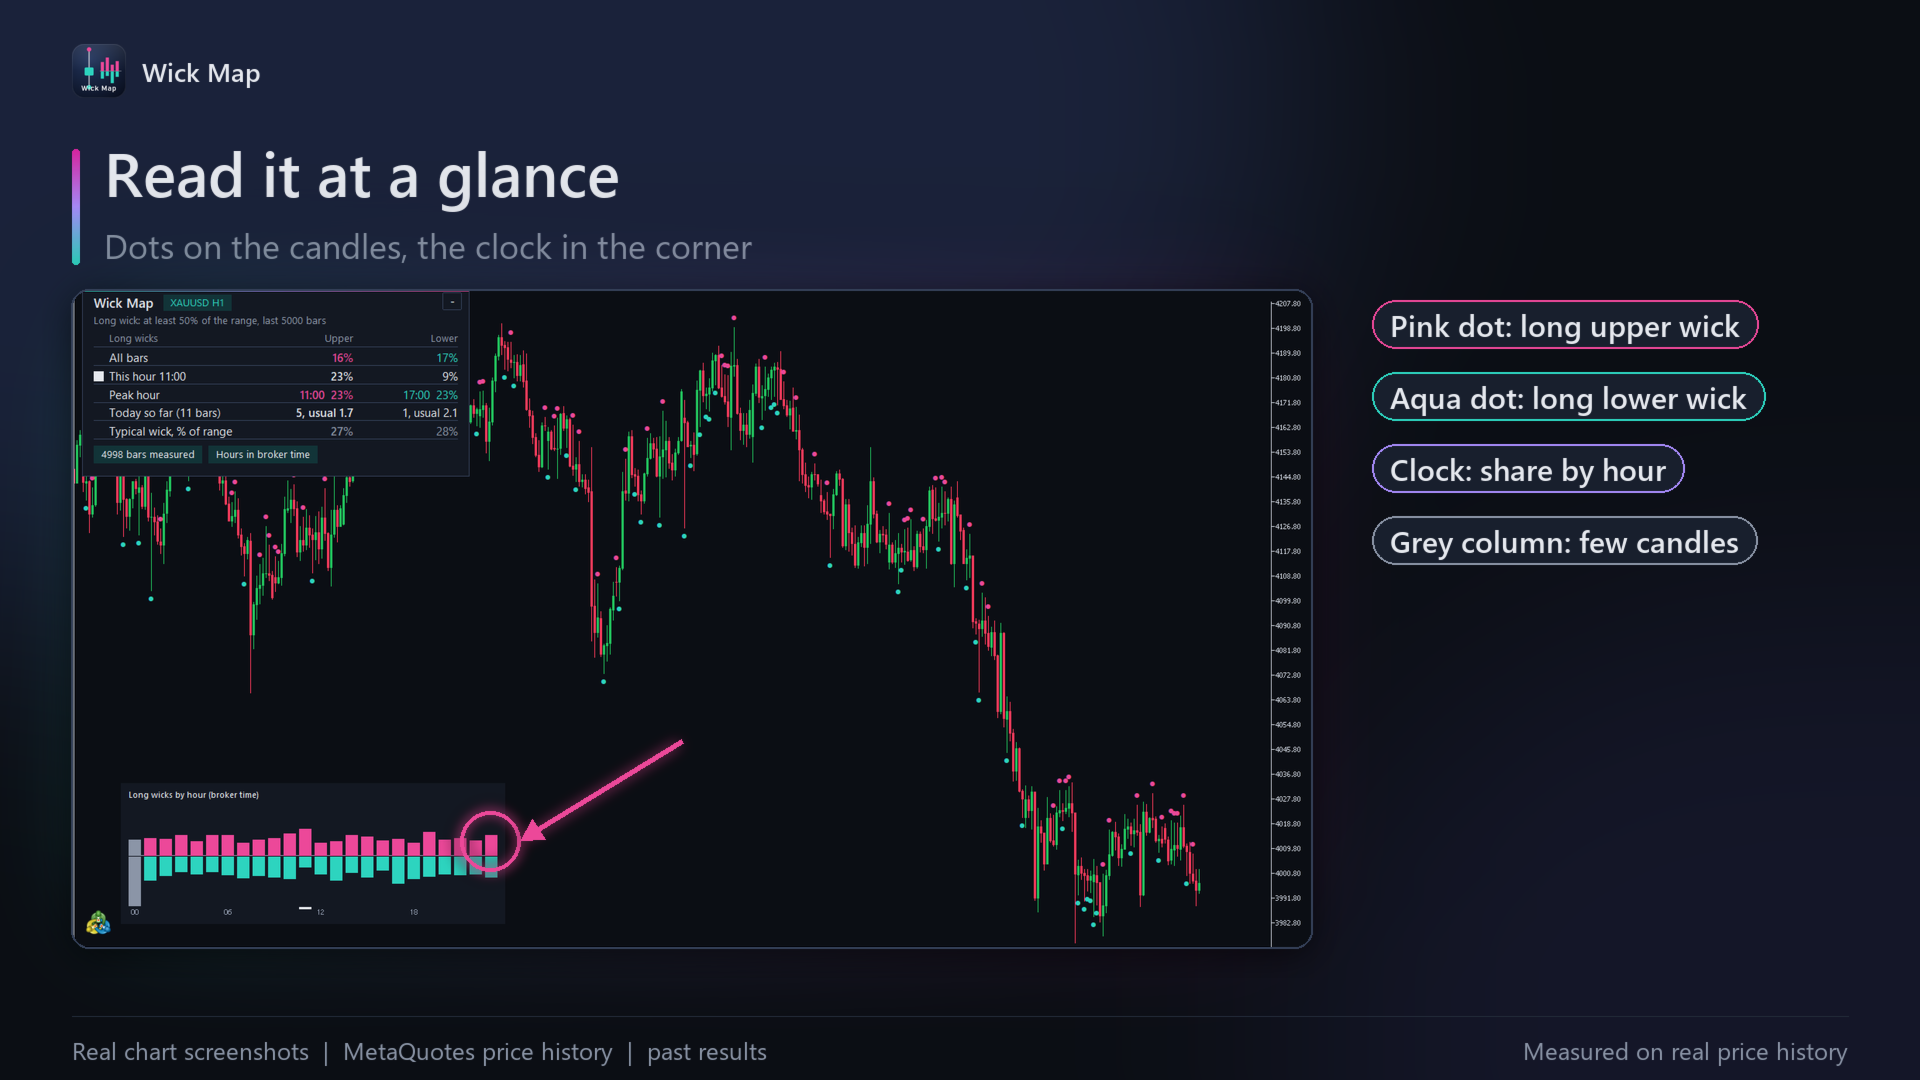
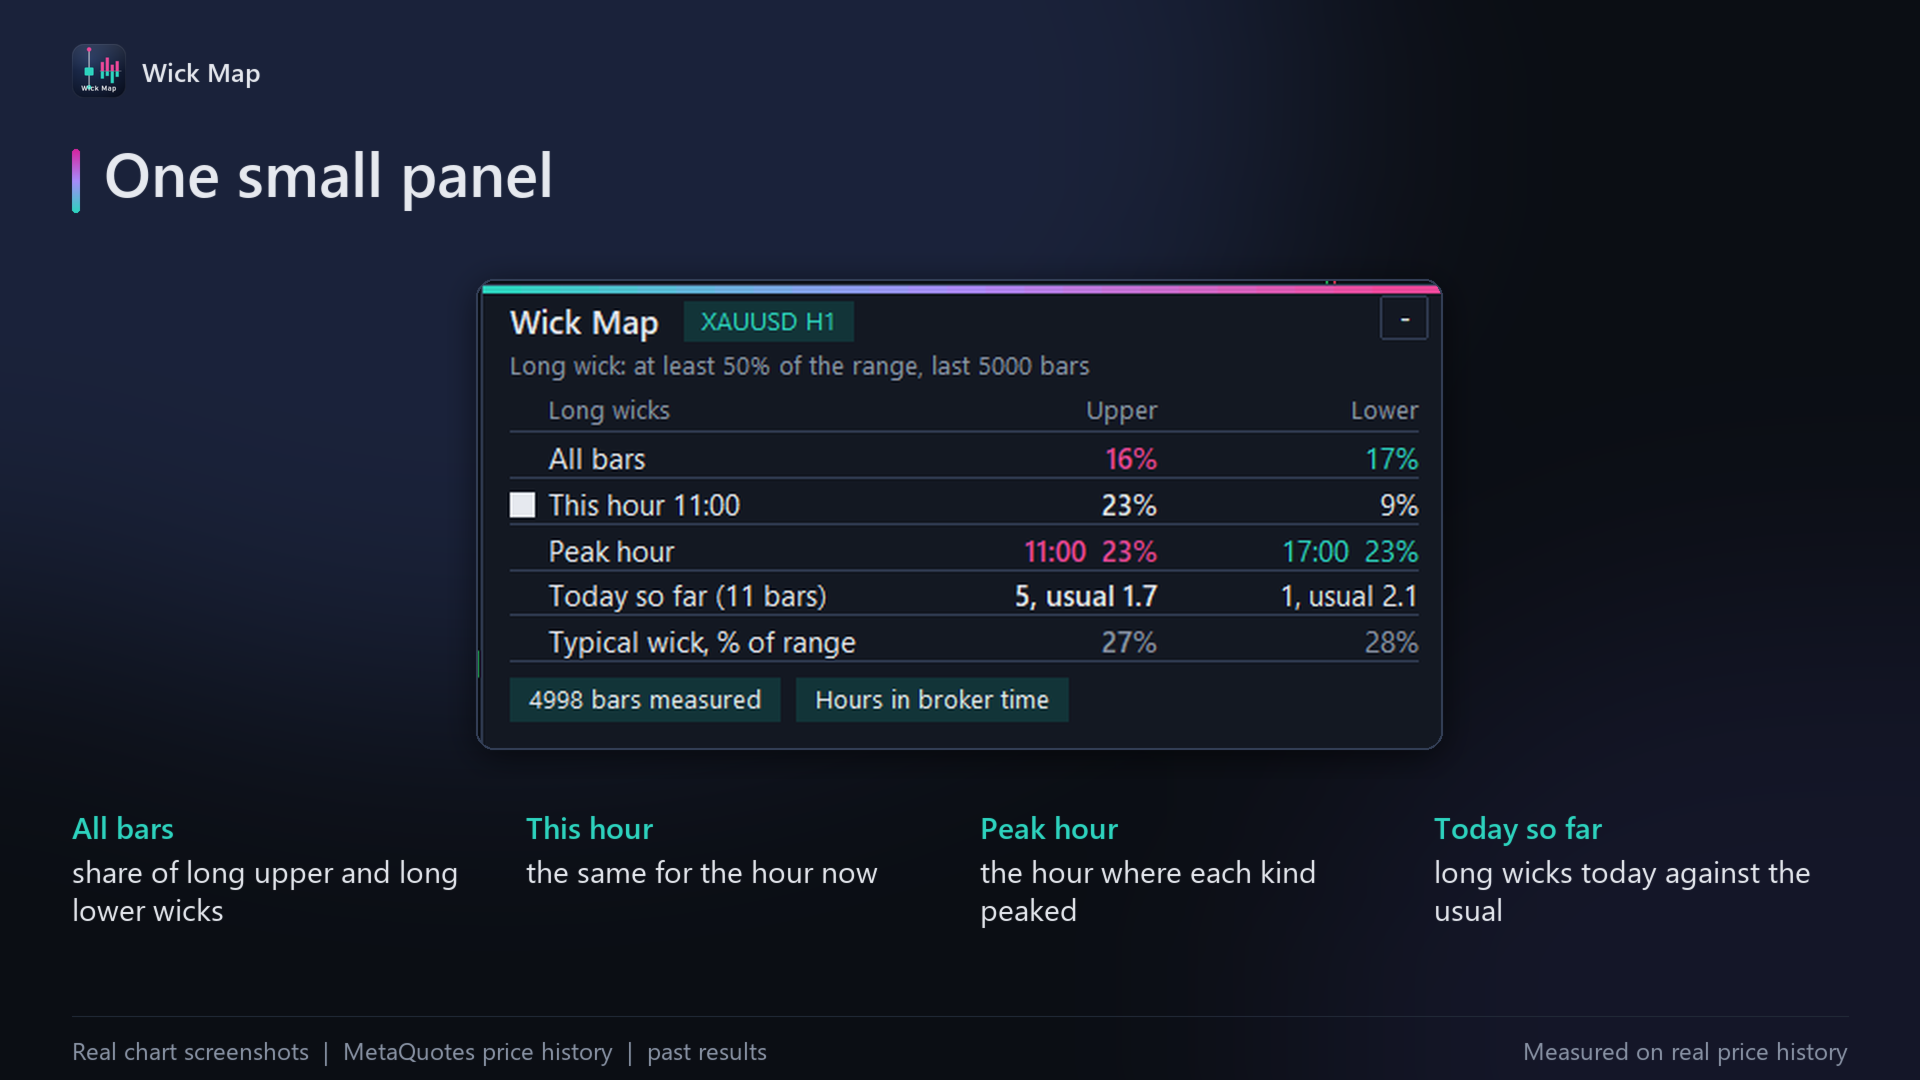
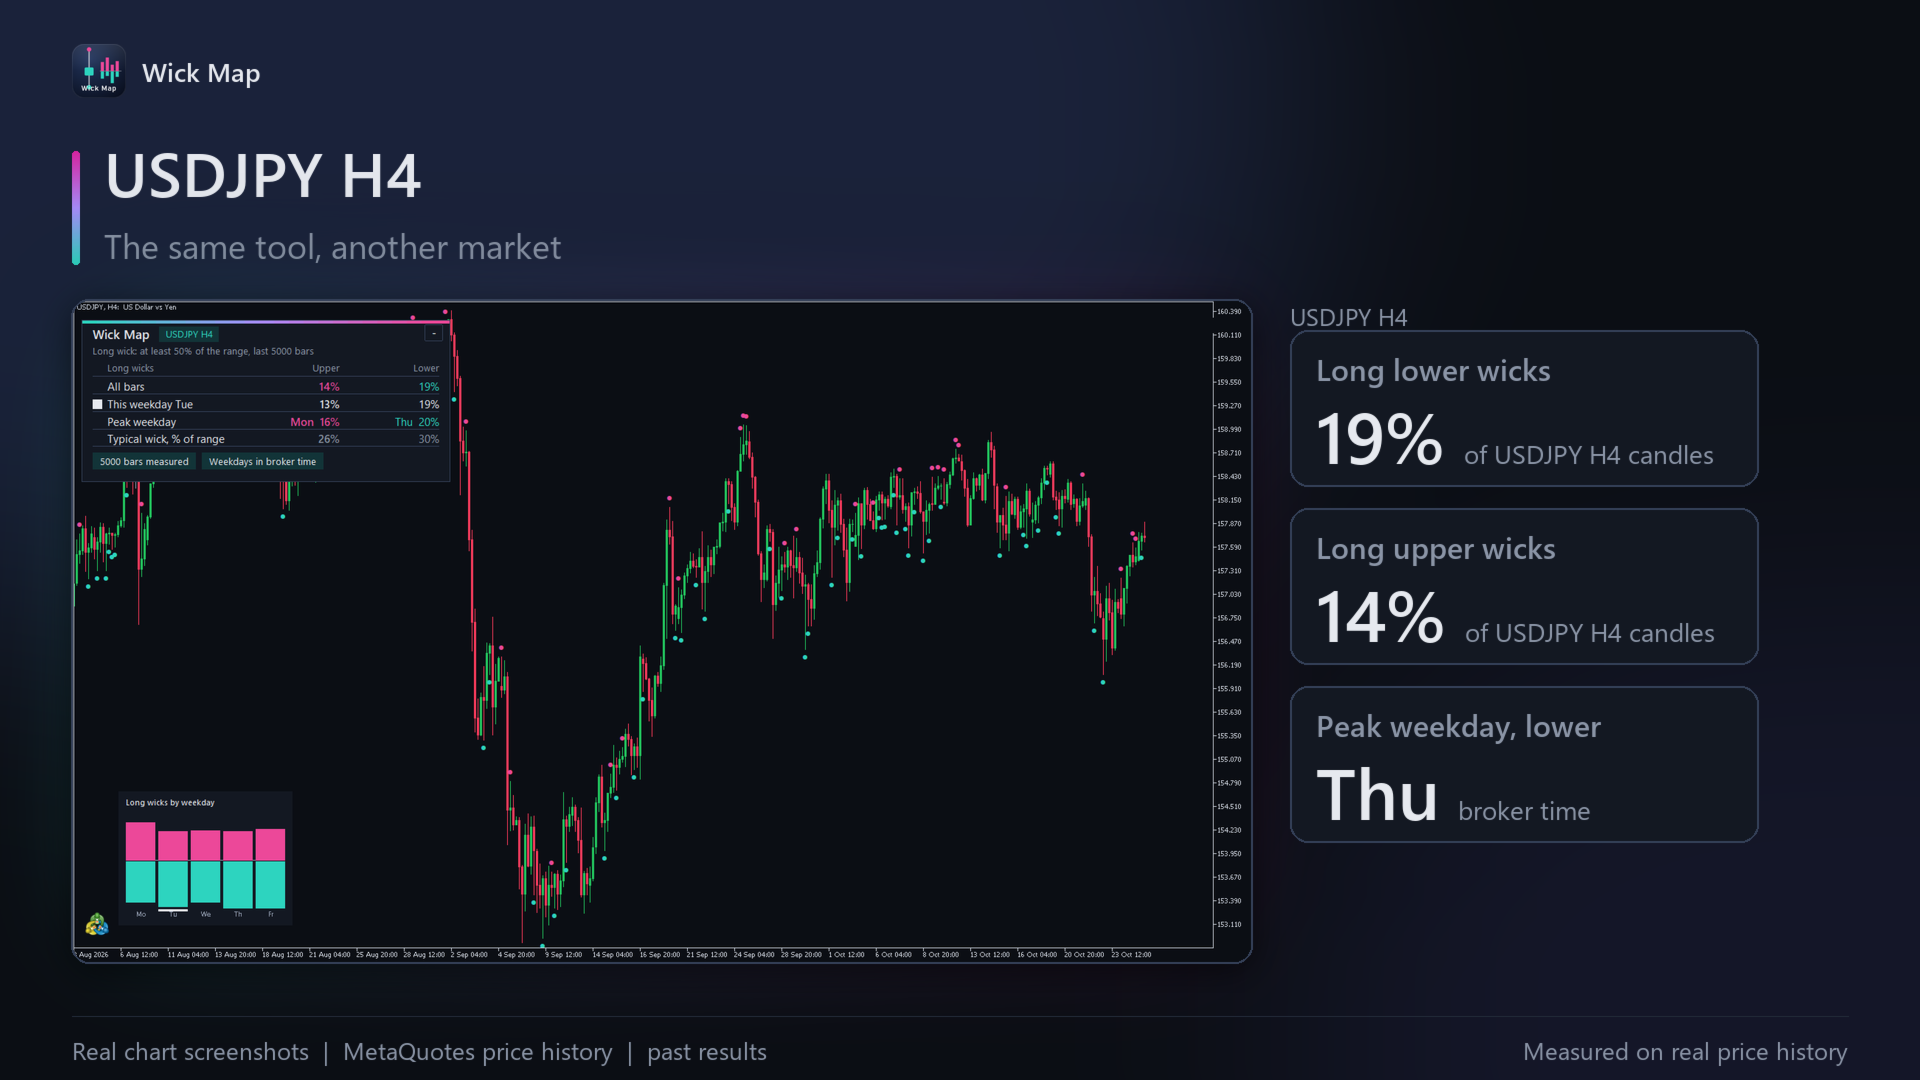
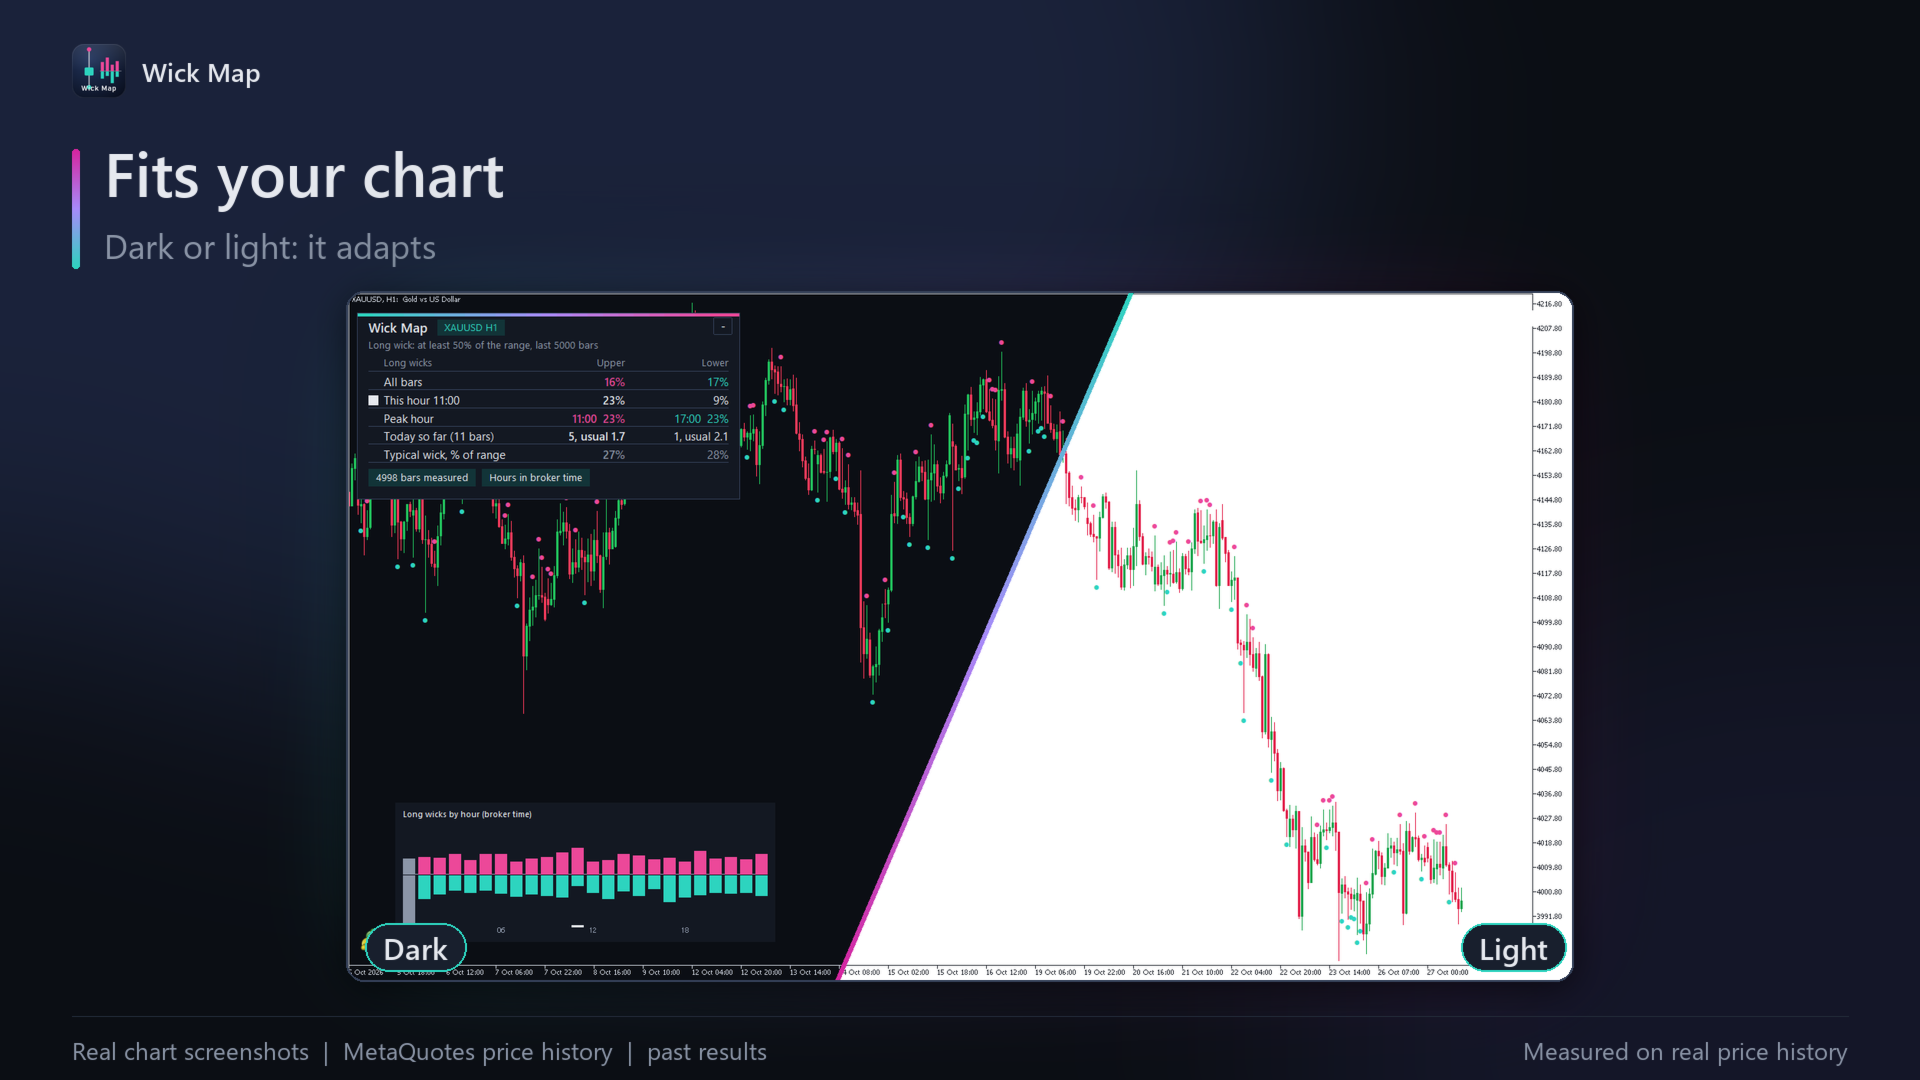
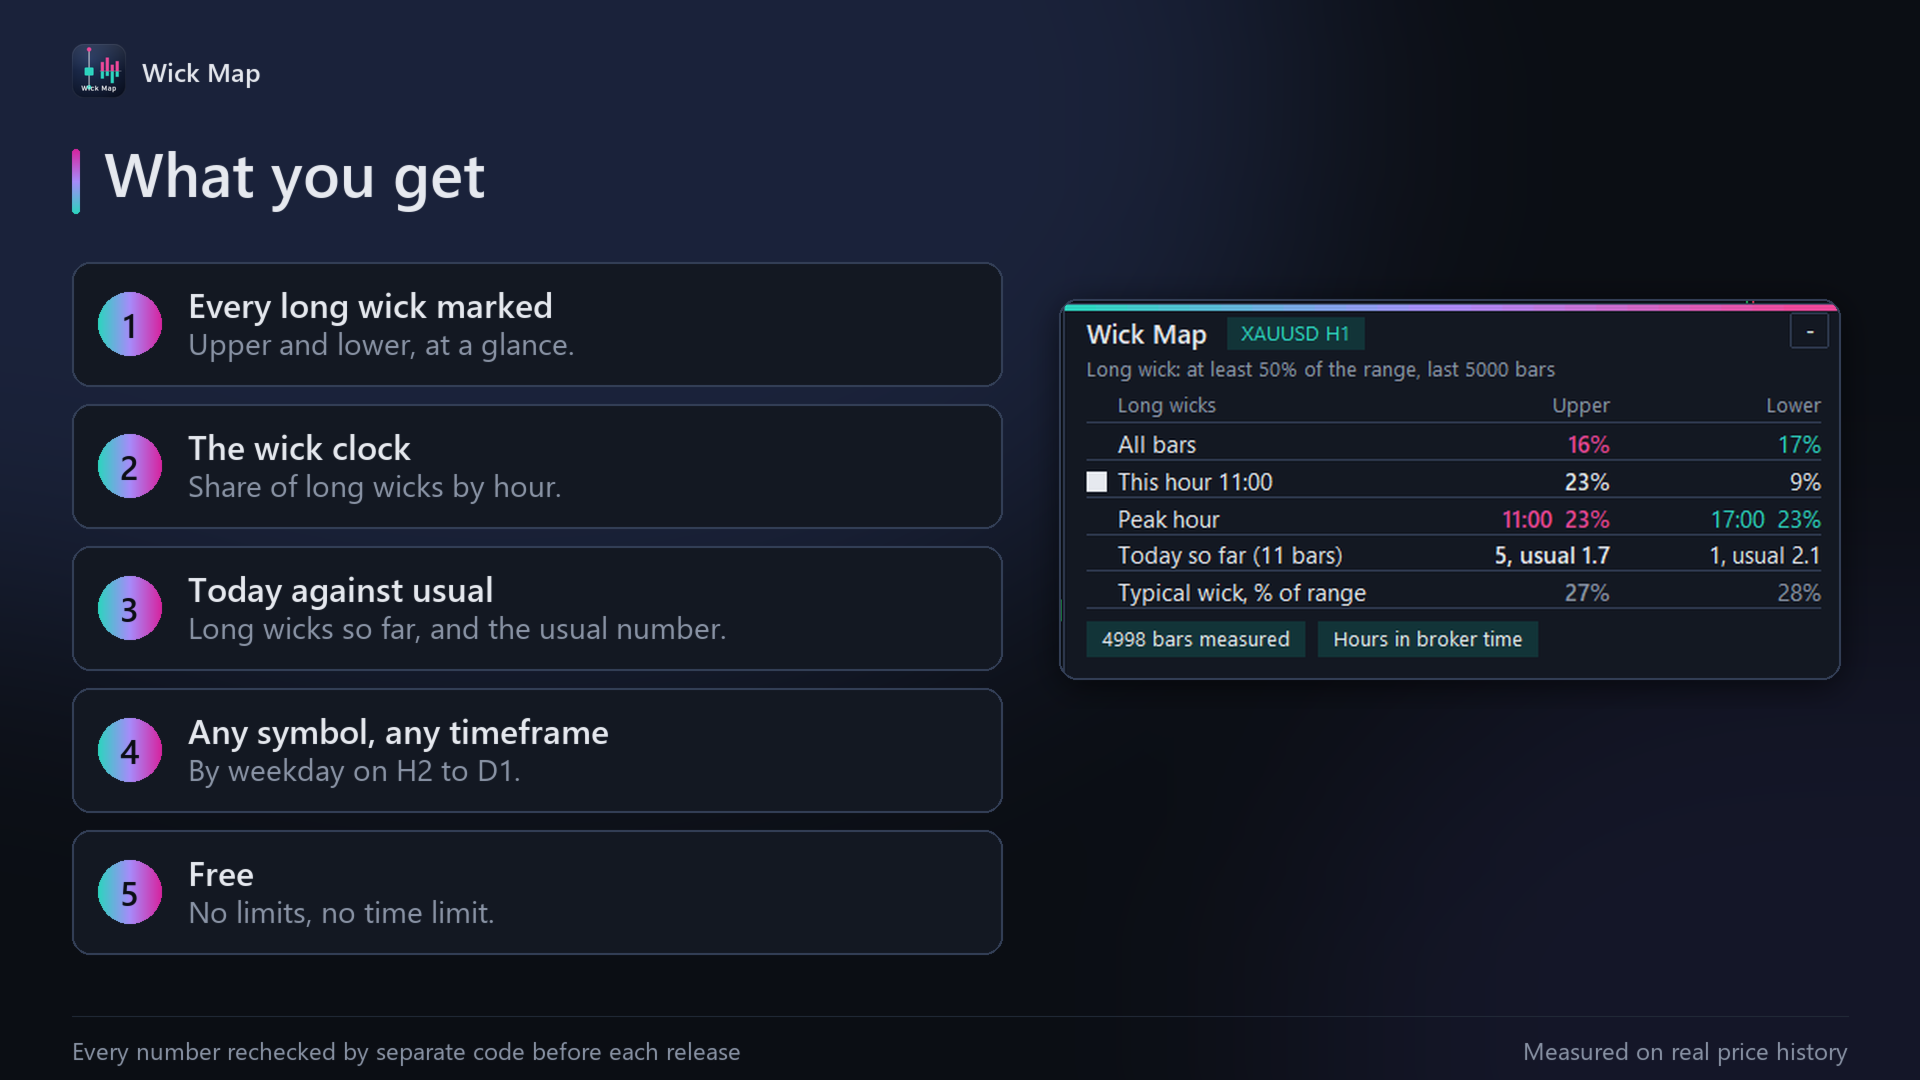
A small dot marks the tip of every long wick on the price chart: pink above the candle for a long upper wick, aqua below it for a long lower wick. The wick clock in the lower-left corner has one column per hour of the day (broker time): the pink bar above the line is the share of candles in that hour with a long upper wick, the aqua bar below it the share with a long lower wick, and the hour now is underlined. On H2 to D1 charts the clock has one column per weekday instead. A small panel shows the share of long upper and lower wicks over all bars and for the hour now, the peak hour for each, today's long wicks so far against the usual number for the same hours, and the typical wick as a share of the candle's range.
How it works
A wick is long when it covers at least half of the candle's range, high to low (you can set 20% to 90%). Every finished candle in the last 5000 bars is measured by default; candles with no range are left out. Hours and weekdays come from each candle's open time on your broker's server, so the clock matches your chart. Hours with fewer than 20 candles are shown in grey.
How it was tested
Every figure (each candle's marks, the counts and shares for each hour or weekday, the peak hours, today's counts and the usual numbers) is recomputed by a separate implementation from the same broker data and matches it to the last decimal, on gold, EURUSD, US500 and USDJPY across H1, M15, D1 and H4, at long-wick settings from 30% to 70% and several history lengths.
Results and risks
Over the last 5000 bars: on gold H1, 15.6% of candles had a long upper wick and 16.7% a long lower wick, and the peak hour for upper wicks was 11:00 broker time at 23%. On EURUSD M15, 32% of the 00:00 candles had a long lower wick, against 17% over all hours. On US500 D1, long lower wicks came on 19.8% of days and long upper wicks on 11.8%. These describe past candles, not the future, and hours depend on your broker's server time.
Recommended use
Any symbol and any timeframe, from M1 to monthly, with at least 100 finished candles; the wick clock by hour works on M1 to H1. Typical uses: seeing at a glance which hours of the day tend to leave long wicks on this symbol, noticing when today has had more long wicks than usual, and finding past long-wick candles on the chart.
Inputs
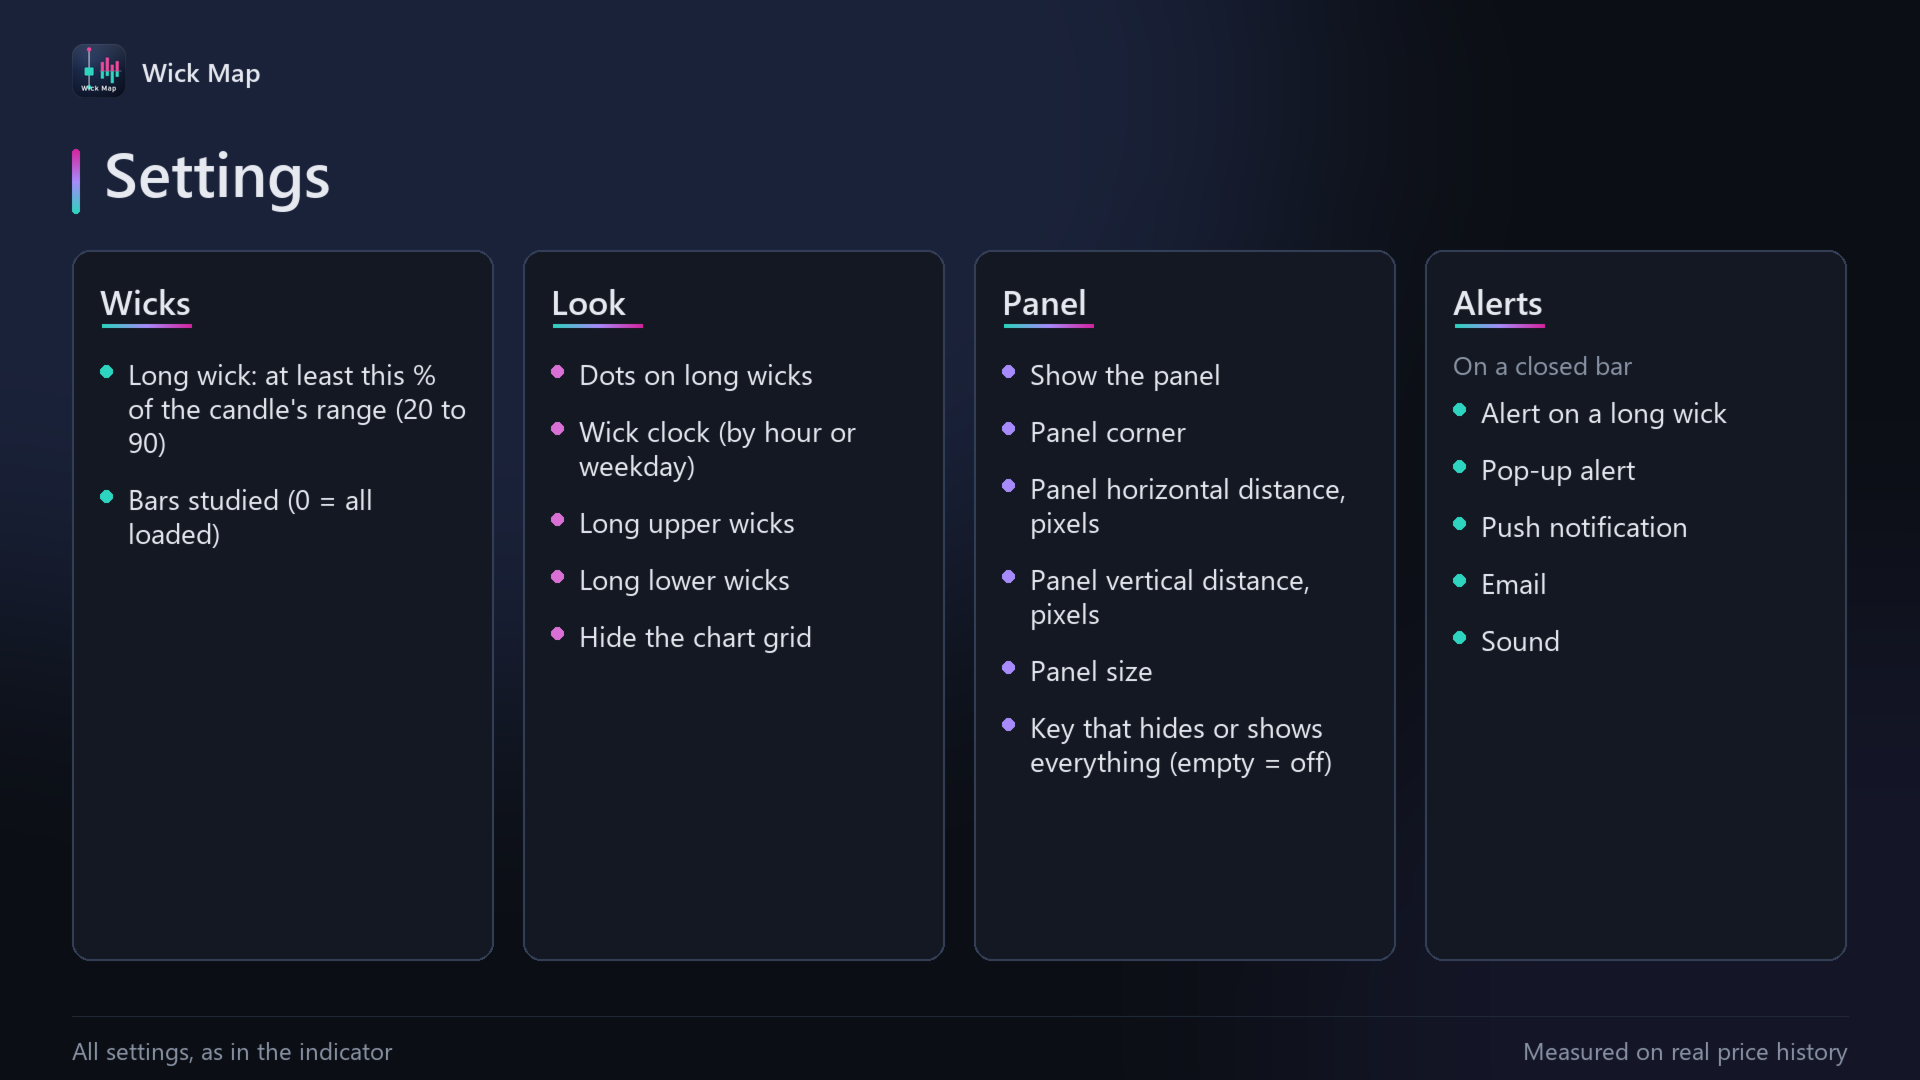
- Long wick: at least this share of the candle's range (50% by default, 20% to 90%).
- Bars studied: 5000 by default; 0 uses all loaded history.
- Dots on long wicks and the wick clock: each can be switched off.
- Colours for long upper and long lower wicks.
- Panel: show or hide, any chart corner, distance from the edges in pixels, and size (small, normal, large). One key (H by default) hides or shows everything the indicator draws.
- Alert on a long wick: pop-up, push, email or sound, on a closed bar.
- Hide the chart grid: on by default.
Risk notice
Trading forex, metals, indices and other leveraged products carries a high risk of loss. Wick Map is an analysis tool: it does not give investment advice or trading recommendations, and it does not guarantee any result. All figures describe past data, and past behaviour does not guarantee future behaviour. You are responsible for your own trading decisions.
Support
Questions? Message me through MQL5 chat.
Useful? A short review helps other traders find it.
A full guide with pictures: https://www.mql5.com/en/blogs/post/778547