Fair Value Gap Fill Tracker MT5
- Indicators
- Version: 1.0

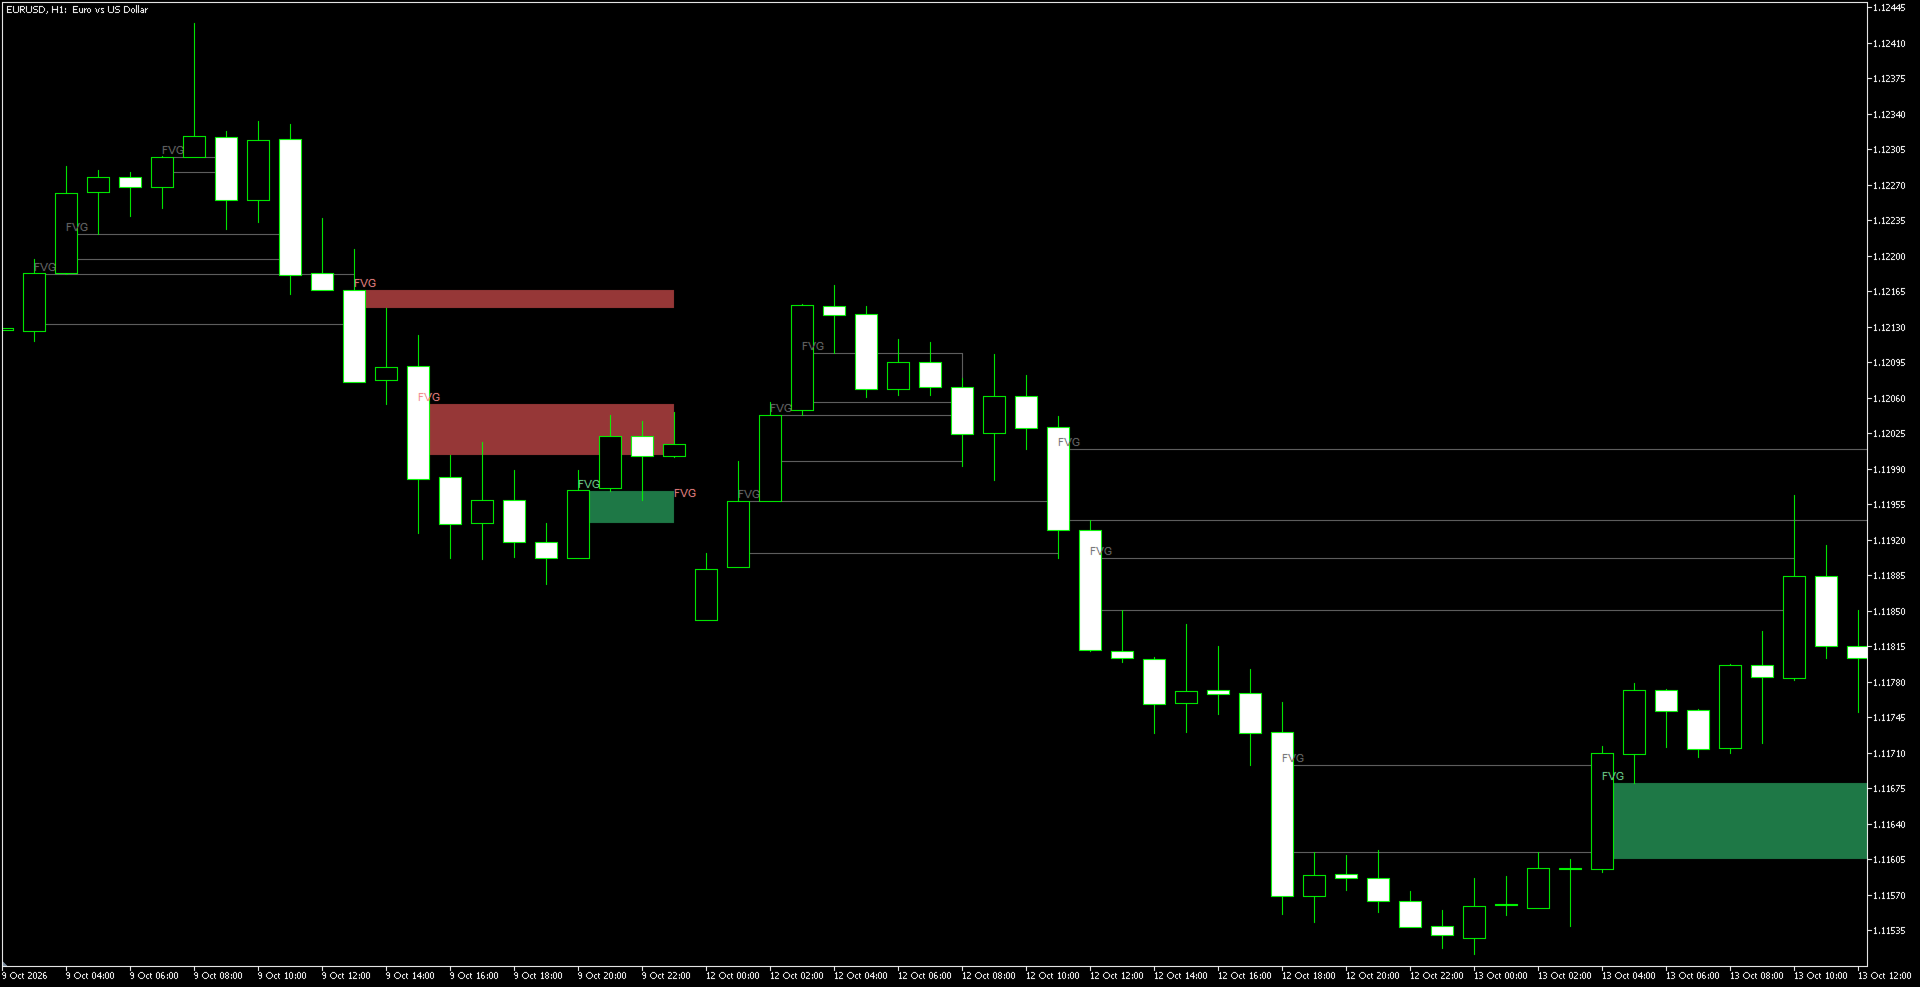
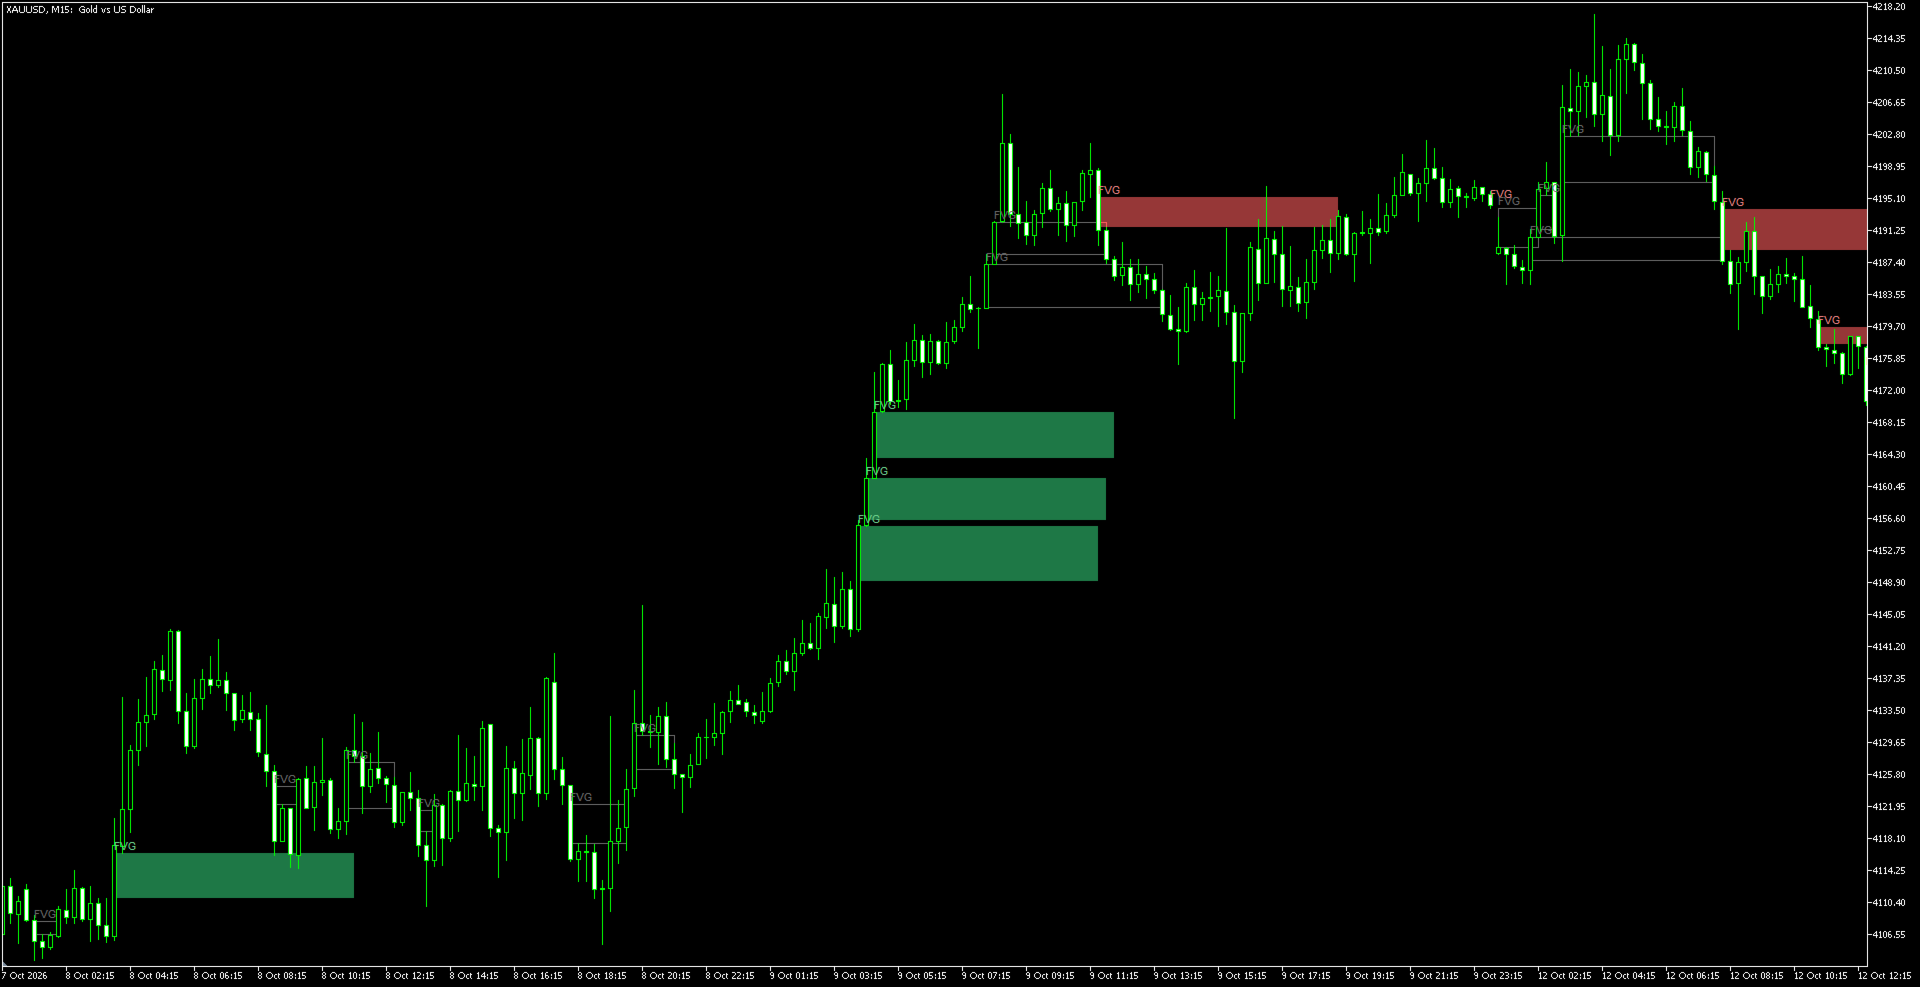
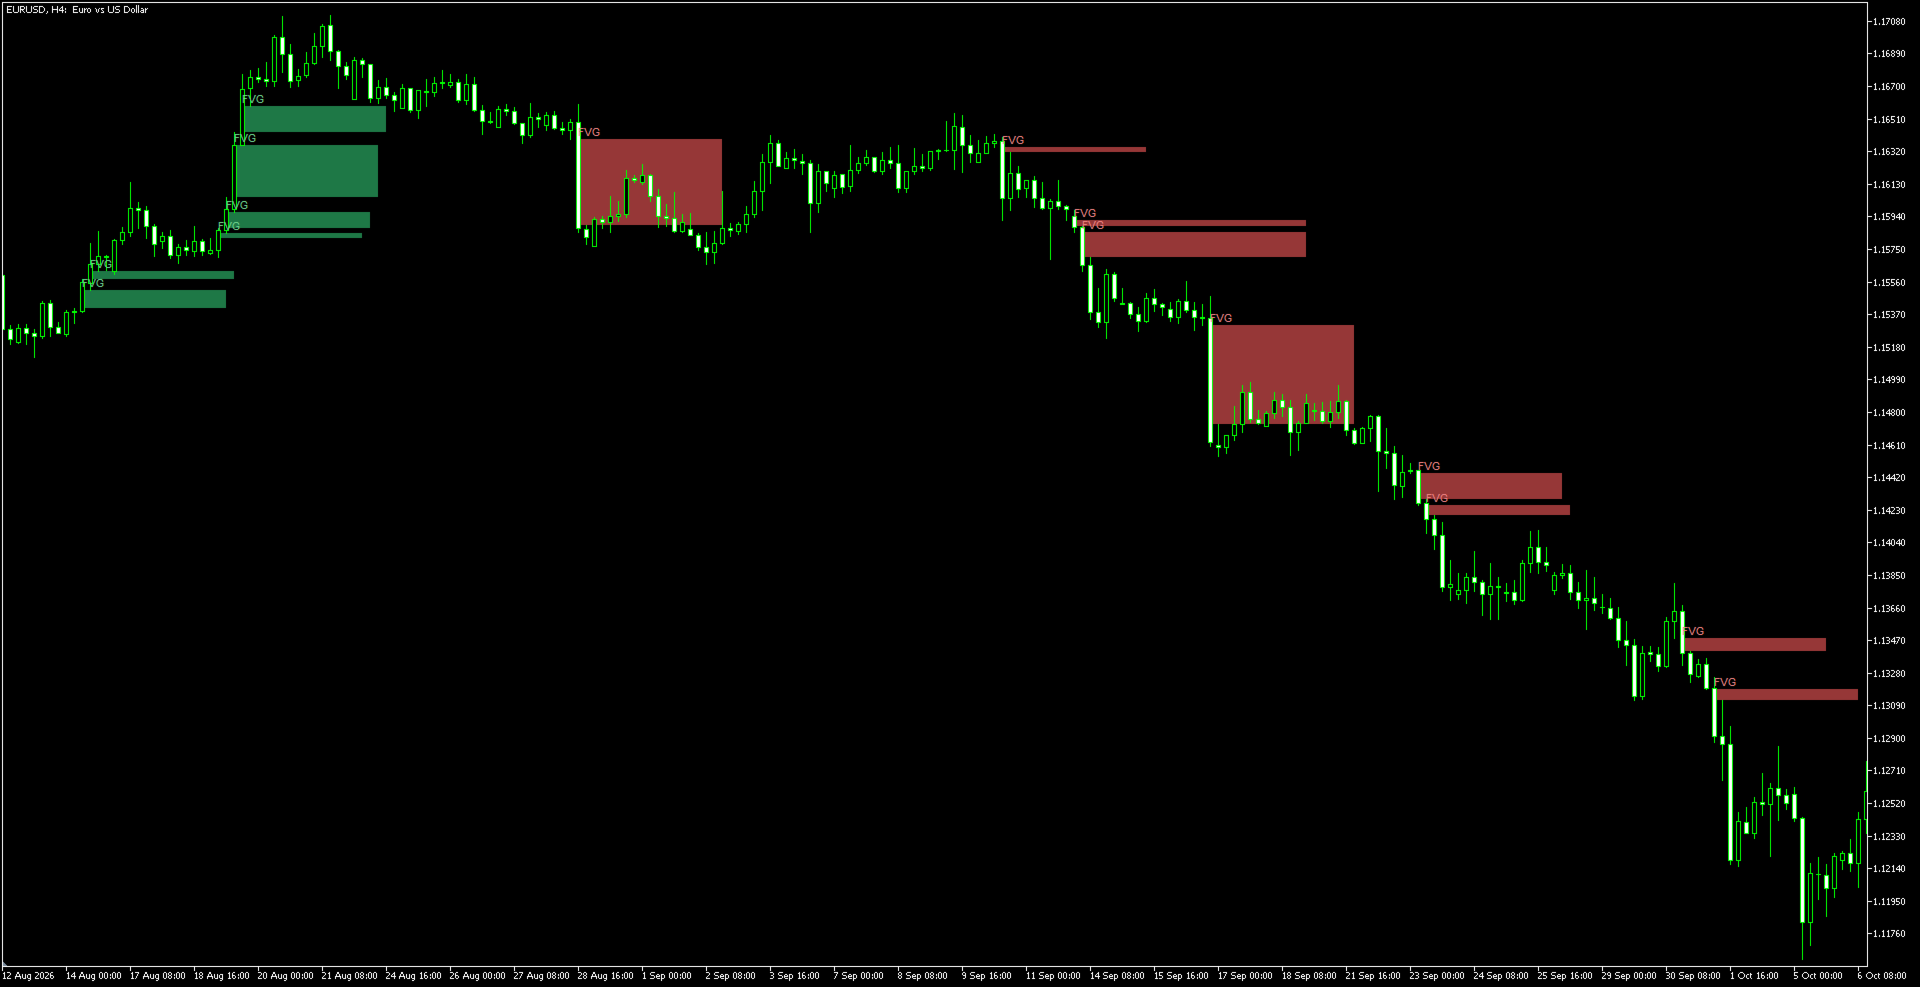
Fair Value Gap Fill Tracker finds Fair Value Gaps (FVG, also called imbalances) and draws them on the chart as colored zones. A Fair Value Gap is a three-candle pattern in which the wicks of the first and the third candle do not overlap, so the middle candle leaves an area of the chart that price moved through very quickly. The indicator marks this area, extends it to the right and follows what price does with it: the zone stays open until price fills it.
Features
- Bullish gaps - the low of the third candle is above the high of the first candle; the zone lies between these two levels
- Bearish gaps - the high of the third candle is below the low of the first candle; the zone lies between these two levels
- Minimum gap size as a multiple of ATR(14) - small, insignificant gaps are filtered out automatically on any symbol and timeframe
- Three fill rules - wick through the zone, close through the zone, or first touch
- Filled zones - either stop at the filling candle and turn dim grey, or disappear from the chart
- Zones are extended to the right for the chosen number of bars
- Bullish and bearish zones in separate colors; each direction can be switched on or off
- Optional FVG text label on each zone
- Alerts for new zones: pop-up window and/or push notification (off by default); alerts are sent only for new zones on the live chart, not for the history loaded at start
- Works on any symbol and any timeframe
- Does not trade and does not use DLLs, files or web requests
How it works
- Everything is calculated on CLOSED bars. A zone appears when the third candle of the pattern closes, and it is not redrawn or moved afterwards.
- A zone is considered filled according to the selected Fill rule:
- Wick through the zone - the wick of a candle goes through the whole zone to its far edge (default)
- Close through the zone - a candle closes beyond the far edge of the zone
- First touch (price enters the zone) - the zone is filled as soon as price enters it - Stop at fill (dim grey zone) - the zone ends on the candle that filled it and is shown in dim grey, so you can see which gaps have already been used. Hide filled zones removes filled zones from the chart, and only open zones remain.
- A zone that has been open longer than Extend zone bars stops being tracked; the rectangle stays on the chart as drawn.
Inputs
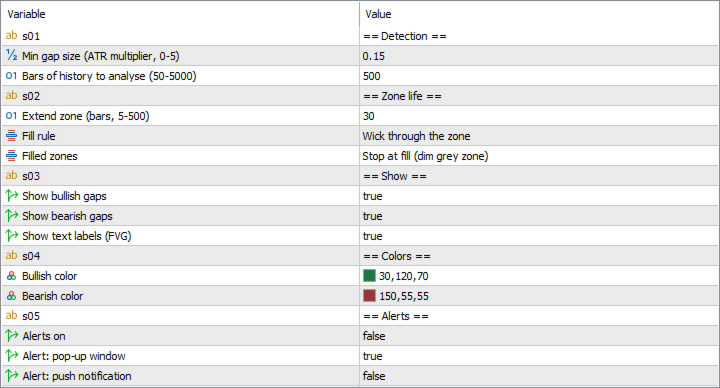
- Min gap size (ATR multiplier, 0-5) - the smallest gap that is drawn, as a multiple of ATR(14). 0 shows every gap; larger values show fewer, more significant gaps. Default: 0.15
- Bars of history to analyse (50-5000) - how many past bars are analysed when the indicator loads. Default: 500
- Extend zone (bars, 5-500) - how far to the right a zone is extended. Default: 30
- Fill rule - Wick through the zone / Close through the zone / First touch (price enters the zone). Default: Wick through the zone
- Filled zones - Stop at fill (dim grey zone) / Hide filled zones. Default: Stop at fill (dim grey zone)
- Show bullish gaps, Show bearish gaps - switch each direction on or off. Default: on
- Show text labels (FVG) - the FVG label on each zone. Default: on
- Bullish color, Bearish color - colors of the zones
- Alerts on, Alert: pop-up window, Alert: push notification - alerts for new zones. Default: off
Notes
- A gap can be recognised only after the third candle has closed, so a zone always appears one candle after the move that created it.
- Zones are drawn as chart objects; the indicator has no buffers for use in Expert Advisors.
- The sections in the input window ("== Detection ==" and others) are only headings and have no effect.
- This is an analysis tool, not a trading signal. An unfilled gap does not guarantee that price will return to it or react to it.