 MetaTrader 5
 Experts
 지표
지표
 라이브러리
라이브러리
 유틸리티
유틸리티
 위젯
위젯
 규칙
규칙
MetaTrader 5용 무료 기술 지표 - 21
 기술 지표의 시그널은 주식 및 외환 시장에서 거래를 개시 및 종료하는 데 중요한 역할을 합니다. 지표의 본질은 미래의 가격 변화를 예측하기 위한 금융 시그널 값의 수학적 변형입니다.
기술 지표를 테스트하여 시장 행동과 그로 인한 이익을 더 잘 예측할 수 있습니다.
기술 지표의 시그널은 주식 및 외환 시장에서 거래를 개시 및 종료하는 데 중요한 역할을 합니다. 지표의 본질은 미래의 가격 변화를 예측하기 위한 금융 시그널 값의 수학적 변형입니다.
기술 지표를 테스트하여 시장 행동과 그로 인한 이익을 더 잘 예측할 수 있습니다. 
Trading in volatile markets often creates uncertainty between genuine trend continuation and false breakouts.
When price moves quickly, monitoring multiple standard deviation bands manually can clutter execution timing.
Double Bollinger Bands Channel Alert provides a structured two-band framework to identify trend momentum zones and pullback continuation levels with clarity. What it shows:
Outer Bands (Deviation 2.0) = Volatility boundaries highlighting strong trend expansion.
Inner Bands (Devi
FREE

This indicator automatically calculates and displays the 9 Murrey Math price levels (0/8 through 8/8) on your chart, using the classic Murrey Math algorithm (the same levels as the well-known Murrey_Math_Line_X). Levels are derived from the highest and lowest prices over a configurable lookback period and can be calculated from any timeframe, so you can trade on M15/H1 while keeping the key D1 levels on your chart.
Key Features: 9 Murrey Math Levels — From Ultimate Support (0/8) to Ultimate Res
FREE
Volumized OrderBlocks MTF - Multi-Timeframe Volumetric Order Block Indicator
OVERVIEW
Volumized OrderBlocks MTF is an advanced Multi-Timeframe Order Block indicator that automatically detects, displays, and merges Order Blocks from up to 3 different timeframes on a single chart. Built with institutional Smart Money Concepts (SMC) method
FREE

ATOM Choppiness Zone is an advanced volatility filter designed to eliminate market noise and instantly reveal whether the market is ranging or trending. Based on the classical Choppiness Index formula developed by E.W. Dreiss , this tool converts complex mathematical calculations into a clean, color-coded visual histogram. The Mathematics & Formula The indicator measures market efficiency using fractal dimension logic. It calculates the ratio between the total True Range over $N$ periods and the
FREE

선택한 세션 시작(서버 시간) 후 처음 몇 분간의 고점과 저점을 매일 표시하고, 선택적으로 레인지의 배수 위치에 목표 라인을 표시합니다. 주요 기능 마감된 봉에서 계산되며, 값이 리페인트되지 않음 모든 심볼과 타임프레임에서 작동 모든 기간, 레벨, 색상을 입력값에서 변경 가능 최대 봉 수 설정으로 가벼운 리소스 사용 지표를 삭제하면 객체가 자동으로 제거됨 입력값 오프닝 레인지(서버 시간): 세션 시작, 오프닝 레인지 길이(분), 표시할 일수, 레인지의 이 배수 위치에 목표 라인(0 = 끔), 레인지 라인 색상, 목표 라인 색상. 표시: 계산할 최대 봉 수. 참고 이 제품은 분석 도구입니다. 거래를 실행하지 않습니다.
FREE

SAR Colored Indicator with Alarm – Enhance Your Trading Strategy Are you tired of constantly monitoring charts for trend reversals? Introducing the SAR Colored Indicator with Alarm – a powerful, user-friendly tool designed to transform the classic Parabolic SAR (Stop and Reverse) into a dynamic, visually intuitive, and alert-driven system. Perfect for traders of all levels, this indicator is now available in the MQL Market and ready to elevate your trading experience.
What is the SAR Colored In
FREE

Apex Point
is a trend-following indicator for MetaTrader 5, transforming complex market data into signals for traders. It displays blue dots for uptrends, red dots for downtrends, and yellow crosses at potential reversals, helping users identify momentum shifts quickly. Key features include a confirmation system requiring multiple bars (default: 3) to validate changes, reducing false signals; dynamic ATR-based offsets for adaptive trailing, with instant ratcheting in the trend direction and smo
FREE
Binary Prediction: The Ultimate Decision Support Tool for Binary Options Traders Binary Prediction is a meticulously developed indicator tailored specifically to meet the demands of Binary Options trading. It is designed to simplify complex market analysis, providing clear, reliable trading signals for both novice and experienced traders looking to enhance their decision-making process. Core Features & Advantages: Dedicated Binary Options Algorithm: The core logic is fine-tuned to capture cruc
FREE

KEYPAD SUPPORT RESISTANCE LOGIC MT5 Advanced Cluster-Based Support & Resistance • Multi-Timeframe Confirmation • Smart Market Analysis Stop relying on ordinary horizontal lines and isolated support/resistance levels. KEYPAD SUPPORT RESISTANCE LOGIC MT5 is an advanced technical-analysis indicator designed to help traders identify important support clusters, resistance clusters, market structure, trend direction, momentum and multi-timeframe confluence from one organized MT5 dashboard. Instead of
FREE

SnR Fresh Unfresh Level by RWBTradeLab
A clean, non-repainting Support & Resistance level tracker for MetaTrader 5 that shows you the ONE thing most level indicators hide: which levels are still FRESH (untested) and which are already UNFRESH (rejected). Every level is tracked live, state by state, from CLOSED candles only.
What This Indicator Does
The indicator creates SnR levels from 2-candle sequences and then tracks each level's state continuously:
Level Creation (Level = 1st candle Clos
FREE

Stop Switching Timeframes! Are you tired of constantly clicking back and forth between timeframes just to check key levels? Sniper Multi-SR is the ultimate multi-timeframe dashboard designed for traders who demand precision, clarity, and speed. This indicator plots critical Support and Resistance levels from your selected timeframes directly onto your active chart. It gives you a "Sniper's View" of the market, allowing you to identify institutional-grade levels at a glance without cluttering you
FREE

High Time Candlestick Chart Visualize the current higher-timeframe candle directly on your lower-timeframe chart. This indicator projects the OHLC data of a selected higher timeframe (M15, H1, H4, D1, or W1) onto your current chart as a graphical candlestick, offset to the right of the live price area. It helps you keep the bigger-picture candle structure in view without switching timeframes. Features Graphical HTF candle : Body, upper wick, and lower wick drawn as chart objects, colored by bu
FREE
The indicator that shows the countdown to the change of candles is equipped with an alert when the bar changes (the alert is not active if installed on the M1 time frame). Displays seconds if installed in time frame M1, displays minutes and seconds if installed in time frame above M1, and displays hours and minutes if installed in time frame h1 and above. The time displayed is calculated based on the running time.
FREE

WaveForce Linreg Channel draws a linear regression channel on the last N bars, with deviation bands at ±1σ and ±2σ (TradingView-style layout). Features Center regression line ±1σ solid bands, ±2σ dotted bands Adjustable lookback (20–2000 bars) Adjustable σ multipliers, colours and width Optional ray to the right Optional chart label (off by default) How to use Attach to any chart. Set the number of bars for the channel. Tune ±1σ / ±2σ multipliers if needed. Note
This is an analytical tool, not
FREE

"Inside Bar PA" is a technical indicator for the MetaTrader 5 platform, designed to automatically detect the Inside Bar pattern on the chart. An Inside Bar is a candle whose high and low are completely within the range of the previous candle (mother bar). This pattern often signals market consolidation and can precede a strong price movement.
Features:
• Automatic detection of all Inside Bars on the chart • Visual marking with arrows: green up arrow for bullish Inside Bars (close >= open), gr
FREE

이 버전은 현재 MT5 빌드에 맞춰 재구축 및 확장된, 적극적으로 유지 관리되고 있는 릴리스입니다.
가격이 새로운 스윙을 형성할 때마다 피보나치 되돌림선을 수동으로 다시 그리는 작업은 시간이 많이 소요될 뿐만 아니라, 도구를 잘못된 고점이나 저점에 고정시켜 버리기 쉽습니다.
Phoenix Auto Fibonacci Monitor는 이러한 수동 단계를 제거합니다. 이 도구는 상위 시간대의 피벗 및 ATR 검증을 통해 주된 시장 스윙을 자동으로 식별하고, 되돌림 수준을 표시하며, 새로운 스윙이 형성될 때마다 이를 지속적으로 업데이트하므로 차트의 수준은 사용자가 마지막으로 그렸던 것이 아니라 항상 현재의 가격 구조에 맞춰집니다.
어떤 지표도 어떤 조정 국면이 유지될지 알려줄 수는 없습니다. 이 제품이 제공하는 추가 기능은 ‘레벨 인텔리전스 패널’로, 기존 레벨 중 실제로 신뢰할 만한 것이 무엇인지 파악할 수 있게 해줍니다.
오토 피보나치 모니터의 차별점은 무엇일까요?
누구나 피
FREE

Alpine Volume Profile See where the real volume traded — not just where price moved. Alpine Volume Profile is an MQL5 indicator that transforms raw tick or exchange volume into a clean, readable horizontal histogram directly on your chart. Instead of a single volume bar at the bottom of the screen, you get a full breakdown of which price levels attracted the most trading activity, session by session. What It Does For every day, week, or fixed block of bars you choose, Alpine Volume Profile build
FREE

Magnet Wall 지표는 MetaTrader 5용 ATR 기반 비리페인트 추세 밴드 시스템입니다. 이 지표는 가격 위와 아래에 두 개의 적응형 밴드를 그려, 추세가 유지되는 동안 가격을 그 안에 가두는 일종의 “자기벽”처럼 동작하며, 벽이 돌파되는 순간 방향이 반전됩니다. 캔들과 밴드는 활성 추세 방향에 따라 자동으로 색상이 바뀌고, 추세가 반전되는 시점에 매수 또는 매도 신호가 확정됩니다. 지표는 배수를 설정할 수 있는 Wilder ATR을 기반으로 하며, 일반적인 Supertrend가 아닌 비대칭 돌파‑앵커 알고리즘을 사용하고, 팝업, 푸시 알림, 이메일, 사운드를 모두 지원하는 완전한 알림 패키지를 제공합니다. MT4 버전 보기: Magnet Wall MT4 더 많은 제품 보기: 전체 제 품 실계좌 예제와 신규 도구를 확인하려면 프로필을 방문해 친구 요청을 보내고, 최신 업데이트를 놓치지 마세요! 동작 방식 비대칭 ATR 추세 밴드 각 마감 봉이 형성될 때마다 지표는
FREE

5 & 6 CANDLE PATTERN SCANNER DASHBOARD PRO MT5 Ultimate Multi-Symbol & Multi-Timeframe Price Action Scanner with Built-in ATR Risk Engine & 17 Quantitative Confluence Filters
PRODUCT SPECIFICATION Product Type: Quantitative Technical Indicator & Market Scanner Operating Framework: Non-Repainting Price Action Exhaustion & Breakout Engine Platform Compatibility: MetaTrader 5 (MT5 64-bit Architecture, Build 3800+) Asset
FREE

Fibonacci MT5 Converted from MT4, Optimized MT5 Version. original MT4 code by Awran5. Non-Repainting Fibonacci Tool for MT5. Fibonacci indicator with a stable non-repainting swing detection engine. Support and questions via MQL5 product comments. For questions, updates, and to connect with other traders, join my official MQL5 group ForexEAandMore
Main Functions Custom Swing Detection Uses proprietary Reverse-Scan plus Peak-Climbing algorithm to find reliable swing highs and lows without repai
FREE

Frato VWAP Bands — 거래량 가중 평균 가격(VWAP) 및 표준 편차
Frato VWAP Bands는 기존의 VWAP에 동적 변동성 밴드를 결합한 지표입니다. 거래량 가중 평균 가격을 여러 기간에 걸쳐 보여줍니다.
주요 기능:
이 지표는 VWAP(거래량 가중 평균 가격)를 계산하고 표준 편차를 기반으로 최대 3개의 상한 및 하한 밴드를 표시합니다. 계산은 선택된 각 기간(시간봉, 4시간봉, 일봉, 주봉, 월봉) 시작 시 초기화되므로 일중 및 장기 추세 분석에 활용할 수 있습니다.
표준 편차 밴드는 VWAP 계산에 사용된 것과 동일한 거래량으로 가중치가 부여됩니다. 따라서 시장 활동에 민감하게 반응하여 평균에서 벗어난 가격 움직임과 잠재적인 반전 영역을 파악하는 데 도움이 됩니다.
해석 가이드: VWAP 선은 가중 평균 가격의 기준선으로 자주 사용됩니다. VWAP 위에서의 거래는 매수 압력을, 아래에서의 거래는 매도 압력을 나타냅니다. 밴드는 동적 기준 레벨 역
FREE

Auto Candle Sequence Counter – MT5 인디케이터
개요 Auto Candle Sequence Counter 는 MetaTrader 5용 전문 인디케이터로, 연속되는 강세 및 약세 캔들을 자동으로 탐지하고 표시합니다. 수동으로 캔들을 세는 대신, 실시간 시각화, 통계 및 알림 기능을 제공하여 트레이더의 가격 행동 전략을 지원합니다.
주요 기능
연속 2~7개의 강세/약세 캔들 감지
정확한 매핑으로 신호 누락 방지
Doji 탐지 (민감도 0.01–0.10 조정 가능)
약하거나 불필요한 캔들 필터링
전문적인 시각화 (녹색 = 강세, 빨강 = 약세, 노랑 = 도지)
실시간 통계 패널 (강세/약세 시퀀스 수)
알림 시스템: 팝업, 소리, 모바일 푸시
장점
추세 지속 또는 피로 신호를 신속하게 파악
수요공급, 지지/저항, SMC 전략과 결합 가능
스캘핑, 스윙, 데이 트레이딩에 적합
수동 계산 대신 자동화로 시간 절약
설정
시퀀스 임계값: 2–
FREE

The US Dollar Index on your chart, built live from your own broker's six currency pairs. The dollar index is the cleanest read there is on whether the dollar itself is moving, or whether it is the other side of your pair doing the work. When EURUSD falls you cannot tell from EURUSD alone whether the euro is weak or the dollar is strong. The index tells you. Put it under any chart and you are looking at the dollar on its own terms. It replicates the ICE US Dollar Index, widely quoted as DXY. Same
FREE
Koryu Delta Koryu Delta is a MetaTrader 5 indicator. It identifies trend reversal points using pivot point analysis and delta volume data. It detects Market Shift patterns and shows signals based on market dynamics. This tool can be used by traders who scalp, swing trade, or invest long-term. It analyzes up to 500 historical bars to find past patterns. It uses closed-bar logic for signals. Features of Koryu Delta Pattern Detection : It identifies bullish and bearish Market Shift patterns using
FREE

RSI Assistant MT5 – 고급 RSI 트레이딩 도구 주요 기능 스마트 RSI 시각화 – 부드러운 색상 영역으로 과매수 및 과매도 구간을 명확하게 표시 고급 신호 감지 – RSI 구간 강도(70, 80, 90 / 30, 20, 10)에 따라 서로 다른 색상의 상승 및 하락 화살표 표시 구간 기반 알림 – RSI 신호 강도에 따라 서로 다른 알림 제공 멀티 타임프레임 RSI 패널 – 인터랙티브 버튼으로 M15, M30, H1, H4의 RSI 값을 확인 동적 상태 버튼 – 버튼 색상이 자동으로 변경되어 과매수(빨강) 및 과매도(초록) 상태 표시 프로 버전 제공 – 16개 이상의 트레이딩 전략 -> Strategy Assistant 지금 사용해보기 최신 정보 받기 – MQL5 커뮤니티 @hdtradinglab 채널 에 참여하여 업데이트 및 무료 도구 확인 개요 RSI Assistant MT5는 전통적인 RSI 분석을 향상시키기 위해 설계된 강력하고 완전히 무료인 지
FREE

Harmonic Sniper Pro – The Ultimate Harmonic Pattern Scanner Unlock the power of precision geometric trading with Harmonic Sniper Pro. This professional-grade indicator automatically detects high-probability harmonic patterns (Gartley, Bat, Butterfly, Crab, Shark, Cipher, and ABCD) with AI-powered filtering and advanced trade management features. Designed for both scalpers and swing traders, Harmonic Sniper Pro eliminates the guesswork by providing clear entry zones, stop losses, and take profit
FREE

순가격 변화를 봉 간 변화 절대값의 합으로 나눈 값으로, 0(순수한 노이즈)부터 1(완벽한 추세)까지입니다. 추세 전술과 레인지 전술 중 선택하는 데 도움이 됩니다. 주요 기능 마감된 봉에서 계산되며, 값이 리페인트되지 않음 모든 심볼과 타임프레임에서 작동 모든 기간, 레벨, 색상을 입력값에서 변경 가능 최대 봉 수 설정으로 가벼운 리소스 사용 자체 Expert Advisor에서 사용할 수 있는 버퍼(iCustom) 버퍼 0 효율 비율, 1 색상(0 추세, 1 중립, 2 노이즈). 입력값 효율 비율: 기간, 이 값 위면 추세, 이 값 아래면 노이즈. 표시: 계산할 최대 봉 수. 참고 이 제품은 분석 도구입니다. 거래를 실행하지 않습니다.
FREE
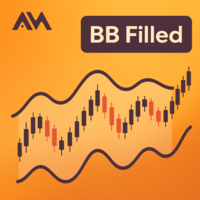
A clean Bollinger Bands indicator with single-color filling designed to reduce chart clutter. What is This Indicator? This is a Bollinger Bands technical indicator designed with visual simplicity in mind. Unlike standard Bollinger Bands implementations that display multiple colored lines and bands, this indicator uses a single-color filled area to represent the trading bands. This approach minimizes visual clutter while maintaining full functionality for technical analysis. How It Works The ind
FREE

무료 — 28개 주요 크로스 페어 전체를 기반으로 계산하여, 8개 주요 통화(USD, EUR, GBP, JPY, AUD, NZD, CAD, CHF)의 강약 순위를 차트에 표시하는 통화 강도 지표입니다.
100% 무료이며 어떠한 제한도 없습니다. 이 도구가 여러분의 차트에 자리 잡게 된다면, 짧은 리뷰 하나가 저희에게 가장 큰 도움이 됩니다 — 30초면 충분하고, 다른 트레이더들이 이 도구를 발견하는 계기가 됩니다.
플랫폼: MetaTrader 5 전용 — MetaTrader 4 버전은 없습니다.
대부분의 "강도" 지표는 계산 공식을 숨깁니다. 이 지표는 의도적으로 단순하게 만들었습니다: 8개 주요 통화 간 28개 페어 각각에 대해 설정한 룩백 기간의 변화율을 측정한 뒤, 각 통화가 나머지 7개 통화 대비 얻은 등락을 평균합니다. 강한 통화는 순위 상단으로 올라가고, 약한 통화는 하단으로 가라앉습니다. 스무딩 트릭도, 블랙박스도 없습니다.
=== 표시 내용 ===
- 8개 주요
FREE

Volumeshadow – CVD 다이버전스 지표 Volumeshadow 는 **누적 거래량 델타(Cumulative Volume Delta, CVD)**를 가격 차트에 직접 표시하여 매수세와 매도세의 균형을 한눈에 확인할 수 있도록 합니다. CVD는 각 캔들에 컬러 그림자 형태로 시각화되어 잠재적인 CVD 다이버전스를 쉽게 파악할 수 있습니다. 이 지표는 **틱 거래량(Tick Volume)**을 기반으로 하며, 특히 Forex 및 CFD 트레이더가 **오더플로우(Order Flow)**와 유사한 정보를 효율적으로 분석할 수 있도록 설계되었습니다. 주요 특징 • CVD를 메인 차트에 직접 표시 (별도의 보조창 불필요)
• CVD 다이버전스를 조기에 확인 가능
• 틱 거래량 기반으로 Forex 및 CFD 트레이더에게 최적화
• CVD는 매일 초기화
• 확정된 캔들에서만 표시되어 리페인트가 발생하지 않음 (No Repaint)
• 깔끔하고 직관적인 시각화로 효율적인 시장 분석
FREE

HTF Candles Nika는 MetaTrader 5의 현재 차트에 상위 타임프레임의 캔들을 실물 크기로 직접 오버레이하여, 차트를 전환하지 않고도 멀티 타임프레임 뷰를 제공합니다.
주요 기능
- 상위 타임프레임 캔들을 현재 차트에 심지 포함 채워진 직사각형으로 표시 - 표준 캔들스틱 및 Heiken Ashi 표시 모드 지원 - 현재 HTF 캔들이 마감될 때까지 남은 시간을 실시간 카운트다운으로 표시 - 상승 및 하락 캔들 색상 사용자 지정 가능 - 자동 또는 수동 캔들 너비 조절 - 심지 너비, 폰트, 폰트 크기 및 텍스트 위치 오프셋 설정 가능 - 모든 심볼 및 타임프레임 조합에서 작동 - 세션 갭을 자동으로 감지하여 렌더링 조정 - 경량 — 차트 오브젝트만 사용, 인디케이터 버퍼 없음
입력 파라미터
표시 설정 - Max Lookback — 표시할 HTF 바 수 (기본값: 500) - Timeframe — 표시할 상위 타임프레임 (기본값: H1) - Bars Mode —
FREE

'KS Smart FVG With Volume Feature'는 MetaTrader 5용 Fair Value Gap(FVG) 지표로, 기존의 FVG 감지 기능에 거래량 가중 분석을 결합하여 갭(gap)의 강도를 더 명확하게 파악할 수 있도록 돕습니다.
핵심 개념
이 지표는 Fair Value Gap(FVG), 즉 캔들 1의 고가와 캔들 3의 저가(또는 그 반대) 사이에 캔들 범위로 인한 공백(gap)이 생기는 가격 불균형 구간을 식별합니다. 이러한 갭은 종종 가격을 끌어당기는 자석(magnet) 역할이나 지지/저항 구간으로 작용합니다.
주요 기능
1. 거래량 가중 FVG 색상 표시 (핵심 기능)
변동을 유발한 캔들(FVG 패턴의 중간 캔들)의 거래량을 분석합니다.
설정된 기간(InpVolMAPeriod)의 평균 거래량과 비교합니다.
각 FVG를 다음과 같이 분류합니다:
강함 (높은 거래량)
보통 (평균 거래량)
약함 (낮은 거래량)
상승(UP) 및 하락(DOWN)
FREE
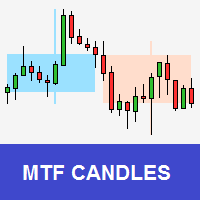
Tool that allows viewing candles in multiple timeframes. This way, it helps the analysis in multiple timeframes.
This is another product developed by Renato Fiche Junior and available to all MetaTrader 5 users!
Input Parameters
- Option 1 - TimeFrame: Standard MT5 timeframe - Option 2 - Custom TimeFrame (in minutes): Or, if this value is different from zero, the timeframe will be customized. This allows you to choose timeframe other than the MT5 standard. - Total Candles: Number of candles. -
FREE

Volume Profile Delta — Indicator for MetaTrader 5 Volume Profile Delta is an indicator that displays the difference between buying volume and selling volume recorded on each bar, represented as a histogram at the bottom of the chart. What this indicator does On each bar it calculates the difference between the volume associated with upward movements and the volume associated with downward movements. The result is shown as a bar in the lower histogram, making it possible to observe whether buying
FREE

Choppiness Index는 시장이 추세 중인지(낮은 값) 횡보 중인지(높은 값)를 측정하며, 전통적인 38.2 및 61.8 레벨을 함께 표시합니다. 주요 기능 마감된 봉에서 계산되며, 값이 리페인트되지 않음 모든 심볼과 타임프레임에서 작동 모든 기간, 레벨, 색상을 입력값에서 변경 가능 최대 봉 수 설정으로 가벼운 리소스 사용 자체 Expert Advisor에서 사용할 수 있는 버퍼(iCustom) 버퍼 0 Choppiness Index. 입력값 Choppiness: 기간. 표시: 계산할 최대 봉 수. 참고 이 제품은 분석 도구입니다. 거래를 실행하지 않습니다.
FREE
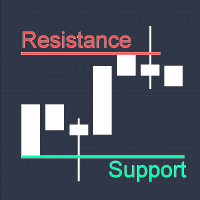
True Support Resistance Indicator: Your Ultimate Tool for Precise Trading Decisions Quick Overview It's a simple indicator that elevates your trading strategy. True Support Resistance Indicator is a powerful tool designed to identify key support/resistance levels in real-time. Experience clean visuals, instant alerts on breakouts, and dynamic updates that keep you ahead of market movements. Why Choose True Support Resistance Indicator? 1. Simplicity Meets Precision - Two clearly colored
FREE

TV MACD Pro + SNR Support/Resistance is a professional trading tool that combines TradingView-style MACD with adaptive Support & Resistance detection.
This indicator includes two core modules that can be turned on or off independently.
MACD Module: Features authentic TradingView MACD color scheme, teal/red histogram with volume and shrinkage differentiation. Adjustable parameters include Fast EMA (default 12), Slow EMA (default 26), Signal SMA (default 9), and histogram scale.
SNR Module: Au
FREE

Blahtech VWAP - Volume Weighted Average Price (VWAP) is the ratio of price to total volume. It provides an average price over a specified time interval. Links [ Install | Update | Documentation ] Feature Highlights
Configurable VWAP Line Sessions, intervals, anchored or continuous Previous day settlement line Standard Deviation bands Alerts at bar close or real time Automatic Broker or Tick volumes Significantly reduced CPU usage
Input Parameters
Expert Advisor Mode - Reserved for iCu
FREE

Price breaks out. You want the continuation, but the entry usually comes too early, too late, or directly into a weak pullback.
Without structure, most traders can see the move but still cannot define where the retracement remains healthy and where the setup starts to fail.
Pullback Execution Map turns the current swing into a visual execution plan on the chart and a pullback meter below price. What it shows: Fibonacci execution pocket: Maps the active swing with a clear pullback pocket from the
FREE
This indicator shows the breakeven line level for the total number of open positions of the current symbol with P/L value and total volume. This indicator is helpful to decide the exit level when using a trading grid strategy. The style of the breakeven line is customizable to choose the color, line shape and font size of the positions description. Send mobile notification when crossing a positive P/L target
FREE

AI Anchored VWAP Indicator plots the Volume-Weighted Average Price anchored automatically to your chosen reference point - session, day, or week - with statistical deviation bands, giving you a dynamic fair-value line that institutional traders use constantly but that most retail platforms only offer in a manual, click-to-anchor form. KEY FEATURES
- Fully automatic anchoring: choose Session, Day, or Week and the indicator recalculates the correct anchor point on every new period without any manu
FREE

AI Multi Timeframe Trend Dashboard shows the trend direction of six timeframes at once - M15, M30, H1, H4, D1 and W1 - in a single, always-on-chart panel, so you never have to flip through charts to check higher-timeframe alignment before entering a trade. The indicator compares a fast and slow EMA on each of the six timeframes independently and displays a clear UP, DOWN or FLAT reading for every one of them, color-coded for instant recognition. Trading with the trend across multiple timeframes
FREE
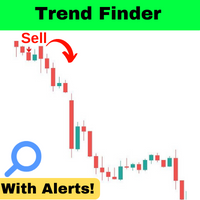
이 표시기를 사용하여 시장 내 개발 동향에 대한 경고를 받으십시오.
이 표시기를 사용하여,당신은 그들이 개발 시장에서 개발 동향에 대한 경고를 얻을 수있을 것입니다. 이 표시기는 추세 내의 항목 또는 종료를 식별하는 데 사용할 수 있습니다. 이 표시기는 더 높은 시간대의 정보를 현재 시간대의 가격 움직임과 결합하여 구매 또는 판매 신호를 출력합니다. 표시기는 추세 변화 또는 지배적 인 추세의 연속을 식별 할 수 있습니다.
참고:추세 다음 낮은 승리 비율을 가지고 있지만,추세의 수익률은 평균 손실의 3~5 배 크기가 될 수 있습니다. 간단한 설정 드래그 앤 언제든지 프레임에,어떤 차트에 놓습니다. 경고 사용(선택 사항) 그리고 당신은 완료! 시각 및 오디오 경고 휴대 전화로 직접 전송 경고 터미널로 전송 경고 팝업 다중 사용 주식,외환,옵션,선물 유연한 모든 시간 프레임에서 작동
FREE

Premium trend entry pro TZ Trade Logics, presents you, the enhance version of Premium trend entry This release, bring you much more relaxed trading state with advanced features for trend filtering and premium signal entry timings. For us, is not the creating of the product which matters! but continued maintenance and education to users. through our dedicated means of reaching to us, you will enjoy close guide on how to use the product and other relevant training related to trading. This tradi
FREE

Trading can be quite tiring when you need to look at several things at the same time.
Format of candles, supports, resistances, schedules, news and indicators.
This tool aims to facilitate the analysis of the ADX indicator. It colors the candles based on the levels of the indicator and the DI lines.
The period, the limit of the indicator and the colors of the candles are customizable. You can also place a visual aid on the lower right side of the graph to view the values of ADX, DI + and DI-
FREE
The Stochastic Momentum Index (SMI), developed by William Blau and featured in the January 1993 edition of Technical Analysis of Stocks & Commodities magazine, introduces a unique perspective to trading analysis. Distinguished from the conventional Stochastic Oscillator, which evaluates the current close in relation to the recent x-period high/low range, the SMI assesses the close's position relative to the midpoint of this range. This innovation yields an oscillator with a range of +/- 100, re
FREE

POI Detector – Automatic Smart Money Points of Interest (POI) Structure Identifier The POI Detector is a MetaTrader 5 indicator developed for traders who use Smart Money Concepts (SMC) and Price Action methodologies. It automates the identification of relevant Points of Interest (POIs) on the chart through strict detection of the ABCD pattern with growing legs and C-Level breakout confirmation (DE extension). Key Features ABCD Pattern Detection Algorithm: Identifies complete structures where
FREE
스타일이 중요하기 때문에 촛불의 색상, 배경을 밝거나 어둡게 변경하고 격자를 넣거나 제거하기 위해 매번 속성을 클릭하는 것이 얼마나 성가신 일인지 압니다. 클릭 한 번으로 해결하는 방법은 다음과 같습니다. 차트에서 그리드를 표시하거나 숨기는 버튼 1개. 트레이더가 원하는 캔들 스타일을 선택할 수 있는 3개의 맞춤형 버튼. 주간 모드와 야간 모드 사이를 전환하는 버튼 1개. *****설정에서 화면에서 버튼을 표시할 위치를 선택할 수 있습니다.*** 내 다른 제품을 확인하는 것을 고려하십시오 https://www.mql5.com/en/users/javimorales.fer/seller 스토캐스틱 RSI란 무엇입니까? 스토캐스틱 RSI(StochRSI)는 0과 1(또는 일부 차트 플랫폼의 경우 0과 100) 범위의 기술적 분석에 사용되는 지표이며 스토캐스틱 오실레이터 공식을 상대 강도 지수(RSI) 값 세트에 적용하여 생성됩니다. 표준 가격 데이터보다 작가 트레이딩 알고리즘의 창시자 하비
FREE
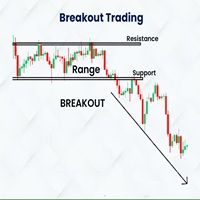
Indicador Basado en la estrategia de ruptura del rango de londres de Amaury Benedetti.
Este indicador dibuja automaticamente el rango, el maximo y minimo y sus correspondientes lineas de stoploss, entrada y takeprofit.
SE RECOMIENDA USAR EN M1 EN EL US30 (DE ACUERDO A LA ESTRATEGIA)
Los valores se pueden modificar de acuerdo a la necesidad del usuario, tambien se tienen mas configuraciones para dibujar cualquier rango en diversos horarios y con diferentes configuraciones de sl, tp, etc
Detal
FREE

======================================================== GOLD WAVE LEVELS (ELLIOTT-ALIGNED) - MQL5/MT5 MARKET DESCRIPTION (formatting: **bold** = Bold button; lines with • = bullet list; UPPERCASE = heading) ========================================================
OVERVIEW ------------------------------------------------------- **Gold Wave Levels** draws a tested wave backbone for gold and validates signals against **Elliott theory hard-rules**, with higher-timeframe context and per-timeframe
FREE

Volume Profile Density V2.40 가격 수준별 거래량 분포를 표시하여 기관 투자자의 관심 구간을 보여줍니다.
시간 기반 거래량과 달리, 실제 거래가 집중된 위치를 보여줍니다. 기본 원리: 수평 막대 = 가격별 거래량 막대가 길수록 거래량이 많음 빨간 구간 = 주요 지지 / 저항 구간 주요 사용 목적: 실제 지지선과 저항선 식별 POC (Point of Control) 확인 가치 영역 (총 거래량의 70%) 설정 낮은 거래량 구간을 손절 / 목표 지점으로 활용 색상 코드: 파란색 = 낮은 거래량 (빠른 이동 구간) 노란색 = 중간 거래량 (균형 구간) 빨간색 = 높은 거래량 (기관 매매 구간) 트레이딩 전략: 빨간 구간 반등 시 매수 VAH 또는 빨간 구간 저항 시 매도 거래량 동반 POC 돌파 시 진입 POC 회귀 시 재진입 파란 구간을 목표로 설정 설정: 초보자: 1.0 / 100% / 1.0 스캘핑: 0.5 / 200% / 0.5 스윙: 2.0 / 50% / 1
FREE

If you love this indicator, please leave a positive rating and comment, it will be a source of motivation to help me create more products <3 What is Schaff Trend Cycle indicator? The Schaff Trend Cycle (STC) is a technical analysis indicator used in trading and investing to identify trends and generate trading signals. The STC is designed to identify trends and trend reversals by measuring the strength of the trend and the speed of price changes. The STC indicator helps to identify trends in a
FREE
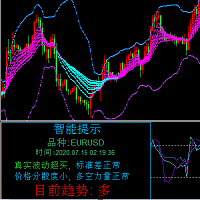
这是一个组合指标分析趋势、支撑阻力、买卖点。运用了均线MA、布林带、KDJ、CCI、RSI。
主图上下线是布林带上下线,采用的是20周期和2.3标准差可以用来支撑阻力。 中间的是分析趋势的均线,趋势分析是用均线多周期: 为涨趋势,反之为下跌趋势。在同一种颜色,基本说明趋势没有发生变化。 子图是由 KDJ、CCI、RSI三个指标组成,大于70超买,小于30超卖, 智能提示是运用了算法,主要计算布林带, KDJ、CCI、RSI指标
有三个或四个指标超出市场常态就会发出提示行情可能反转。 子图指标运用了很多数据,刚刚开始加载会有点慢,耐心等待就可以 这个指标是子图指标,还要再下我发布的MMB分析,这样就刚刚好组成一套分析
电脑分辨率的文本大小请设置100%,不然字体会不一样
FREE

Fimathe Market Opening — MT5 시각적 백테스트 지표 차트에서 Fimathe 채널 돌파를 직접 분석하세요. Fimathe Market Opening은 과거 신호를 재구성하고 통계를 제공하여 설정, 목표가, 손절 후 반대 방향 진입 사용 여부를 비교할 수 있도록 도와줍니다. 수동 차트 분석을 체계적인 시각적 연구로 전환하는 도구입니다. 주요 기능: • 캔들 수를 설정할 수 있는 오프닝 채널 자동 생성, C1 투영 및 지정한 크기 기준에 따른 채널 분할.
• 진입, 손절, TP1, TP2 및 결과를 차트에 표시.
• 채널 높이의 배수 또는 거래 초기 위험의 배수를 사용하는 두 가지 목표 계산 방식.
• 손절 후 선택적으로 한 번의 반대 방향 진입을 분석하며, 목표를 별도로 설정 가능.
• 최초 진입, 반대 방향 진입 및 전체 결과를 구분하여 표시.
• 익절, 손절, 일일 종료 시 수익·손실·손익 0, 미종료 신호 및 판정 불가 사례 집계.
• 익절 평균 가
FREE

Meridia Sessions는 Meridia Session Suite의 기본 버전입니다. 하위 타임프레임에 H1 캔들을 그리고 현재 H1 캔들 마감까지의 카운트다운을 표시하며, 아시아, 런던, 뉴욕 세션을 고가와 저가가 표시된 박스로 그립니다. 모든 시간 변경을 따라가는 세션 각 세션은 자체 시간대(중부 유럽, 런던, 뉴욕, 도쿄, 시드니, UTC 또는 서버 시간)를 가지며 서머타임은 매년 자동으로 적용되므로, 시간이 바뀔 때마다 박스가 올바른 위치에 유지됩니다. 브로커 서버의 시간 차이는 자동으로 감지됩니다. 패널 클릭 한 번으로 H1 캔들과 각 세션을 켜고 끕니다. 패널은 드래그 가능하고 가로 또는 세로 배치, 최소화가 가능합니다. 차트 문구는 영어, 이탈리아어, 스페인어, 포르투갈어를 지원합니다. 전략 테스터의 비주얼 모드에서도 작동합니다. 정식 버전 Meridia Session Suite는 M15, M30, H4, D1, W1 캔들, H1 50% 레벨, 관심 영역, 오프닝
FREE

CandlePulse Candle Timer MT5 shows the time remaining in the current candle, with a dashboard for up to four timeframes and optional candle-close alerts. Choose a full panel, a compact corner timer, or a countdown beside the latest candle. All features are included at no charge. There is no subscription, external account, or DLL requirement. Main features Multi-timeframe dashboard: monitor the chart timeframe plus up to three additional periods. Duplicate periods are combined into one row. Three
FREE

HiperCube Renko Candles에 오신 것을 환영합니다. 다윈엑스 제로 25% 할인 코드: DWZ2328770MGM 이 지표는 시장이 Renko Candle Style로 변환되는 실제 정보를 제공합니다.
정의 Renko 차트는 가격 변동을 측정하고 표시하는 재무 차트의 한 유형으로, 가격 변동을 나타내는 벽돌(또는 막대)을 사용합니다. 전통적인 캔들스틱 차트와 달리 Renko 차트는 시간 기반 정보를 표시하지 않고 가격 변동에만 초점을 맞춥니다.
기능: 별도 창의 지표 캔들 색상 사용자 정의 핍 단위의 캔들/벽돌 크기 사용자 정의 Chatgpt 와 AI를 사용하여 개발되었습니다. Renko를 사용한 예시 전략: 추세 식별 Renko 캔들로 풀백과 인클루핑을 기다림 진입 인클루핑의 SL 하위 위험 보상 TP 1:2, 1:3... 이것은 예시이며 기본 또는 새로운 전략이 될 수 있지만 실제 계정에서 사용하기 전에 시도하고 테스트해 보세요. 이 정보는 Renko 캔들 hi
FREE

Investment Castle Support & Resistance — Automatic Buy/Sell Levels
Stop drawing support and resistance by hand. This indicator maps the key Buy and Sell levels for you automatically and colours the candles by bias, so the side the market favours is obvious at a glance. It is the same Support & Resistance engine built into the Investment Castle EA.
What it does for you Automatic Buy/Sell levels: support and resistance are detected and plotted for you — no manual drawing. Colour-coded bias: cand
FREE

Introduction The Parabolic SAR (Stop and Reverse) indicator is a technical analysis tool designed to identify potential trend reversals and provide trailing stop-loss levels. This enhanced version of the standard Parabolic SAR for MetaTrader 5 offers improved visual clarity, customizable alerts, and an optional trend confirmation filter to assist traders in their analysis. Features Enhanced Visualization: Displays Parabolic SAR dots in two distinct colors (Lime for uptrends, Red for downtrends)
FREE

LT Volume은 MetaTrader 5용 기존 거래량 지표의 자연스러운 진화형입니다. 훨씬 더 지능적이고 역동적인 흐름 분석을 제공하도록 설계되었으며, 기존의 제한적인 막대 표시를 넘어 기관급 시장 해석을 강화할 수 있는 강력한 기능 세트를 제공합니다. 유동성을 추적하고 시장 소진 지점 또는 돌파 지점(breakouts)을 감지하는 데 이상적이며, 차트에서의 시각적 상호작용을 훨씬 더 부드럽게 만들어 줍니다.
주요 기능 유연한 거래량: 브로커가 제공하는 경우, 틱 거래량 또는 실제 시장 거래량 읽기를 지원합니다. 통합 이동평균: 거래량 히스토그램에 직접 적용되는 100% 사용자 지정 가능한 이동평균으로, 방향성 흐름을 추적할 수 있습니다. 고정 레벨: 고정된 알림 레벨을 설정하면 지표가 경고선을 표시합니다. 고빈도 전략 및 대형 시장 참여자 감지에 적합합니다. 최대 최적화: LT Volume의 코드는 가볍고 매우 높은 성능을 제공하여, 실시간 시장 속도와 관계
FREE

Sierra Capital Engulfing Detector identifies bullish and bearish engulfing patterns directly on your chart. Two optional filters help you focus on patterns that align with the EMA trend or form near support and resistance levels. A compact information panel displays the latest signal, filter status, trend direction and nearby support/resistance levels. This is a charting and alert indicator. It does not open, manage or close trades. WHAT YOU SEE ON THE CHART Green up arrows below bullish engulf
FREE

B Williams Divergent Bar The indicator searches for and marks Divergent Bars on the chart according to Bill Williams' methodology. What it shows: Green upward arrow — potential bullish reversal (Bullish Divergent Bar). Red downward arrow — potential bearish reversal (Bearish Divergent Bar). Signal logic: The indicator looks for bars with a large shadow in the direction of the reversal that update the local extremum (new local low or high), while being on the opposite side of the Alligator
FREE

Grebenka - помощник для разметки графика.
Функционал: 1. позволяет непрерывно рисовать линии ZigZag в ручном режиме, используя клики мышкой. 2. позволяет включать режим, при котором любая трендовая линия с которой в данный момент проводится манипуляция, выравнивается по горизонтали.
Горячие клавиши: [Z] - включение/выключение режима рисования линий ZigZag вручную [X] - включение/выключение режима горизонтальной трендовой линии [C] - быстрая смена цвета линий ZigZag [Del] - стандартная клавиш
FREE

상황에 맞는 가격 보기 Price Context Map은 일일, 주간 및 ADR(평균 일일 범위) 수준에 대한 무료 MetaTrader 5 지표입니다. 현재 세션과 가장 관련성이 높은 참조 가격을 하나의 깔끔한 차트에 표시합니다. 매일 시가, 이전 세션 극단 및 범위 경계를 수동으로 표시하는 대신 가격이 현재 어디에 있는지, 접근하고 있는지, 일반적인 일일 범위가 이미 얼마나 사용되었는지에 대한 구조화된 지도를 얻을 수 있습니다. 혼란스럽지 않고 명확하게 만들어졌습니다. 이 지표는 차트를 불필요한 도구로 채우지 않고 필수적인 맥락을 원하는 트레이더를 위해 설계되었습니다. 레벨은 카테고리별로 색상으로 구분되어 있으며, 라벨은 차트 오른쪽의 전용 영역에 배치되고, 가까운 라벨은 읽을 수 있도록 자동으로 간격이 지정됩니다. 일일, 주간 및 ADR 상황을 혼란스러운 차트 없이 원하는 임의적인 일중 거래 및 가격 변동 거래자 를 위해 설계되었습니다. 주요 수준 개요 매일 오픈 전일 고가, 저
FREE

## Описание
Индикатор SSL Hybrid является точной реализацией одноименного индикатора с платформы TradingView (автор: Mihkel00). Адаптирован для MetaTrader 5.
Индикатор относится к классу трендовых и предназначен для следования за ценой. Он объединяет в себе три уровня сигнальных линий SSL (Semaphore Signal Level), что позволяет не только определить направление тренда, но и находить точки входа, продолжения и выхода.
### Основное назначение
- Торговля по тренду на дневных и 4-часовых графика
FREE

G2 SMC System Indicator – Professional Smart Money Concepts Dashboard G2 SMC System Indicator is a comprehensive Smart Money Concepts (SMC) dashboard that analyzes H4, H1, M15, M5, and M1 timeframes simultaneously to deliver high-probability entry signals based on Market Structure, Fair Value Gaps (FVG), and Liquidity Sweeps . Core Logic – SMC + Multi-Timeframe Confluence Component Timeframe Function Trend Filter H4/H1 EMA 20/50 cross – defines macro direction SMC Structure M15 BOS /
FREE

In many strategies, it's quite common to use a scaled ATR to help define a stop-loss, and it's not uncommon to use it for take-profit targets as well. While it's possible to use the built-in ATR indicator and manually calculate the offset value, it's not particularly intuitive or efficient, and has the potential for miscalculations.
Features Configurable ATR offset Upper and Lower Band. configurable ATR scaling factor alternate(non-chart) ATR timeframe explicitly defined input types to improv
FREE

종합적인 트렌드 분석 및 거래 아이디어를 위한 "Demark Trends Indicator"의 강력함을 경험해보세요. Demark 지표는 시장 트렌드와 소진 지점을 평가하는 데 효과적으로 알려져 있습니다. 저희 Demark Trends Indicator는 이러한 전문성을 한 단계 더 높여, 자동으로 정확한 트렌드 라인을 차트에 그립니다. 캔들 수, 알람 설정, 라인 색상 등을 포함한 사용자 정의 가능한 매개 변수를 통해 분석에 완전한 제어력을 갖게 됩니다. 초보자든 경험이 풍부한 트레이더든 상관없이, 우리의 인디케이터는 트렌드 분석을 간단화하고 시간과 노력을 절약해줍니다. 다음과 같은 "Demark Trends Indicator"의 잠재력을 발휘하세요: 정확한 트렌드 식별: 자동으로 그려지는 정확한 트렌드 라인으로 시장 트렌드를 원활하게 분석합니다. 효율적인 거래 전략: 현재 트렌드 상태를 평가하고 정보에 기반한 거래 결정을 위해 잠재적인 소진 지점을 예측합니다. 사용자 정의 가능한
FREE

Darkstone Smart Concepts SMC V1.2 Smart Money Concepts Market Structure Indicator for MetaTrader 5 Darkstone Smart Concepts SMC V1.2 is a MetaTrader 5 indicator designed to display Smart Money Concepts market structure elements directly on the chart. The indicator provides automated visual analysis of: Break of Structure (BOS) Change of Character (CHoCH) Fair Value Gaps (FVG) Order Blocks Liquidity levels Displacement movements Premium and Discount zones The system is designed to help traders an
FREE
Quantum Channel Pro 는 가격 트렌드, 반전 지점 및 시장 노이즈를 정밀하게 식별하기 위해 설계된 혁신적인 멀티 채널 변동성 분석 도구입니다. 적응형 표준 편차 채널 기술을 적용하여 3가지 가격대(내부, 중간, 외부)를 동적으로 표시함으로써 트레이더가 시장 상태를 직관적으로 파악하고 고확률 거래 기회를 포착할 수 있도록 지원합니다. 주요 기능 3단계 스마트 채널 내부 채널(녹색) : 1σ 변동 범위, "정상 변동 구간" 표시 중간 채널(주황) : 2σ 변동 범위, "잠재적 반전 구간" 경고 외부 채널(빨강) : 3σ 변동 범위, "극단적 과매수/과매도" 신호 실시간 확률 통계
독자적인 "존 분석 시스템"이 각 채널별 가격 출현 빈도를 자동 계산하여 다음을 표시: 내부 채널 확률(정상 시장) 중간/외부 채널 확률(추세 가속화 단계) 외부 채널 돌파 확률(극단적 반전 신호) 적응형 시장 노이즈 필터링
동적 표준 편차 계산으로 외환, 주식, 암호화폐 등 다양한 자산의
FREE
MetaTrader 마켓은 과거 데이터를 이용한 테스트 및 최적화를 위해 무료 데모 거래 로봇을 다운로드할 수 있는 유일한 스토어입니다.
어플리케이션의 개요와 다른 고객의 리뷰를 읽어보시고 터미널에 바로 다운로드하신 다음 구매 전 트레이딩 로봇을 테스트해보시기 바랍니다. 오직 MetaTrader 마켓에서만 무료로 애플리케이션을 테스트할 수 있습니다.
