TickVolume Profile
- Indicators
- Version: 2.0

TickVolume Profile for MetaTrader 5
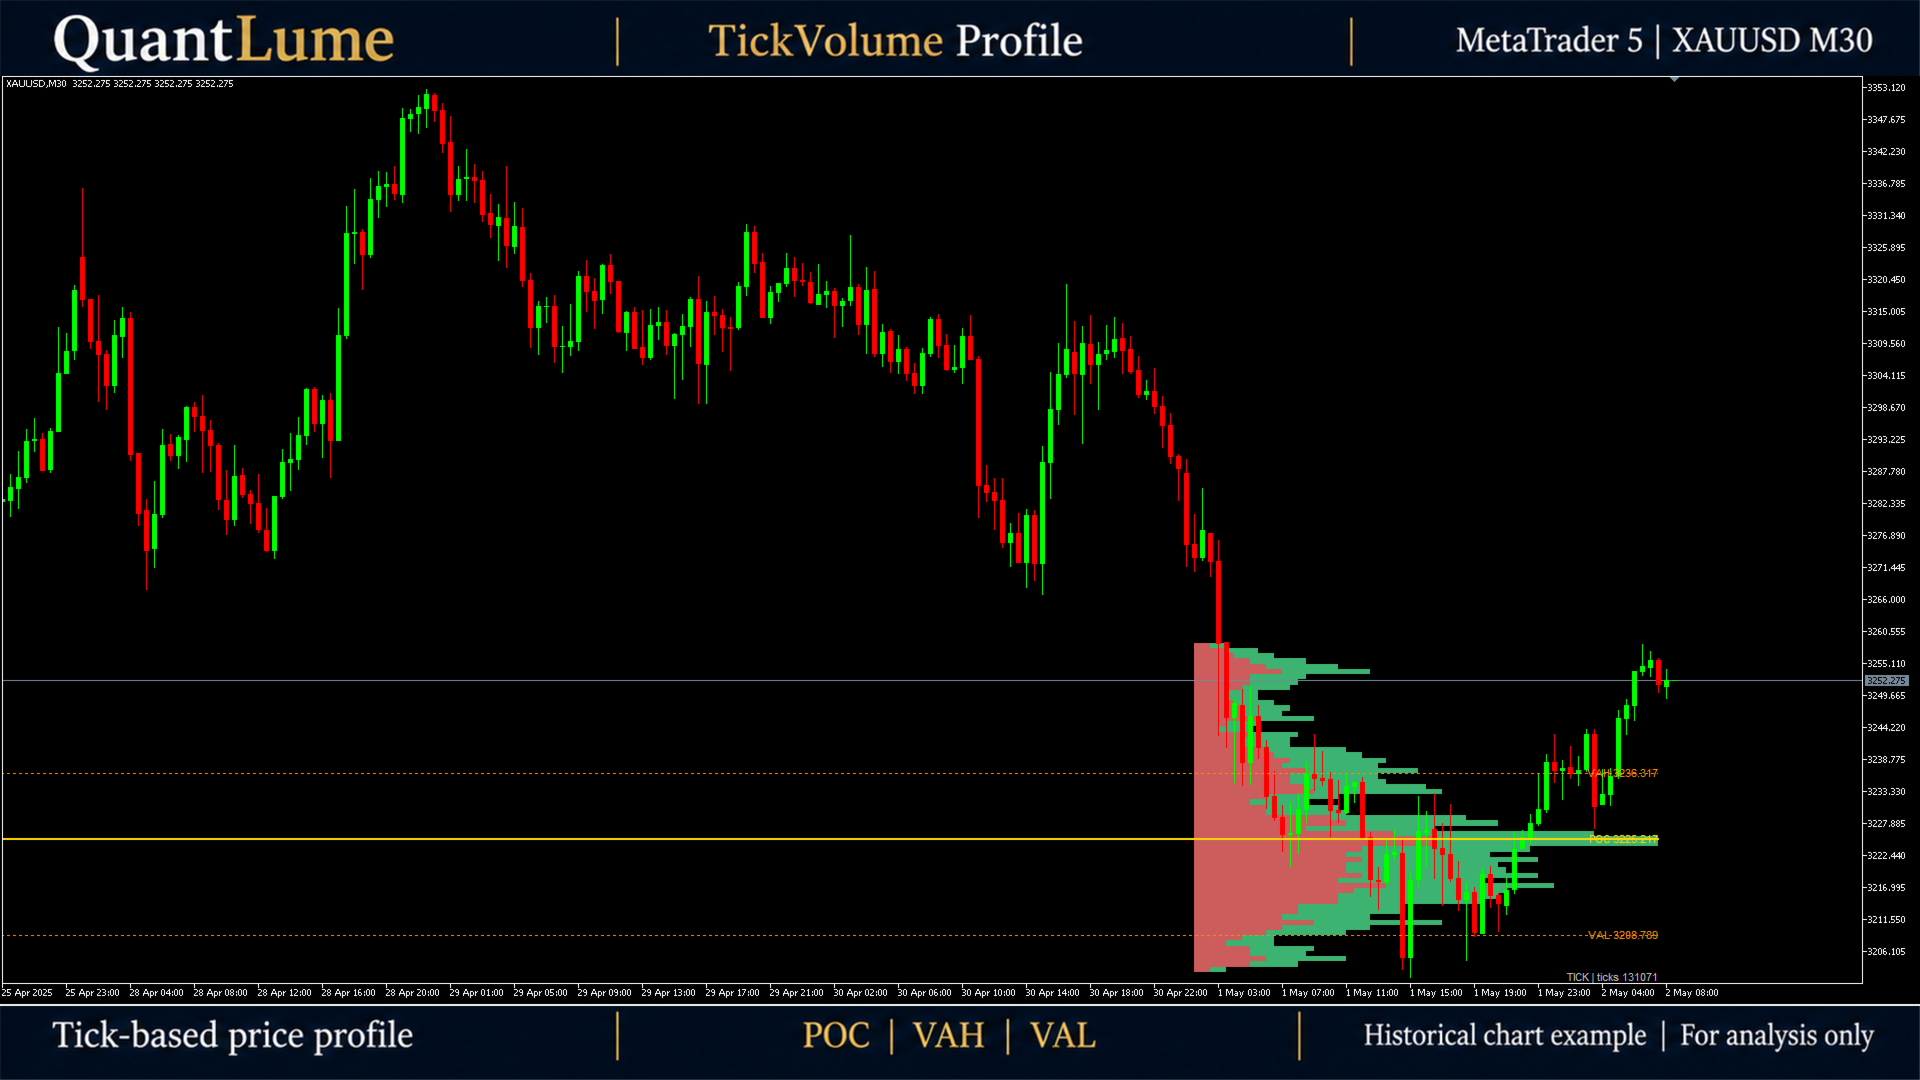
TickVolume Profile displays a rolling price profile built from the tick history available for the chart symbol. The histogram, Point of Control (POC), Value Area High (VAH) and Value Area Low (VAL) help you examine where activity is concentrated within a selected lookback. This is a free visual chart-analysis indicator, not an Expert Advisor, and it does not open or manage trades.
Profile and key levels
- Rolling lookback: uses chart bars rather than a fixed trading-session schedule. The default looks back over 300 completed bars.
- POC: the center of the price bin with the greatest accumulated weight.
- VAH and VAL: the upper and lower boundaries of adjacent bins selected around the POC until the configured value-area target is reached. The default target is 70%.
- Customizable display: adjust the number of price bins, histogram width, placement, colors and inferred up/down split.
- Data status: the chart label shows TICK or REAL/FALLBACK, the number of usable records, and TRUNCATED when the analysis uses only the most recent part of the retrieved history.
Understand the data
The default Tick mode gives each usable tick record a weight of one. Quote updates can be included: this is not centralized exchange volume and does not identify actual traded quantities. The example screenshots show historical XAUUSD charts; they are illustrations of the display, not trading recommendations or performance evidence.
The optional Real mode uses a record's positive volume_real value, otherwise its positive volume value, otherwise a weight of one. This fallback is applied per record and can mix reported volume with unit-weighted records. Version 2.0 does not filter this weighting to fresh trade events, so repeated volume fields in quote updates can affect the profile. Use Tick mode unless you understand and have checked your broker's feed. REAL/FALLBACK reports the number of records using reported volume and unit fallback; it is not a guarantee of exchange-volume accuracy.
Green/red split colors are inferred primarily from changes in the selected price. Buy/sell flags are consulted while direction has not yet been established. These colors are not verified aggressor buy/sell volume or bid/ask delta.
Levels depend on the broker's tick history, symbol, lookback, price source, bin size and analyzed-record limit. The rolling profile can change as its window changes; including the current bar allows intrabar changes. POC and value-area boundaries are descriptive, not guaranteed support, resistance, fair value or entry signals.
Inputs
- InpLookbackBars: chart-bar lookback; default 300, effective minimum 1.
- InpRows: number of price bins; default 64, effective range 8 to 500.
- InpVolumeType: Tick (default), or Real with the per-record weighting and limitations described above.
- InpPriceSource: Auto (default), Last, Bid, Ask or Mid. Auto uses a positive last price when the last-price flag is set, otherwise the bid/ask midpoint. Explicit sources use the available alternatives implemented by the indicator when the requested price is missing.
- InpValueAreaPct: target share of accumulated profile weight; default 70%, effective range 1% to 100%.
- InpIncludeCurrent: false by default; true includes the developing chart bar.
- InpMaxTicks: maximum most-recent records analyzed after history is retrieved; default 1,000,000, effective minimum 1,000. TRUNCATED means the full lookback may not be represented. This setting does not limit the initial history request.
- InpRefreshMs: minimum interval between successful refreshes on incoming ticks, apart from a new bar; default 1,000 ms, effective minimum 100 ms.
- InpMaxWidthBars: maximum histogram width in chart bars; default 60, effective minimum 5.
- InpRightShift: non-negative offset left of the newest chart bar; default 2.
- InpColUp, InpColDown, InpColPOC, InpColVA, InpColText: histogram, level and text colors.
- InpSplit: inferred up/down color split; true by default.
Installation and first use
- Install the product through the MetaTrader 5 Market using your MQL5 account.
- Find TickVolume Profile in the Navigator and attach it to a demo chart.
- Start with Tick mode and a modest lookback, then allow your broker's tick history to synchronize.
- Check the profile and status label before relying on any displayed level. Adjust the lookback, price bins and width to suit your chart.
No DLL access or automated-trading permission is required by this indicator. A large lookback can require substantial tick-history retrieval, memory and processing time. Reduce InpLookbackBars if the chart responds slowly. Reducing InpMaxTicks reduces the records analyzed, not the amount initially requested from history.
If history is missing or the usable price range is insufficient, a new profile may not be drawn. Existing objects or buffer values may remain from an earlier successful calculation, so do not treat a retained display as confirmation that it is current. The three calculation buffers correspond to POC, VAH and VAL; this release is intended for visual analysis, not a validated historical EA signal interface.
Support and risk
For support, use the product comments or MQL5 messaging. Never send passwords or trading-account access. Test on a demo account first. Chart analysis does not guarantee trading results, and trading can result in losses.