How to Start with Metatrader 5 - page 41
You are missing trading opportunities:
- Free trading apps
- Over 8,000 signals for copying
- Economic news for exploring financial markets
Registration
Log in
You agree to website policy and terms of use
If you do not have an account, please register
Free to Download from MT5 CodeBase
X-bars Fractals - allows drawing the so-called asymmetric fractals by displaying different number of bars on the left and the right of the extremum
-----------------
How to Use
Forum on trading, automated trading systems and testing trading strategies
Expert Advisors: Exp5-VirtualTradePad for mt5 v 4 (Contest version)
newdigital, 2014.05.10 12:02
The More Intelligent Trailing Stop
The Flaw in Trailing Stops
Trailing stops are a more advanced type of stop loss order that adjusts itself to a more favorable rate as a trade moves in our favor. The result is a reduced stop loss (reducing risk) that is based solely on how price moves. It is at that moment that a traditional trailing stop shows its flaw. The stop moves to a level based on how far a trade moves in our favor, rather than moving based on key price levels. All support and resistance analysis previously performed is thrown out the window as our stop moves freely to a random level X pips away from the currency pair’s high water mark.
Therefore our stop we set beyond the most recent swing low will suddenly move to a level above the swing low and be at much greater risk of being hit by a sudden downward whipsaw.
Trailing Stop Getting Whipsawed on USD/CNH :
Manual Trailing Stop
So what can we do about trailing stops’ tendency of getting stopped out too early, but still have the benefits of reducing our risk during the life of our trades? The secret is in manually trailing our stop losses ourselves, always basing our stops around support and resistance levels along the way. A rare example of having your cake and eating it too. Let’s take a look.
Manual Trailing Stop in an Uptrend :
The image above shows the same trade we placed on the USD/CNH, but with much better results. Rather than using a traditional trailing stop that blindly moved up as price moved up, we moved our stop only when a new swing low was created. We set our stop below each new swing low as price progressed and were able to ride this monster uptrend 1500 pips before being stopped out.
It can take some time to be able to “eyeball” significant swing highs and lows and know exactly when a stop should be moved.
The Asymmetrical Fractal
A fractal is a tool that draws an arrow on each candle that’s highest price is higher than the high of the two candles to the left and two candles to the right. It also draws arrows on each candle that’s lowest price is lower than the low of the two candles to the left and two candles to the right. It can be used to note potential turning points in the market, or in this case, can be used to identify swing highs and swing lows that we can base our stop off of.
Some settings will create less fractals than the traditional version due to the stipulation that the candle’s high or low price must be higher or lower than the previous 5 candles and the following 9 candles. Now that we see the asymmetric fractals on our charts, we can see their value immediately. Each time we see a fractal, that is a level where we could manually move our stop since it is a significant swing high or swing low. I’ve overlaid our fractals on to our USD/CNH chart used earlier to show how our manual trailing stop moved almost 100% in sync with the fractals created over the same period:
The Buck Stops Where?
Hopefully, this article has given us a better way to trail our stops. We always want our stop to be beyond the most recent swing high or swing low, and the asymmetric fractals can help identify those levels.
Forum on trading, automated trading systems and testing trading strategies
Indicators: FX5_SelfAdjustingRSI
newdigital, 2014.05.11 15:19
RSI Tactics For Forex Trends
RSI is a momentum oscillator that has become a staple for technicians across markets. While most traders may know how to read RSI, there are some tactics that can be employed for trending markets. Today we will continue our look at indicators by reviewing RSI divergence in trending market.
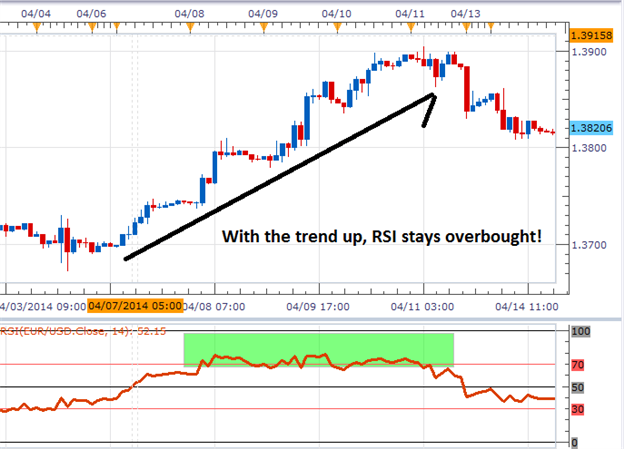
RSI and the Trend
Normally when traders first use RSI they immediately gravitate to trading every overbought or oversold crossover the indicator offers. While there are merits to considering a crossover based strategy, it is important to help filter these signals with the trend. Using the example below, we can see the EURUSD currency pair trending towards higher highs. At the same time, by the design of the indicator, RSI can remain overbought for an extended duration as price continues higher.
Knowing this, traders should avoid RSI signals to sell as prices continue upward towards higher highs. So how can traders use RSI in a strong trending market?
Positive RSI Divergence
RSI divergence is a great tool for trend traders to use to help filter RSI entry signals. The word divergence implies that we are looking at price separating from our indicator. This can easily be identified on the chart by identifying two points to begin on our graph. In an uptrend, if price is retracing and moving towards a lower low but RSI is forming a higher low this can be used to trigger fresh buy orders. The idea is to buy when momentum is returning to the market. As RSI moves higher it can pinpoint just that.
Below we have an example of positive divergence and RSI at work. There are two potential entries highlighted below. The first uses a traditional RSI crossover for entry. If stops are placed below a swing low, traders would have been exited for a loss on this position. From this point, as the market continues toward a lower low, RSI begins to form a higher low. This is a strong signal that momentum is returning in the direction of the trend. Traders then have the ability to trade the next RSI signal and enter the market upon the trends continuation.
Trading a RSI Strategy
As you can see RSI and positive divergence can be great tools for trading trending markets! Now that you are more familiar with one of the many uses for RSI, you can begin working with the indicator in your trading.Forum on trading, automated trading systems and testing trading strategies
Press review
newdigital, 2014.05.11 15:39
Fundamental Analysis
Fundamental analysis is the study of statistical reports and economic indicators of countries to trade currencies more effectively. Changes in interest rates, employment reports, and the latest inflation figures, all fall under the purview of fundamental analysis, which forex traders must pay close attention to, because they can have a direct bearing on the value of a nation’s currency. Data used in forex fundamental analysis can be classified by the degree to which they affect the market:
Given the importance of these indicators, it is necessary to closely follow economic calendars, and know beforehand when they are scheduled for release. The most powerful indicators that move forex market include:
Generally, if a country increases its interest rates, its currency will increase in value because investors will shift their assets to that country to gain higher returns.
GDP is the primary indicator of the strength of economic activity in a country, and is generally reported quarterly. A high GDP figure leads to expectations of higher interest rates, which is mostly positive for the given currency.
A decreases in payroll employment is considered as a sign of weak economic activity, and could eventually lead to lower interest rates, which has a negative impact on the currency.
A country with a significant trade balance deficit is likely to have a weak currency as there will be continuous commercial sellings of its currency.
Traders, who rely on fundamental analysis to study markets, will typically create models to formulate a trading strategy. These models generally utilize a host of empirical data and try to forecast market behavior and estimate future currency levels. This information is then used to draw out specific trades that best exploit the situation. Forecasting models are as varied and numerous as the traders that create them. Two people can analyze the exact same data and come up with two completely different conclusions about how it will impact the market. Therefore is it important to understand what is more relevant to the current market and economic conditions, and not succumb to ‘paralysis by analysis.’
Forum on trading, automated trading systems and testing trading strategies
Something Interesting in Financial Video May 2014
newdigital, 2014.05.12 08:54
Ichimoku Kinko Hyo Trading System
A brief look at the terminology, signals and methods for taking trades using Ichimoku Kinko Hyo.
More video on this subject:
==============
Ichimoku threads/posts on mql5.com forum
=============
Ichimoku indicator description
=============
Forum on trading, automated trading systems and testing trading strategies
How to Start with Metatrader 5
newdigital, 2013.08.04 18:27
If you are totally new to this website and
there are some pages which will help you to start :
Forum on trading, automated trading systems and testing trading strategies
I want the guide to offer signal
newdigital, 2014.01.16 11:12
Frequently Asked Questions about the Signals serviceForum on trading, automated trading systems and testing trading strategies
I want the guide to offer signal
newdigital, 2014.01.16 11:15
How to Become a Signals Provider for MetaTrader 4 and MetaTrader 5Forum on trading, automated trading systems and testing trading strategies
I want the guide to offer signal
newdigital, 2014.01.16 11:18
How to Subscribe to Trading SignalsForum on trading, automated trading systems and testing trading strategies
Indicators: RoundPriceAlert
newdigital, 2014.05.13 09:38
The Three Most Popular Indicators for Day-Trading
Price Action
The first indicator is more than an indicator, and closer to a ‘field-of-study’ within technical analysis. Because trading on short-term time frames exposes traders to the complexity of ‘lag’ within a market, price action is one of the more popular ways of performing technical analysis with a short-term approach.
The reason this is so popular is because price action removes technical indicators from the equation and instead focuses on price and price alone. Price action can be used to grade trends, identify support and resistance levels, and to show traders potential entry opportunities in markets.
Where price action can come in as especially valuable for a short-term trader is in the realm of trade and risk and trade management. By noting price levels with which reversals or changes in market direction have taken place in the past, traders can look to place stops on positions so that if the market breaks against them (if a new low is put in while in a long position, or a new high while in a short position), the trade can be closed in an effort to mitigate the loss.
If the market does trend in the direction that you’re looking for, price action can also help with adjusting stops and profit-taking.
Short-term traders will often look to execute a quick break-even stop to remove their initial risk from the trade. And after prices do continue to move, traders can look at moving the stop even deeper in-the-money as the trade works in the trader’s favor.
Moving Averages
Another indicator that’s simple to use and attempts to marginalize the lag that is ever-present with the usage of indicators, the moving average is a common chart component of short-term traders.
Moving averages are commonly used for trend diagnoses, so that if prices are above the moving average the trend is diagnosed as being ‘up,’ and if prices are below the trend is considered being ‘down.’ This can work phenomenally with a multiple time frame approach in which trends are being graded on a longer-term chart (like the hourly or 4-hour), and entries performed on the shorter-term chart.
Traders can also use moving averages to trigger into new positions. The moving average crossover is one of the more common ways of doing so and with this method; traders are simply looking for price to cross the moving average to initiate the position.
Support and Resistance via Psychological Whole Numbers, and Pivot Points
Have you ever been in a trade that’s working out great, only to see that up-trend stop dead-in-its-tracks? And after price struggles to continue moving up, it begins to oscillate before reversing and moving down.
This is the story of support and resistance, and to short-term traders this can take on extreme importance because failure to see ‘the bigger picture’ can lead to confusion and losses on the shorter-term charts.
There are numerous ways to identify support and resistance, and traders can use price action to validate any particular level; but this really only comes into play after-the-fact. Of particular interest to short-term traders are ‘psychological whole numbers.’
Psychological whole numbers are simply even, rounded values on the chart. As an example 1.3900, 1.3800 and 1.3700 are ‘round’ whole numbers in EURUSD, as each of these prices end in ’00.’ But we can take this a step further with the values mid-way between these three levels, 1.3850 and 1.3750 are also ‘rounded whole numbers.’
Take a look at the most recent move in EURUSD in the chart below, and notice how even in a strong-trending market the level of 1.3850 offered temporary support as the pair could not break through. Eight hours later that momentum came back in the market as the level finally yielded to selling, only to see 1.3750 come in as support shortly thereafter.
At this point, the pair has still failed to break below 1.3750 as support has come into the market after the most current 200+ pip run to the down-side.
Will every price ending in ‘50’ or ‘00’ elicit support or resistance? No. But short-term traders need to remain cognizant of the potential for support and resistance to develop at these values as trends move into new territory.
If a trend appears as though it may have run into a brick wall of support or resistance, traders can use this opportunity to scale out of a position, adjust stops, and or plan re-entries after prices finish retracing and continue moving in the trend-side direction.
Forum on trading, automated trading systems and testing trading strategies
Can you change the ratio in which a signal is subscribed to?
angevoyageur, 2014.02.04 13:31
You have only 2 ways to act on the calculated ratio :
Forum on trading, automated trading systems and testing trading strategies
Different Standard Lot Size between subscriber broker and signal broker
angevoyageur, 2014.02.15 10:18
About rounding of ratio, please read the Frequently Asked Questions about the Signals service point 15. How the lot size itself is rounded I am not sure, in your example (10% applied to 0.20 lot) it seems you are right. Can you provide more details ?Forum on trading, automated trading systems and testing trading strategies
Metatrader 4 Signal Lot Size not copied?
newdigital, 2013.08.14 07:40
And there is some changes related to lot size/volume made in one of the build of Metatrader:
===========
Signals: Changed the algorithm for calculation of the copied deal's volume in case a Signal Source and a Subscriber have different leverages:
Current algorithm: A deal volume is changed in direct ratio to the correlation of a Signal Source's leverage with a Subscriber's one. It means that if a Signal Source having a leverage of 1:100 opens a deal of 1 lot, a Subscriber having a leverage of 1:500 will open a deal of 5 lots in case of 100% copying and a deposit matching by size and currency. A subscriber having a leverage of 1:10 will open a deal of 0.1 lots in similar conditions.
New algorithm: If subscriber's leverage exceeds the one of the Signal Source, it does not affect a volume of a copied deal. Otherwise, the deal volume is changed in direct ratio to the correlation of a Signal Source's leverage with a Subscriber's one.
It means that if a Signal Source having a leverage of 1:100 opens a deal of 1 lot, a Subscriber having a leverage of 1:500 will open a deal of 1 lot in case of 100% copying and a deposit matching by size and currency. A subscriber having a leverage of 1:10 will open a deal of 0.1 lots in similar conditions
Forum on trading, automated trading systems and testing trading strategies
Metatrader 4 Signal Lot Size not copied?
newdigital, 2013.08.14 07:40
And the main page for subscribers to understand about which lot size they will have when subscribe - this one https://www.metatrader5.com/en/terminal/help/signals/signal_subscriber (started from the words "Copying Trading Operations and Volume Calculation").
Just for information.
Forum on trading, automated trading systems and testing trading strategies
Indicators: MACD_Histogram
newdigital, 2014.05.15 12:59
A Quicker Trade Signal Using MACD
- The MACD and Signal line crossover gives traditional buy/sell signals.
- Histogram is the difference between the MACD and Signal line.
- We can enter when Histogram begins to get smaller rather than wait for a cross.
Most technical traders have experience using the more popular oscillators, RSI, CCI, and MACD, etc. But many traders I’ve taught are not aware of the alternative way to use the MACD. In this article we will discuss how to use MACD’s histogram to open trades and show how in many cases we can get a quicker entry than the traditional MACD method.What Does the Histogram Represent?
The green histogram or “bar chart” included in the background of the MACD displays the difference between the MACD and Signal line. When the MACD is above the Signal line, the bar is positive. When the MACD is below the Signal line, the bar is negative. The actual height of the bar is the difference between the MACD and signal line itself.
MACD’s Histogram Construction
The chart above shows what the Histogram represents. The first label shows how the MACD is higher than the Signal line. This creates a positive green bar that has a height equal to the difference of the two lines. The second example the MACD is below the Signal line. This creates a negative green bar that has a height equal to the difference between the two lines. We can also see that when the Blue and Red lines cross, the histogram flips from one side to the other.
How to Enter Based On the Histogram
So how can we read the histogram to generate trade signals? We first want to track the histogram as it moves away from the zero line, in other words, track it as its bars grow larger. The actual signal comes when the histogram no longer gets larger and produces a smaller bar. Once the histogram prints a smaller bar, we look to trade in the direction of the histogram’s decline. We can see an example of this in the chart below:
MACD Histogram Entry Logic
The Sell signal on the left was created by four growing bars in a row followed by a fifth bar that closed smaller. Five bars later, we see the MACD line crossing below the Signal line which is a traditional MACD signal. This later signal would have missed a majority of the move that the Histogram signal would have caught. Therefore, using the histogram as a signal can earn us a greater number of pips.
The Buy signal on the right is a similar story. We saw four bars growing consecutively until a 5th bar was created that equaled the 4th. We want to wait until a bar is smaller, so the trigger would have been presented after the 6th bar closed. This buy trade came several bars before the MACD/Signal cross and gave us a better entry as well.
Once we are in the trade, we can use sound Money Management to close out the trade appropriately.
And The Rest is Histogram
This entry strategy is fairly straight forward and can quickly be adopted by a technical trader.
Forum on trading, automated trading systems and testing trading strategies
How to Start with MT5, a summary !
angevoyageur, 2013.03.15 16:12
How to start with MT5 platform : summary.
As our topic about "How to start with Metatrader 5" is going to be huge, here you find a summary, with main links.
For developpers.
Work in progress, stay tuned :-)