Indicators: FX5_SelfAdjustingRSI
- RSI is a momentum oscillator that can help pinpoint market trends
- RSI can stay overbought for extended periods in an uptrend
- Indicator divergence can signal changes in momentum as well as entry signals
RSI is a momentum oscillator that has become a staple for technicians across markets. While most traders may know how to read RSI, there are some tactics that can be employed for trending markets. Today we will continue our look at indicators by reviewing RSI divergence in trending market.
RSI and the Trend
Normally when traders first use RSI they immediately gravitate to trading every overbought or oversold crossover the indicator offers. While there are merits to considering a crossover based strategy, it is important to help filter these signals with the trend. Using the example below, we can see the EURUSD currency pair trending towards higher highs. At the same time, by the design of the indicator, RSI can remain overbought for an extended duration as price continues higher.
Knowing this, traders should avoid RSI signals to sell as prices continue upward towards higher highs. So how can traders use RSI in a strong trending market? 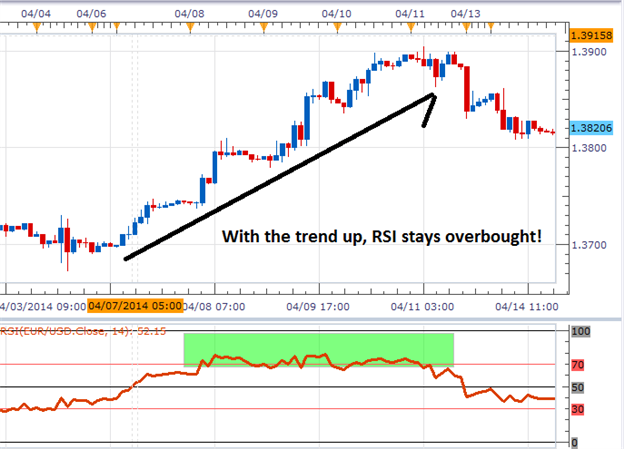
Positive RSI Divergence
RSI divergence is a great tool for trend traders to use to help filter RSI entry signals. The word divergence implies that we are looking at price separating from our indicator. This can easily be identified on the chart by identifying two points to begin on our graph. In an uptrend, if price is retracing and moving towards a lower low but RSI is forming a higher low this can be used to trigger fresh buy orders. The idea is to buy when momentum is returning to the market. As RSI moves higher it can pinpoint just that.
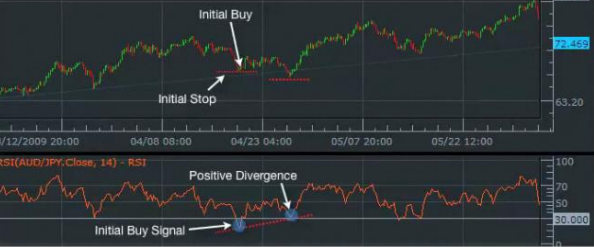
Below we have an example of positive divergence and RSI at work. There are two potential entries highlighted below. The first uses a traditional RSI crossover for entry. If stops are placed below a swing low, traders would have been exited for a loss on this position. From this point, as the market continues toward a lower low, RSI begins to form a higher low. This is a strong signal that momentum is returning in the direction of the trend. Traders then have the ability to trade the next RSI signal and enter the market upon the trends continuation.
Trading a RSI Strategy
As you can see RSI and positive divergence can be great tools for trading trending markets! Now that you are more familiar with one of the many uses for RSI, you can begin working with the indicator in your trading.
- 2012.07.20
- Walker England
- www.dailyfx.com
- Free trading apps
- Over 8,000 signals for copying
- Economic news for exploring financial markets
You agree to website policy and terms of use
FX5_SelfAdjustingRSI:
The RSI oscillator with the boundaries of the overbought/oversold areas expressed by Bollinger Bands
Author: Nikolay Kositsin