Forecast and levels for EURO - page 20
You are missing trading opportunities:
- Free trading apps
- Over 8,000 signals for copying
- Economic news for exploring financial markets
Registration
Log in
You agree to website policy and terms of use
If you do not have an account, please register
Forum on trading, automated trading systems and testing trading strategies
Press review
Sergey Golubev, 2018.01.07 08:53
EUR/USD - daily bullish breakout (based on the article)
Daily price is on bullish breakout located above Ichimoku cloud: the price is breaking 1.2088 resistance level for the bullish trend to be continuing.
==========
Chart was made on MT5 with BrainTrading system (MT5) from this thread (free to download) as well as the following indicators from CodeBase:
All about BrainTrading system for MT5:
Forum on trading, automated trading systems and testing trading strategies
Press review
Sergey Golubev, 2018.01.08 16:39
EUR/USD Intra-Day Fundamentals: European Union Economic Sentiment Indicator and range price movement
2018-01-08 10:00 GMT | [EUR - Economic Sentiment Indicator]
if actual > forecast (or previous one) = good for currency (for EUR in our case)
[EUR - Economic Sentiment Indicator] = Economic Sentiment Indicator (ESI) is calculated monthly based on the five survey market confidence indices: industrial, service, consumer, construction and retail confidence indices (indices are listed in descending order of weights in ESI calculation).
==========
From rttnews article :
==========
EUR/USD M5: range price movement by European Union Economic Sentiment Indicator news event
==========
The charts were made on MT5 with MA Channel Stochastic system uploaded on this post, and using standard indicators from Metatrader 5 together with following indicators:
Forum on trading, automated trading systems and testing trading strategies
Press review
Sergey Golubev, 2018.01.12 15:04
Intra-Day Fundamentals - EUR/USD, GBP/USD and USD/CNH: U.S. Retail Sales
2018-01-12 13:30 GMT | [USD - Retail Sales]
if actual > forecast (or previous one) = good for currency (for USD in our case)
[USD - Retail Sales] = Change in the total value of sales at the retail level.
==========
From cnbc article :
==========
EUR/USD M5: range price movement by U.S. Retail Sales news events
==========
GBP/USD M1: range price movement by U.S. Retail Sales news events
============
USD/CNH M5: range price movement by U.S. Retail Sales news events
==========
Chart was made on MT5 with BrainTrading system (MT5) from this thread (free to download) as well as the following indicators from CodeBase:
All about BrainTrading system for MT5:
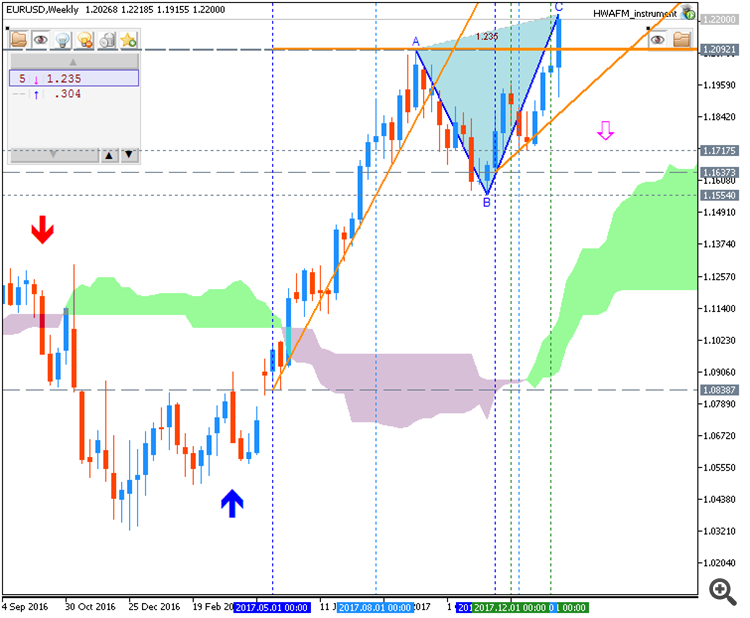
1.22000 is the level to watch next week.
Forum on trading, automated trading systems and testing trading strategies
Press review
Sergey Golubev, 2018.01.14 08:57
Weekly EUR/USD Outlook: 2018, January 14 - January 21 (based on the article)
EUR/USD had an excellent week that saw more volatility than the prior week with the pair hitting the highest levels in over three years. Is there more to come? Final inflation figures stand out in the week before the ECB decision. Here is an outlook for the highlights of this week.
Forum on trading, automated trading systems and testing trading strategies
Press review
Sergey Golubev, 2018.01.18 15:06
Intra-Day Fundamentals - EUR/USD, NZD/USD and GOLD: U.S. Housing Starts
2018-01-18 13:30 GMT | [USD - Housing Starts]
if actual > forecast (or previous one) = good for currency (for USD in our case)
[USD - Housing Starts] = Annualized number of new residential buildings that began construction during the previous month.
==========
From cnbc article :
==========
EUR/USD M1: range price movement by U.S. Housing Starts news events
==========
NZD/USD M1: range price movement by U.S. Housing Starts news events
==========
XAU/USD M1: range price movement by U.S. Housing Starts news events
==========
The charts were made on MT5 with MA Channel Stochastic system uploaded on this post, and using standard indicators from Metatrader 5 together with following indicators:
In the daily chart, last pin bar was formed above the support level of 1.21500. Would like to see if EURUSD goes lower to the more stronger support level before making the reversal to continue the main trend.
Forum on trading, automated trading systems and testing trading strategies
Press review
Sergey Golubev, 2018.01.22 09:07
EUR/USD - strong bullish on daily; 1.2323 is the key (based on the article)
Daily price is above Ichimoku cloud in the bullish area of the chart: the price is testing resistance level at 1.2323 together with ascending triangle pattern to above for the bullish trend to be continuing, otherwise - daily bullish ranging within the levels.
----------------
The chart was made on D1 timeframe with Ichimoku market condition setup (MT5) from this post (free to download for indicators and template) as well as the following indicator from CodeBase:
This week is almost the last week in January. Between the second and third week in February, give more attention to EURUSD.