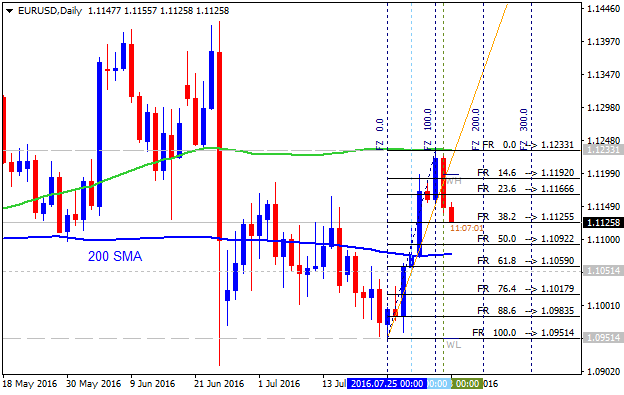
EURUSD Technical Analysis 2016, 31.07 - 07.08: daily bearish breakout with possible bullish reversal
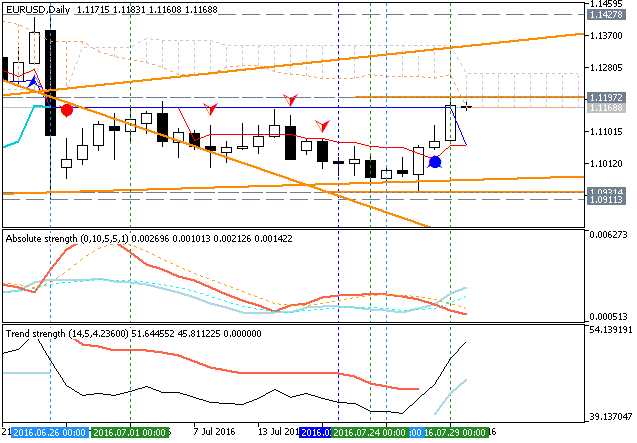
Daily price is located below Ichimoku cloud in the bearish area of the chart: the price is on secondary bear market rally to be started on Friday with 1.1191 resistance level to be crossed to above for the rally to be continuing. The price is located within the following key support/resistance levels:
- 1.1381 resistance level located above Ichimoku cloud in the beginning of the bullish trend, and
- 1.0911 support level located far below Ichimoku cloud in the bearish area of the chart.
Absolute Strength indicator is evaluating the breakout to be started.
If D1 price breaks 1.1381 resistance level on close bar from below to above so the bullish reversal will be started with 1.1427 level as a nearest daily target.
If not so the price will be on ranging bearish within the levels.
- Recommendation for long: watch close D1 price to break 1.1381 for possible buy trade
- Recommendation
to go short: watch D1 price to break 1.0911 support level for possible sell trade
- Trading Summary: bearish
| Resistance | Support |
|---|---|
| 1.1381 | 1.0911 |
| 1.1427 | N/A |
SUMMARY : breakout
New daily bar was opened on exact 'reversal' Senkou Span line with new resistance level to be formed: 1.1197. If the price breaks this level (1.1197) to above on daily close bar so the daily bullish reversal will be started, if not so the price will be on ranging bearish market condition.
Forum on trading, automated trading systems and testing trading strategies
Sergey Golubev, 2016.08.01 16:12
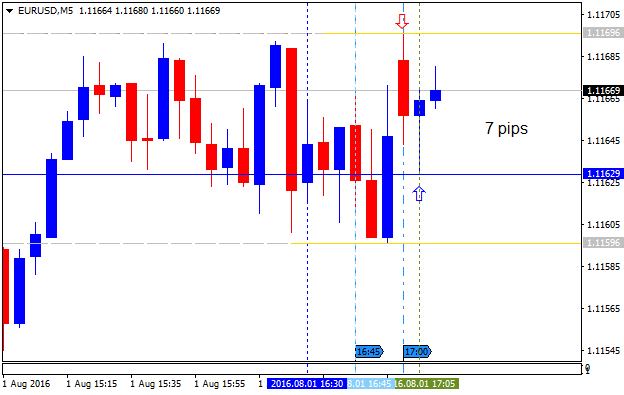
EUR/USD Intra-Day Fundamentals: Manufacturing ISM Report On Business and 7 pips range price movement
2016-08-01 14:00 GMT | [USD - ISM Manufacturing PMI]
- past data is 53.2
- forecast data is 53.1
- actual data is 52.6 according to the latest press release
if actual > forecast (or previous one) = good for currency (for GBP in our case)
[USD - ISM Manufacturing PMI] = Level of a diffusion index based on surveyed purchasing managers in the manufacturing industry.
==========
"The report was issued today by Bradley J. Holcomb, CPSM, CPSD, chair of the Institute for Supply Management® (ISM®) Manufacturing Business Survey Committee. "The July PMI® registered 52.6 percent, a decrease of 0.6 percentage point from the June reading of 53.2 percent. The New Orders Index registered 56.9 percent, a decrease of 0.1 percentage point from the June reading of 57 percent. The Production Index registered 55.4 percent, 0.7 percentage point higher than the June reading of 54.7 percent. The Employment Index registered 49.4 percent, a decrease of 1 percentage point from the June reading of 50.4 percent. Inventories of raw materials registered 49.5 percent, an increase of 1 percentage point from the June reading of 48.5 percent."
==========
EUR/USD M5: 7 pips range price movement by ISM Manufacturing PMI news event
Forum on trading, automated trading systems and testing trading strategies
Sergey Golubev, 2016.08.03 15:31
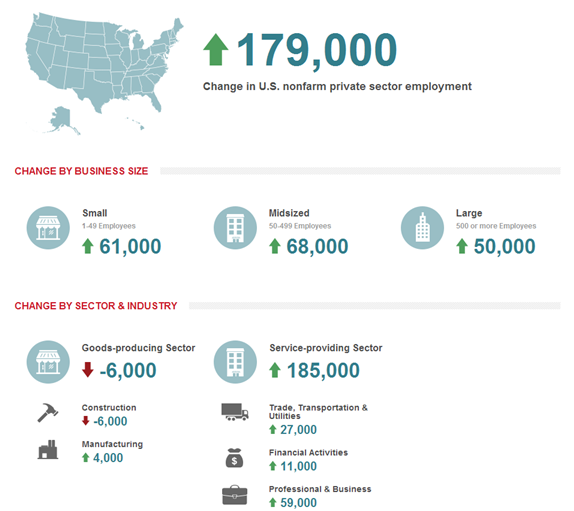
Intra-Day Fundamentals - EUR/USD, AUD/USD, NZD/USD and USD/CNH: ADP Non-Farm Employment Change
2016-08-03 12:15 GMT | [USD - ADP Non-Farm Employment Change]
- past data is 176K
- forecast data is 171K
- actual data is 179K according to the latest press release
if actual > forecast (or previous one) = good for currency (for USD in our case)
[USD - ADP Non-Farm Employment Change] = Estimated change in the number of employed people during the previous month, excluding the farming industry and government.
==========
==========
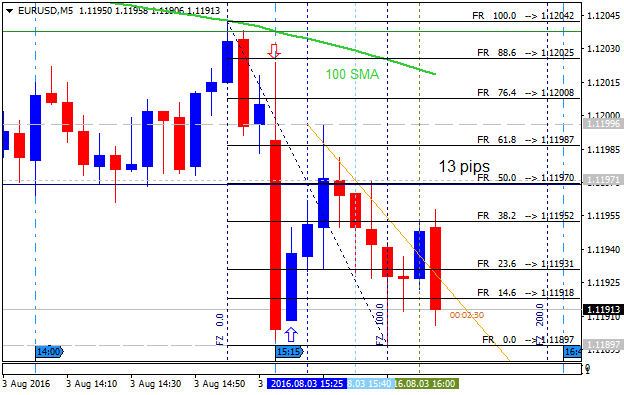
EUR/USD M5: 13 pips range price movement by ADP Non-Farm Employment Change news event
Forum on trading, automated trading systems and testing trading strategies
Sergey Golubev, 2016.08.04 11:52
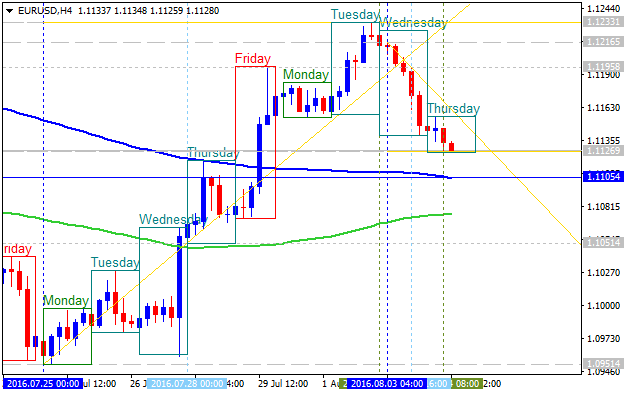
Technical Targets for EUR/USD by United Overseas Bank (based on the article)
H4 price
is located near and above 200 SMA: the price is on secondary correction within the primary bullish market condition within
the following key reversal support/resistance
levels:
- 1.1233 resistance level located above 100 SMA/100 SMA reversal area in the bullish trend to be continuing, and
- 1.1105 support level located on 200 SMA on the border between the primary bearish and the primary bullish trend on the chart.
Descending triangle pattern was formed by the price to be crossed for the correction to be continuing.
Daily
price. United Overseas Bank is expecting for EUR/USD to be continuing with the ranging condition to be above 1.1215 for some short period of time:
"While the stop-loss for our bullish EUR view is still intact at the time of writing, the unexpected sharp drop yesterday clearly indicates an increased risk of a short-term top. A move below 1.1130 would shift the outlook to neutral and suggest a period of broad sideway consolidation has started. This appears likely unless EUR can move and stay above 1.1215 within these 1 to 2 days."
- If daily price breaks 1.1233 resistance level
on close bar so the bullish trend will be continuing.
- If daily price breaks 1.1059 support level on close bar so the primary bearish reversal will be started.
- If not so the price will be ranging within the levels.
Forum on trading, automated trading systems and testing trading strategies
Sergey Golubev, 2016.08.05 13:02
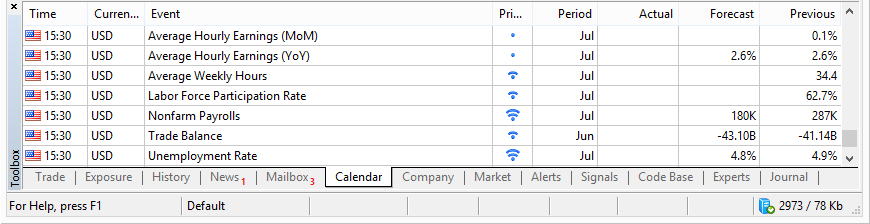
Trading News Events: U.S. Non-Farm Payrolls (adapted from the article)
- "Another 180K expansion in U.S. Non-Farm Payrolls (NFP) accompanied by a downtick in the jobless rate may boost the appeal of the greenback and trigger further losses in EUR/USD as it puts pressure on the Federal Open Market Committee (FOMC) to further normalize monetary policy in 2016."
- "Even though Fed Funds Futures highlight a 12% probability for a September rate-hike, a further improvement in labor market dynamics may encourage central bank officials to adopt a more hawkish outlook for monetary policy as the U.S. economy approaches ‘full-employment.’’"
Bullish USD Trade
- "Need red, five-minute candle following the NFP print to consider a short trade on EUR/USD."
- "If market reaction favors a bullish dollar trade, sell EUR/USD with two separate position."
- "Set stop at the near-by swing high/reasonable distance from entry; look for at least 1:1 risk-to-reward."
- "Move stop to entry on remaining position once initial target is hit; set reasonable limit."
- "Need green, five-minute candle to favor a long EUR/USD trade."
- "Implement same setup as the bullish dollar trade, just in the opposite direction."
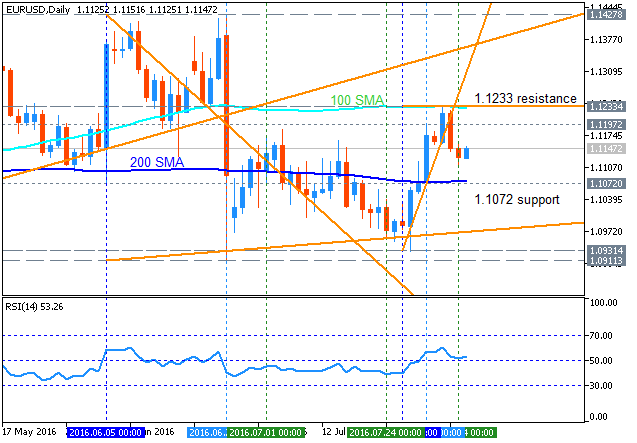
Daily price is located between 100 SMA and 200 SMA for the ranging market condition waiting for the direction within the following key reversal support/resistance levels:
- 1.1233 resistance located above 200 SMA and near 100 SMA on the beginning of the bullish trend to be resumed, and
- 1.1072 support level located near 200 SMA in the beginning of the bearish trend to be started on the chart.
RSI
indicator is estimating the ranging bullish market condition with the possibility to the bearish reversal.
- If the price will break 1.1233 resistance level on close daily bar so the primary bullish trend will be resumed.
- If price will break 1.1072
support on close daily bar so the reversal of the price movement from
the ranging bullish to the primary bearish trend will be started.
- If not so the price will be ranging within the levels.
Forum on trading, automated trading systems and testing trading strategies
Sergey Golubev, 2016.08.05 14:53
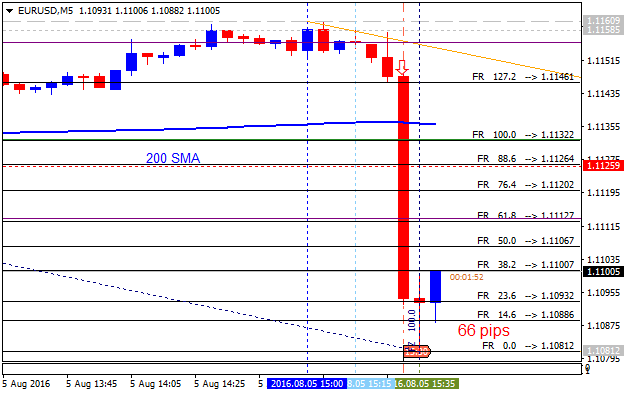
Intra-Day Fundamentals - EUR/USD and Dollar Index: Non-Farm Payrolls
2016-08-05 12:30 GMT | [USD - Non-Farm Employment Change]
- past data is 287K
- forecast data is 180K
- actual data is 255K according to the latest press release
if actual > forecast (or previous one) = good for currency (for USD in our case)
[USD - Non-Farm Employment Change] = Change in the number of employed people during the previous month, excluding the farming industry.
==========
"Total nonfarm payroll employment rose by 255,000 in July, and the unemployment rate was unchanged at 4.9 percent, the U.S. Bureau of Labor Statistics reported today. Job gains occurred in professional and business services, health care, and financial activities. Employment in mining continued to trend down."
==========
EUR/USD M5: 66 pips price movement by Non-Farm Payrolls news event
==========
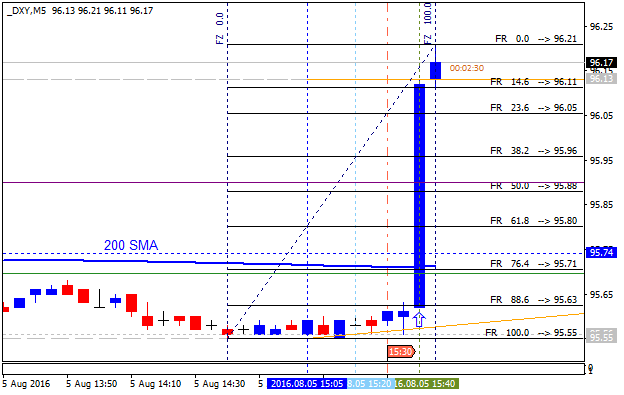
Dollar Index M5: price movement by Non-Farm Payrolls news event
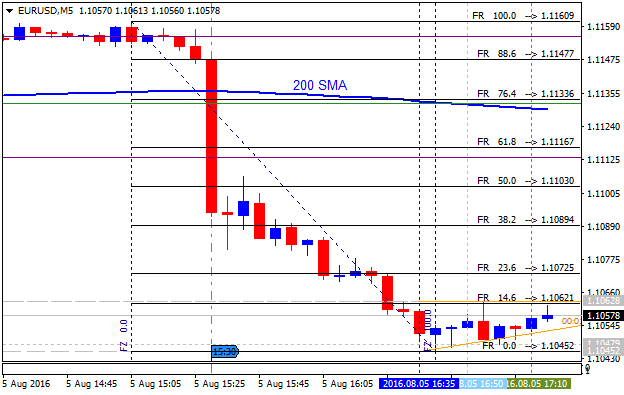
M5 price broke 200 SMA to below on Non-Farm Payrolls news event: price is testing 1.1045 support level to below for the bearish breakdown to be continuing. For now, this is 102 pips price movement by by Non-Farm Payrolls news event.
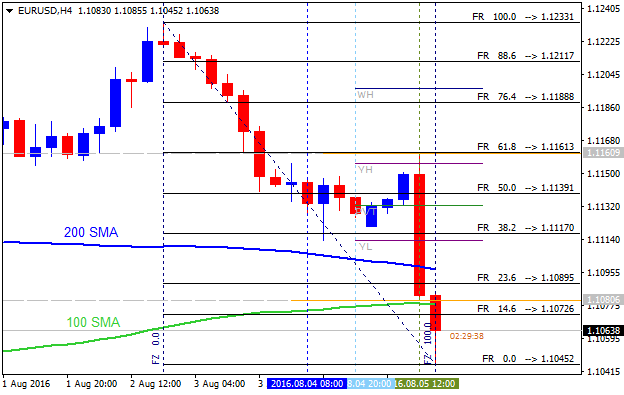
H4 intra-day price broke 100 SMA/200 SMA reversal area for the bearish market condition. The price is testing 1.1045 support to below for the bearish trend to be continuing. Alternative, if the price breaks 1.1161 resistance to above so the bullish trend will be resumed, otherwise - ranging within the levels.
- Free trading apps
- Over 8,000 signals for copying
- Economic news for exploring financial markets
You agree to website policy and terms of use
Daily price is located below Ichimoku cloud in the bearish area of the chart: the price is on secondary bear market rally to be started on Friday with 1.1191 resistance level to be crossed to above for the rally to be continuing. The price is located within the following key support/resistance levels:
Absolute Strength indicator is evaluating the breakout to be started.
If D1 price breaks 1.0911 support level on close bar so the primary bearish trend will be resumed.If D1 price breaks 1.1381 resistance level on close bar from below to above so the bullish reversal will be started with 1.1427 level as a nearest daily target.
If not so the price will be on ranging bearish within the levels.
SUMMARY : breakout
TREND : bearish