Forecast for Q2'16 - levels for USD/JPY - page 2
You are missing trading opportunities:
- Free trading apps
- Over 8,000 signals for copying
- Economic news for exploring financial markets
Registration
Log in
You agree to website policy and terms of use
If you do not have an account, please register
Forum on trading, automated trading systems and testing trading strategies
Press review
Sergey Golubev, 2016.05.14 13:37
Japan PM Abe To Postpone Planned Sales Tax Hike (based on the article)
Over the past few months Japan PM Abe insisted that he would not delay the consumption tax increase for a second time explaining that the increase would go ahead "unless a global economic contraction or a Lehman-style market shock jolted Japan's economy." But Nikkei Business Daily reported what many had expected: "Japanese Prime Minister Shinzo Abe has decided to postpone a consumption tax increase set for next April, judging it to threaten efforts to pull the world's third-largest economy out of deflation."
Forum on trading, automated trading systems and testing trading strategies
Press review
Sergey Golubev, 2016.05.18 07:44
USD/JPY Intra-Day Fundamentals: Japan Gross Domestic Product and 42 pips price movement
2016-05-17 23:50 GMT | [JPY - GDP]
if actual > forecast (or previous one) = good for currency (for JPY in our case)
[JPY - GDP] = Change in the inflation-adjusted value of all goods and services produced by the economy.
==========
Japan's gross domestic product jumped 0.4 percent on quarter in the first quarter of 2016.
==========
USD/JPY M5: 42 pips price movement by Japan Gross Domestic Product news event :
USD/JPY Technical Analysis 2016, 08.05 - 15.05: daily bearish within narrow levels; weekly bearish breakdown; monthly correction; 106.27 is the key
If D1 price will break 106.27 support level on close bar so the primary bearish trend will be continuing with 105.54 nearest target to re-enter.If D1 price will break 108.19 resistance level on close bar so the local uptrend as the bear market rally will be started.
If not so the price will be on ranging within the levels.
...
Daily price broke 108.19 resistance level for the bear market rally to be continuing. The price is testing 109.64 level for the possible ranging bullish reversal with the symmetric triangle pattern to be crossed to above for the bullish condition to be started. Trend Strength indicator is estimating the local uptrend in the near future up to bullish reversal of the price movement, but Absolute Strength indicator is evaluating the price movement as the secondary ranging in the near future.
Anyway, this is 120 pips in profit for now for the trades who placed buy stop pending order at 108.19 level.
Forum on trading, automated trading systems and testing trading strategies
Press review
Sergey Golubev, 2016.05.24 12:56
Technical Targets for USD/JPY by United Overseas Bank (based on the article)
USD/JPY: intra-day ranging within 10-day high/low levels for direction
H4 price is located near and above 200 period SMA (200 SMA) and 100 period SMA (100 SMA) for the ranging market condition within the following key reversal support/resistance levels:
United Overseas Bank is considering USD/JPY daily price to be continuing with the primary bearish market condition, and intra-day price to be reversed to the bearish trend:
"The bullish phase that started two weeks ago ended abruptly yesterday when 109.20 was breached. The current movement is viewed as a corrective pull-back which has scope to extend lower to 108.40/45. Resistance is at 110.00 and the recent high near 110.60 is unlikely to come under threat, at least not for the next several days."
Forum on trading, automated trading systems and testing trading strategies
Press review
Sergey Golubev, 2016.05.28 15:43
Fundamental Weekly Forecasts for Dollar Index, GBP/USD, USD/JPY, AUD/USD, USD/CAD and GOLD (based on the article)
USD/JPY - "The key question is straightforward: will the US Federal Reserve raise interest rates for only the second time in 10 years at their June 15 meeting? Current interest rate pricing shows an approximate 35 percent likelihood of a 25bps rate hike—up substantially from a less than 5 percent chance shown just two weeks ago. It is perhaps unsurprising to note the interest-rate-sensitive USD/JPY exchange rate has rallied noticeably as odds have improved for a Fed hike. And we expect that any strong positive surprises in inflation and labor data could only help Fed expectations - moving the USD/JPY in kind."
Daily price is on bearish condition located below 100 SMA/200 SMA reversal area: the price is on ranging within 111.01 resistance level and 106.07 support level. Descending triangle pattern and ascending triangle pattern were formed by the price to be crossed for the direction of the trend.
If the daily price breaks 111.01 resistance level to above so the local uptrend as the secondary rally within the primary bearish market condition will be started with 113.79 level as the next target.
If the the price breaks 113.79 resistance level so the reversal of the price movement to the primary bullish condition will be started.
If the price breaks 106.27 support level so the primary bearish trend will be continuing up to 105.54 level to re-enter.
If not so the price will be on bearish ranging within the levels.
USD/JPY: End Of Week Technicals - Breakdown with Daily Bearish Reversal
Daily price is breaking Senkou Span line for the possible breakdown: the price is crossing 109.04 support level to below on open daily bar for now for the reversal of the price movement from the ranging bullish to the primary bearish market condition.
Absolute Strength indicator is estimating the bearish trend to be started, and Chinkou Span line is already broke the price to below for the good breakdown in the near future to be continuing.
If D1 price will break 109.04 support level on close daily bar so the reversal of the price movement from the ranging bullish to the primary bearish market condition will be started.
If D1 price will break 111.87 resistance level on close bar so the bullish trend will be resumed without ranging.
If not so the price will be on ranging within the levels.
SUMMARY : breakdown
TREND : daily bearishForum on trading, automated trading systems and testing trading strategies
Press review
Sergey Golubev, 2016.06.06 12:35
Intra-Day Fundamentals: Signals from Federal Reserve chair Janet Yellen about the US central bank's next rate-hike after payroll data shocks
2016-06-06 16:30 GMT | [USD - Fed Chair Yellen Speaks]
[USD - Fed Chair Yellen Speaks] = Speech about the economic outlook and monetary policy at the World Affairs Council of Philadelphia's luncheon.
==========
==========
Credit Agricole:
==========
Live blog and video of Janet Yellen’s speech in Philadelphia:
"The overall labor market situation has been quite positive. In that context, this past Friday’s labor market report was disappointing. Payroll gains were reported to have been much smaller in April and May than earlier in the year, averaging only about 80,000 per month. And while the unemployment rate was reported to have fallen further in May, that decline occurred not because more people had jobs but because fewer people reported that they were actively seeking work."
==========
EUR/USD M5: 68 pips range price movement by Fed Chair Yellen Speaks news event
==========
USD/JPY M5: 72 pips range price movement by Fed Chair Yellen Speaks news event
Forum on trading, automated trading systems and testing trading strategies
Press review
Sergey Golubev, 2016.06.11 10:11
Fundamental Weekly Forecasts for Dollar Index, NZD/USD, GBP/USD, USD/CAD, USD/CNH, USD/JPY, AUD/USD and GOLD (based on the article)
USD/JPY - "The BoJ may largely endorse a wait-and-see approach especially as Prime Minster Shinzo Abe delays the sale-tax hike and pledges to take ‘bold’ measures to encourage a stronger recovery, and more of the same from Governor Haruhiko Kuroda and Co. may boost the appeal of the Japanese Yen as market participants scale back bets for more non-standard measures. Moreover, a further deterioration in risk sentiment may also heighten the appeal of the low-yielding currency, and the weakening outlook for global growth may prop up the Yen as Japan returns to its historical role as a net-lender to the world economy."USDJPY Intra-Day Technical Analysis: inter-mediate support level to be breaking for the intra-day bearish trend to be continuing
H4 price is located to be below Ichimoku cloud for the primary bearish market condition: the price is testing 105.72 support level to below for the bearish trend to be continuing with 105.54 level as a nearest bearish target to re-enter.
If H4 price will break 105.72 support level on close bar so the primary bearish trend will be continuing with 105.54 target to re-enter.
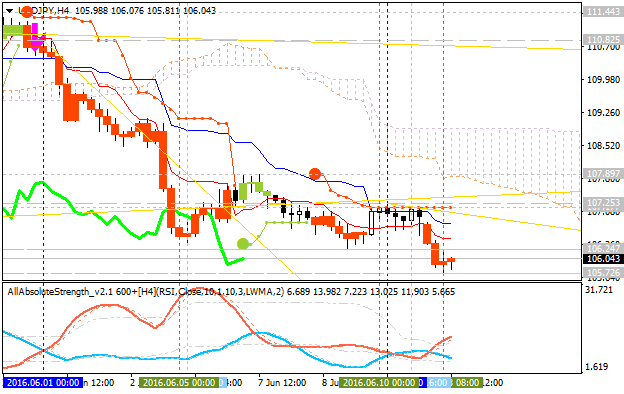
If H4 price will break 107.89 resistance level on close bar so the reversal of the H4 price movement to the primary bullish market condition will be started.
If not so the price will be on ranging within the levels.
SUMMARY : bearish
Forum on trading, automated trading systems and testing trading strategies
about USDJPY H1 Forecast & Analysis
Sergey Golubev, 2016.06.17 16:48
As we see from the image above - the price is on flat condition to be ranging within narrow s/r levels:
If H1 price breaks 104.39 resistance to above so the bullish reversal will be started on the secondary ranging way.
If H1 price breaks 104.07 support level to below so tjhe primary bearish trend will be continuing.
USD/JPY Technical Analysis: Buy at 106.01
H4 price is breaking Ichimoku cloud to above on open bar. The price is testing 106.01 resistance level with ascending triangle pattern to be borken to above for the bullish breakout to be continuing.
SUMMARY : intra-day bullish breakout