Press review - page 583


Weekly Outlook: 2018, January 14 - January 21 (based on the article)

The dollar suffered across the board in the second week of 2018. Will it remain under pressure? The upcoming week features housing data and consumer confidence from the US, Chinese GDP, and other market-moving events. Here are the highlights for the upcoming week.
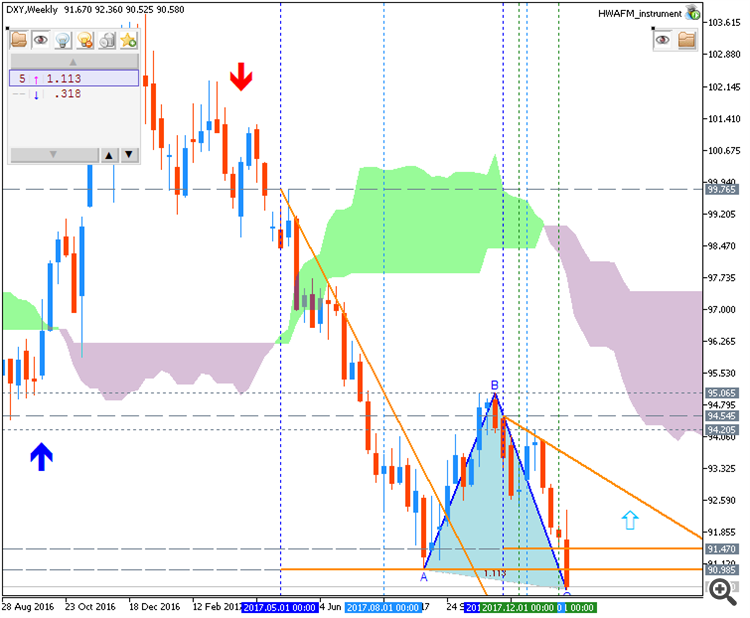

  1. UK inflation report:  Tuesday, 9:30. Britain stands out among developed countries by suffering from elevated inflation. Year over year CPI surpassed the 3% threshold in the reading for November, above the 1-3% range. Rising inflation has already triggered a rate hike in November, but the BOE seems reluctant to make additional tightening given the uncertainty resulting from Brexit and the slowing economy. Another rise in this important report that concludes 2017 may force the BOE to rethink. A small drop to 3% is expected.
  2. Empire State Manufacturing Index: Tuesday, 13:30. A level of 18.5 is predicted.
  3. Canadian rate decision: Wednesday, 15:00. The Bank of Canada is expected to raise interest rates for the third time in this cycle, from 1% to 1.25%. In the previous rate decision, it seemed like BOC Governor and his team were in for a long pause after normalizing rates back to 1% in mid-2017. However, recent economic data has been quite impressive: the economy gained some 79K positions in both November and December. The recent BOC Business survey was quite bullish, pointing to rapid expansion. Alongside a significant rise in oil prices, the time seems ripe for tightening by the Ottawa-based institution. A surprise “no-change” will hurt the C$. A rate hike is basically priced in and the response in case of a hike will depend on the prospects for further moves.
  4. Australian jobs report: Thursday, 00:30. A modest gain of 15.2K jobs is on the cards. The unemployment rate carries expectations for remaining at 5.4%.
  5. Chinese GDP: Thursday, 2:00. A minor slide to 6.7% is forecast.
  6. US housing data: Thursday, 13:30. Building permits are projected to slide to 1.29 million while housing starts are predicted to drop to 1.27 million units annualized.
  7. Crude Oil Inventories: Thursday, 16:00. With the prices of black gold hitting new highs, this release is important not only for loonie traders but also for the US dollar: there is often an inverse correlation between oil prices and the greenback.
  8. US consumer sentiment: Friday, 15:00. A score of 97.2 is expected.

============

The chart was made on Metatrader 5 using HWAFM tool pattern tool from this post.

Forex Weekly Outlook - Jan. 15-19 2018 | Forex Crunch
  • 2018.01.12
  • Yohay Elam
  • www.forexcrunch.com
The dollar suffered across the board in the second week of 2018. Will it remain under pressure? The upcoming week features housing data and consumer confidence from the US, Chinese GDP, and other market-moving events. Here are the highlights for the upcoming week. Updates: UK inflation report: Tuesday, 9:30. Britain stands out among developed...
 

Weekly EUR/USD Outlook: 2018, January 14 - January 21 (based on the article)

EUR/USD had an excellent week that saw more volatility than the prior week with the pair hitting the highest levels in over three years. Is there more to come? Final inflation figures stand out in the week before the ECB decision. Here is an outlook for the highlights of this week.
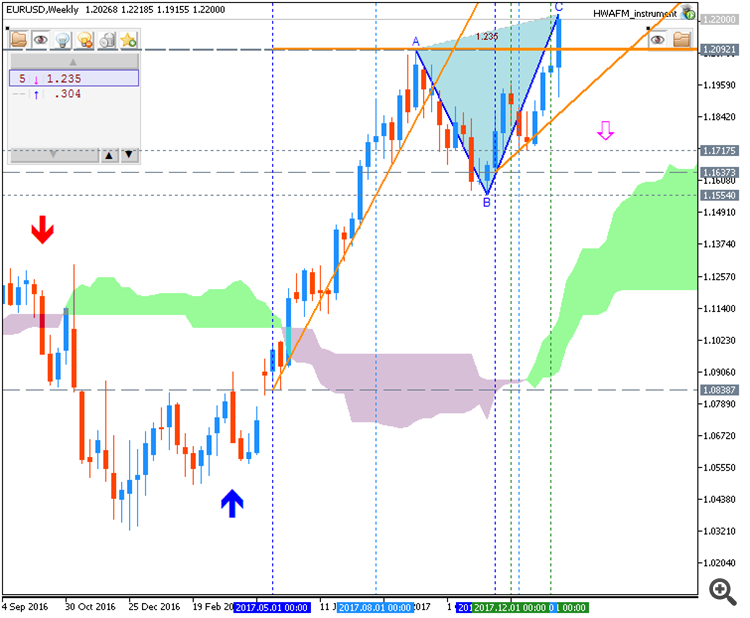

  1. Trade Balance: Monday, 10:00. The euro-zone enjoys a wide trade surplus thanks to Germany’s robust exports. This surplus stood at 19 billion euros in October and could rise now, as we already know that Germany saw a wider surplus in November and despite France’s wider deficit. A surplus of 22.4 billion is on the cards.
  2. German Final CPI: Tuesday, 7:00. The initial read for December showed a monthly rise of 0.6% in prices in Europe’s largest economy. The final read will likely confirm the initial read.
  3. CPI (Final): Wednesday, 10:00. The flash estimate of euro-zone CPI showed an OK figure on the headline: 1.4% y/y, in line with expectations. However, core inflation remained at 0.9%, below 1%, for the third consecutive month, showing that underlying inflation is still poor. The final read will likely confirm the initial estimate.
  4. Jens Weidmann speaks Thursday, 8:!5. The president of the German Bundesbank will make another public appearance. Will he provide a hint about an announcement about the end of QE? We know that he is a hawk, so making dovish remarks could have a bigger impact than hawkish ones. Nevertheless, his words could move markets.
  5. German PPI: Friday, 10:00. Producer prices missed in November by rising by only 0.1%, breaking a streak of figures coming out ahead of forecasts. Inflation in the pipeline, as reflected by PPI, still seems stronger than CPI. A rise of 0.2% is expected.
  6. Current Account: Friday, 10:00. Similar to the narrower trade balance figure, the wider current account measure is in a significant surplus. The figure for October was relatively low, with 30.3 billion, a miss on estimates. We could see a higher number in the read for November. A surplus of 31.3 billion is predicted.

============

The chart was made on Metatrader 5 using HWAFM tool pattern tool from this post.

EUR/USD Forecast Jan. 15-19 2018 | Forex Crunch
  • 2018.01.12
  • Yohay Elam
  • www.forexcrunch.com
EUR/USD had an excellent week that saw more volatility than the prior week with the pair hitting the highest levels in over three years. Is there more to come? Final inflation figures stand out in the week before the ECB decision. Here is an outlook for the highlights of this week and an updated technical analysis for EUR/USD. Updates: EUR/USD...
 

Bitcoin Weekly Trading Outlook (based on the article)

Daily BTC/USD price is located above Ichimoku cloud in the bullish area of the chart: the price is on ranging within 16,897 resistance and 12,796 support levels for the bullish trend to be continuing or to the bearish reversal to be started.


  • "Bitcoin has been relatively quiet the past three weeks, with it closing out Friday right about where it was trading three weeks ago. The overall price action, thus far, is constructive following the massive run-up in the final months of last year. With a little more time, a wedge – of either the symmetrical or descending variety – could come into play as long as support holds between current levels down to ~12000. If a wedge is to fully develop, then the coming days will likely lead to another week of indecisive trading, but with the downside contained."
  • "The big key for keeping the outlook constructive will be holding the aforementioned support level or at worst the slope around 11600 dating back to May and 11160 spike-day low. A breakdown below the final thresholds of support would not only take the wedge scenario off the table, but likely lead to a much broader decline."

============

Chart was made on MT5 with BrainTrading system (MT5) from this thread (free to download) as well as the following indicators from CodeBase:

All about BrainTrading system for MT5:


Ethereum Weekly Trading Outlook (based on the article)

Daily price is located above Ichimoku cloud in the bullish area of the chart: the price is on testing with resistance level at 1,380 to above for the bullish trend to be continuing, otherwise - ranging bullish.
By the way, the bearish reversal support level is 713 so if the price breaks this level to below - the daily bearish reversal will be started.


  • "The incredible rally from 500 to last week’s high of 1382 has Ethereum in need of a breather. A full test and hold of the trend-line running up from mid-December could position it for another thrust to new highs. Given the proximity of the trend-line, if it is to be met, will do-so in the days ahead. A break of the trend-line won’t turn the picture bearish, but will offer a sign of caution. The next eyed level of support clocks in at the December high of 863."

============

Chart was made on MT5 with BrainTrading system (MT5) from this thread (free to download) as well as the following indicators from CodeBase:

All about BrainTrading system for MT5:


Ripple Weekly Trading Outlook (based on the article)

Daily price is above Ichimoku cloud in the bullish area of the chart: the price is testing 1.536 support level together with descending triangle pattern to below for the possible daily bearish reversal to be started, otherwise - ranging bullish trend nearrrr bearish reversal levels.


  • "This past week, Ripple was undergoing a much-needed correction before it found buyers on the MoneyGram headline on Thursday. The volatile price action put in a 'long-legged doji' (marking a potential inflection point), with the low of the candlestick viewed as important support in the near-term."
  • "If the Thursday low fails, the next level of support comes in at a swing-high created last month at 1.2495. The general outlook for Ripple is a bit unclear given the vertical rise it had during December. An extended period of sideways price action (similar to what is currently happening in Bitcoin and Litecoin) may be needed before another round of buying can push it higher."

============

Chart was made on MT5 with BrainTrading system (MT5) from this thread (free to download) as well as the following indicators from CodeBase:

All about BrainTrading system for MT5:


Bovespa Index - strong bullish trend; 79,880 is the key (based on the article)

The price on the H1 chart is above 100 SMA/200 SMA rebersal levels - the price is located in the bullish area of the chart for resistance level at 79,880 together with symmetric triangle pattern to be testing to above for the strong bullish trend to be continuing...


  • "Ibovespa, the benchmark stock market index in Brazil, closed slightly lower (-0.02%) Friday at 79,349.12 points, even after S&P downgraded Brazil's credit rating from BB to BB-. The losses were limited by bets from some investors that the Brazilian Congress could pass the pension reform next month."

==========

The chart was made on H1 timeframe with standard indicators of Metatrader 4 except the following indicators (free to download):


USD/JPY - intra-day strong bearish trend; 110.32 support is the key (based on the article)

Intra-day price on H4 chart is far below 100-SMA/200-SMA bearish/bullish reversal levels: the price is on bearish market condition for 110.32 support level to be testing for the primary bearish trend to be continuing.


  • "The Japanese Yen has posted strong gains against the US Dollar in the past week, taking USD/JPY back to lows not seen since mid-September last year.
    The fundamental justification for these moves is clear enough. The greenback has been under general pressure thanks to increasing market certainty that other developed markets will see tighter monetary policy in due course, crowding a field which for much of last year belonged solely to the US Federal Reserve. The Eurozone is held to be the most obvious candidate as stronger economic data see bets rise that stimulus withdrawal will accelerate."
  • "The Yen has had a specific, domestic driver, too, even if its rationality is open to question. The Bank of Japan trimmed ever so slightly the amount bought at its regular bond-market operations last week. This was seen by the market as a sign that even Japan’s extraordinary accommodative monetary policy could be tightened and the Yen duly rose. Now the Bank of Japan has effectively denied the markets’ implicit charge since. It has stuck to its ancient line that all current settings will remain in place until inflation rises sustainably. But the Yen has not weakened, suggesting perhaps that the markets do not wholly buy this line."

==========

The chart was made on H4 timeframe with standard indicators of Metatrader 4 except the following indicators (free to download):


Cryptocurrency News

  • "Private messaging app Telegram is planning a $1.2-billion Initial Coin Offering or ICO. The messaging app, with more than one hundred and seventy million monthly users, aims to find a prime place in the thriving cyrptocurrency arena."
  • "According to a businessinsider report, Telegram's ICO will be to support Telegram Open Network or TON blockchain platform which will host a new generation cryptocurrencies and decentralized applications. The investors participating in the ICO will receive TON tokens, known as Grams. The tokens might not be listed till 2019."

Telegram To Establish Its Own Cryptocurrency Through $1.2 Bln ICO
  • www.rttnews.com
Private messaging app Telegram is planning a $1.2-billion Initial Coin Offering or ICO. The messaging app, with more than one hundred and seventy million monthly users, aims to find a prime place in the thriving cyrptocurrency arena. The company is reportedly planning to develop a blockchain to combat bitcoin and ethereum. Telegram mulls a...
 

Bitcoin Daily - breakdown with the bearish reversal; 12,355 is the key (based on the article)

Daily price is on breakdown with the possible bearish reversal: the price is breaking 12,355 support level to below for the breakdown to be continuing with the bearish reversal to be started.


  • "This morning we are seeing a sizable drop in cryptocurrency-land, with double-digit percentage declines taking place across the board. Bitcoin is in real danger of breaking critical support by way of a slope extending higher from May and horizontal levels. The slope dating back to May is viewed as rather significant given its influence on several occasions since, most recently in November. While it has always been a form of resistance, once it was broken it became a source of support."
  • "The May slope along with price levels during December make the ~11700/150 price zone an important one. Hold and Bitcoin lives to fight another day, possibly building the descending wedge we discussed last week. Break, and the trend-line from July in the low 10000s and worse (maybe much worse) come into play."

---------------- 

The chart was made on D1 timeframe with Ichimoku market condition setup (MT5) from this post (free to download for indicators and template) as well as the following indicator from CodeBase:


Litecoin Daily - testing 193 support for the bearish reversal (based on the article)

Daily price is on possible breakdown which may be started if the price breaks 193 support level together with the descending triangle pattern to below. If yes so the bearish breakdown will be started with 174 nearest daily bearish target to re-enter.


  • "Litecoin is probing support, with a slight breach below the 200-level taking place this morning. It would mark a lower-low if it does hold below, and the spike-low at 173.68 would be up next as support."
  • "A break below both levels could lead to a much larger decline. A hold of support through today will still keep life in Litecoin, but it will need to quickly turn higher if it is to maintain a neutral to bullish technical backdrop (keep a descending wedge still in play)."

---------------- 

The chart was made on D1 timeframe with Ichimoku market condition setup (MT5) from this post (free to download for indicators and template) as well as the following indicator from CodeBase:

Reason: