Join our fan page
- Views:
- 12644
- Rating:
- Published:
- Updated:
-
Need a robot or indicator based on this code? Order it on Freelance Go to Freelance
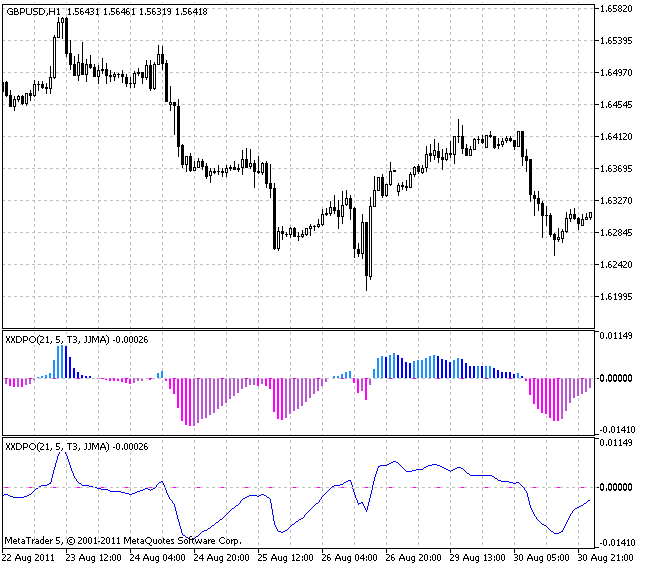
Detrended Price Oscillator (DPO) is a technical indicator that shows the market overbought/oversold states and also can be used for getting buy/sell signals.
It sorts out trends to concentrate on basic price movement cycles. To achieve this, the moving average transforms into the line and price changes below and above it become a trend oscillator.
This indicator is used to highlight short-term cycles, as the analysis of short-term components of the long-term cycles can be useful in determining main reversal points of the latter. DPO does not consider long-term prices cycles making short-term cycles more noticeable.
Calculation:
This DPO version is calculated the following way:
where:
- XMA - smoothing algorithm;
- Price[] - current price of a financial asset;
- SMOOTH_Period - final indicator smoothing period;
- DPO_Period - DPO smoothing period;
- bar - bar index.
Working with trading signals:
If DPO is above its zero line (i.e., the price is above its moving average), it is a bullish signal. If DPO is below the zero line (i.e., the price is below its moving averages), it is a bearish signal.
Long-term cycles reversal points (divergencies):
- If the chart formed a higher peak or deeper depression, you should wait for a price turn up/down;
- if a peak or a bottom is lower/higher than the previous one, the price will fall.
There are two buy/sell signals interpretations.
We should buy when:
- DPO crosses the zero line upwards;
- DPO is located in the oversold area confirmed by previous lows and at the same time the upper line of the channel is being broken both by DPO and the price that is limiting descending price movement.
We should sell when:
- DPO crosses the zero line downwards;
- DPO is located in the overbought area confirmed by previous maximums and at the same time both DPO and the price are breaking a support line of an ascending trend.
The indicator is rarely used for getting trading signals. It should be noted that the indicator can be effective enough only when it is used together with other indicators. Nevertheless, it is a useful tool revealing the cycles for setting the optimal width of other indicators windows.
This indicator allows to select smoothing and averaging algorithms out of ten possible versions:
- SMA - simple moving average;
- EMA - exponential moving average;
- SMMA - smoothed moving average;
- LWMA - linear weighted moving average;
- JJMA - JMA adaptive average;
- JurX - ultralinear smoothing;
- ParMA - parabolic smoothing;
- T3 - Tillson's multiple exponential smoothing;
- VIDYA - smoothing with the use of Tushar Chande's algorithm;;
- AMA - smoothing with the use of Perry Kaufman's algorithm.
It should be noted that Phase1 and Phase2 parameters have completely different meaning for different smoothing algorithms. For JMA it is an external Phase variable changing from -100 to +100. For T3 it is a smoothing ratio multiplied by 100 for better visualization, for VIDYA it is a CMO oscillator period and for AMA it is a slow EMA period. In other algorithms these parameters do not affect smoothing. For AMA fast EMA period is a fixed value and is equal to 2 by default. The ratio of raising to the power is also equal to 2 for AMA.
The indicator uses SmoothAlgorithms.mqh library classes (must be copied to the terminal_data_folder\MQL5\Include). The use of the classes was thoroughly described in the article "Averaging Price Series for Intermediate Calculations Without Using Additional Buffers".

Translated from Russian by MetaQuotes Ltd.
Original code: https://www.mql5.com/ru/code/571
 Cycle Period
This indicator is designed for measurement of a financial asset price change periodicity. Cycle Period allows to create adaptive versions of oscillators.
 Stochastic Cyber Cycle
Adaptive Stochastic oscillator.
 Adaptive CG Oscillator
Adaptive CG Oscillator is a CG Oscillator that can adapt to constantly changing market cycles of a real financial asset.
 X2MA NRTR
The hybrid of the universal moving average and NRTR indicator. In this indicator the values of the moving average are corrected with the help of NRTR algorithm (Nick Rypock Trailing Reverse).