Join our fan page
- Views:
- 9314
- Rating:
- Published:
-
Need a robot or indicator based on this code? Order it on Freelance Go to Freelance
Description:
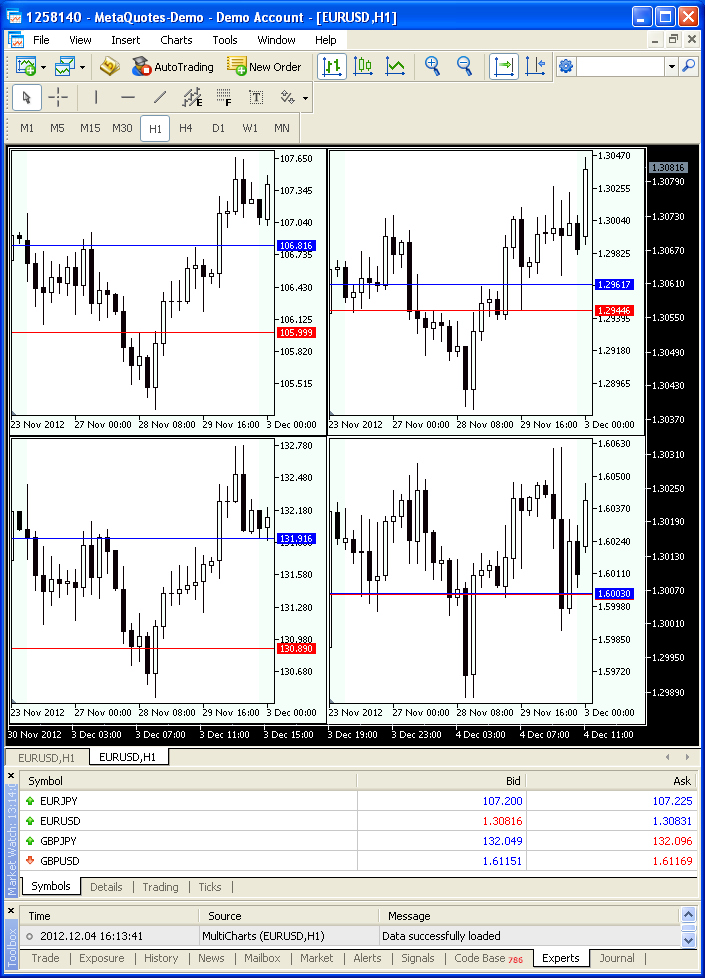
Sometimes it is necessary to monitor several charts simultaneously to find correlations between changes in the rates of various currency pairs. This script allows traders to do that displaying several subcharts in a single chart window.
The script has been developed to create charts for the Championship's Minutes at the Automated Trading Championship 2012.
Therefore, it includes:
- Drawing graphical objects in a single window (using CChartObjectSubChart standard class).
- Changing graphical objects display settings (background color, scale, grid, scrolling, etc.).
- Graphical object display area shift (using ChartNavigate method, as well as CHART_FIXED_MAX and CHART_FIXED_MIN properties).
- Drawing a rectangle on a graphical object (OBJ_RECTANGLE object).
- Drawing horizontal lines of the average open prices of short and long positions (using OBJ_HLINE).
- Downloading data for the lines from the file (the text file with the data should be placed in terminal_data_folder\MQL5\Files).
CSubChartExtended class derived from CChartObjectSubChart has been developed for drawing subcharts. It is derived from CChartObject class - the basic class for working with graphical objects.
After examining and slightly changing the code, you will be able to enable displaying several currency pair charts in a single window in the way that is convenient to you.
Image:

Drawing several charts in a single window
Translated from Russian by MetaQuotes Ltd.
Original code: https://www.mql5.com/ru/code/1345
 iEnvelopes_HTF
Envelopes drawn in ZigZag form. They can be drawn fixing Time Frame and then calculate input parameters
 Exp_X2MA
The Expert Advisor Exp_X2MA is drawn on the basis of X2MA universal Moving Average change.
 MultiJFatlSignal
The MultiJFatlSignal indicator shows the information about active trends using the JFatl four indicators value from different Time Frame
 Pivot Lines TimeZone
The Pivot levels indicator, the Pivot sublevels and the Camarilla levels drawing the indicator buffers and the horizontal lines
