Three robots are not always three bets: how many real bets your portfolio holds

Most investors who run more than one robot, or follow more than one signal, do it for the same reason: if one has a bad month, the others carry it. That is diversification, and it is the only part of risk control that can make the swings smaller without asking for a better entry.
It only works if the bets are really separate. And the number of robots on the screen is a poor way to count them.
Count the losing days, not the robots
Two robots are two bets only if they lose on different days. Two systems that trade the same market at the same session, or the same metal against different currencies, or the same index under two names, usually lose together. The code can be completely different. The account does not see the code. It sees the sum of what they lose on the same morning.
The same holds for signals. Three providers who all trade gold during the London session are one bet with three subscription fees.
There is a number for it
Take six systems with the same risk, and the same correlation between every pair of them. Correlation measures how much two results move together: 0 means completely apart, 1 means as one. The number of independent bets they add up to is 6 / (1 + 5 x correlation).
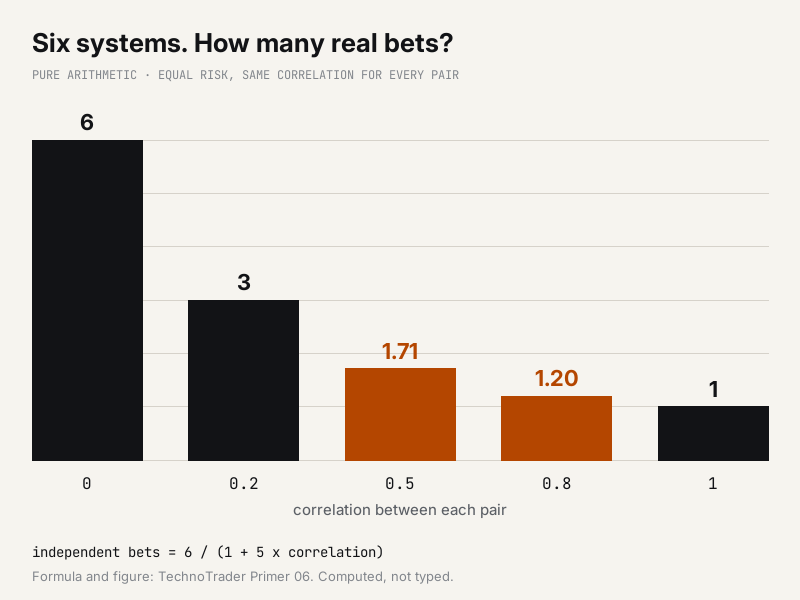
At a correlation of 0.2, six systems are worth three independent bets. At 0.5, a little under two. At 0.8, which is ordinary for the same asset under different names, a little over one. Most of the protection is gone long before the six equity curves start to look alike.
The same arithmetic for three robots: at a correlation of 0.6 they are worth about 1.36 bets, not three. On a morning when all three lose together, the account loses what one robot at three times the size would have lost.
The honest half: correlation moves
Correlation is not a fixed property of two systems. It is measured over a past window, and that window is usually a calm one. In a sharp sell-off, markets that normally move apart tend to fall in the same week, and the bets that looked separate pull together exactly when separation was the point. A correlation measured on quiet months is the best case, not the plan.
And spreading out does not raise the average. Every system keeps its own edge, good or bad. What changes is how deep the whole account falls on the way to the same place, which is what decides whether you stay with it long enough to get there.
A check you can run on your own account
1. Group by what moves them. Put each robot or signal into a group by the market and session it really trades, not by its name. Gold against several currencies is one group. Long positions in several pairs against the same currency are one group.
2. Mark the losing days. From each system's history, list its worst days. If two systems share most of their worst days, treat them as one bet for sizing, whatever their curves look like on average.
3. Add the risk inside each group first. Set a limit for the group and divide it between its members. Six positions at 1% each on one gold move is a 6% day.
We run the same check before a new system joins the ones we already trade. The first question is not its return. It is whether it loses on the same days as the others, because the account only ever sees the sum.
Our robots, signals and their records as they stand today are on our MQL5 profile. Past results, ours included, do not predict future ones.