

Apple is one of the most liquid and closely watched shares in the world, but does its performance change depending on the day of the week? To answer that question, I analysed 4,173 daily AAPL returns from 5 January 2010 to 7 August 2026. The result is unusually clear: in this sample, Monday was the strongest day by a considerable margin.
How the test was performed
For every session, I calculated the close-to-close percentage return and assigned it to the weekday on which the return ended. This detail matters. A “Monday return” measures the move from Friday’s close to Monday’s close, so it includes the weekend gap. Likewise, Tuesday measures Monday close to Tuesday close. Each observation was then grouped into Monday, Tuesday, Wednesday, Thursday or Friday.
I compared the average return, median return, best and worst session, number of observations, percentage of positive sessions and the compounded result of taking only returns assigned to that weekday. The figures are gross: commissions, spread, slippage, financing, taxes and execution constraints are not included. Corporate actions are reflected through the adjusted price series used to produce the supplied dataset.
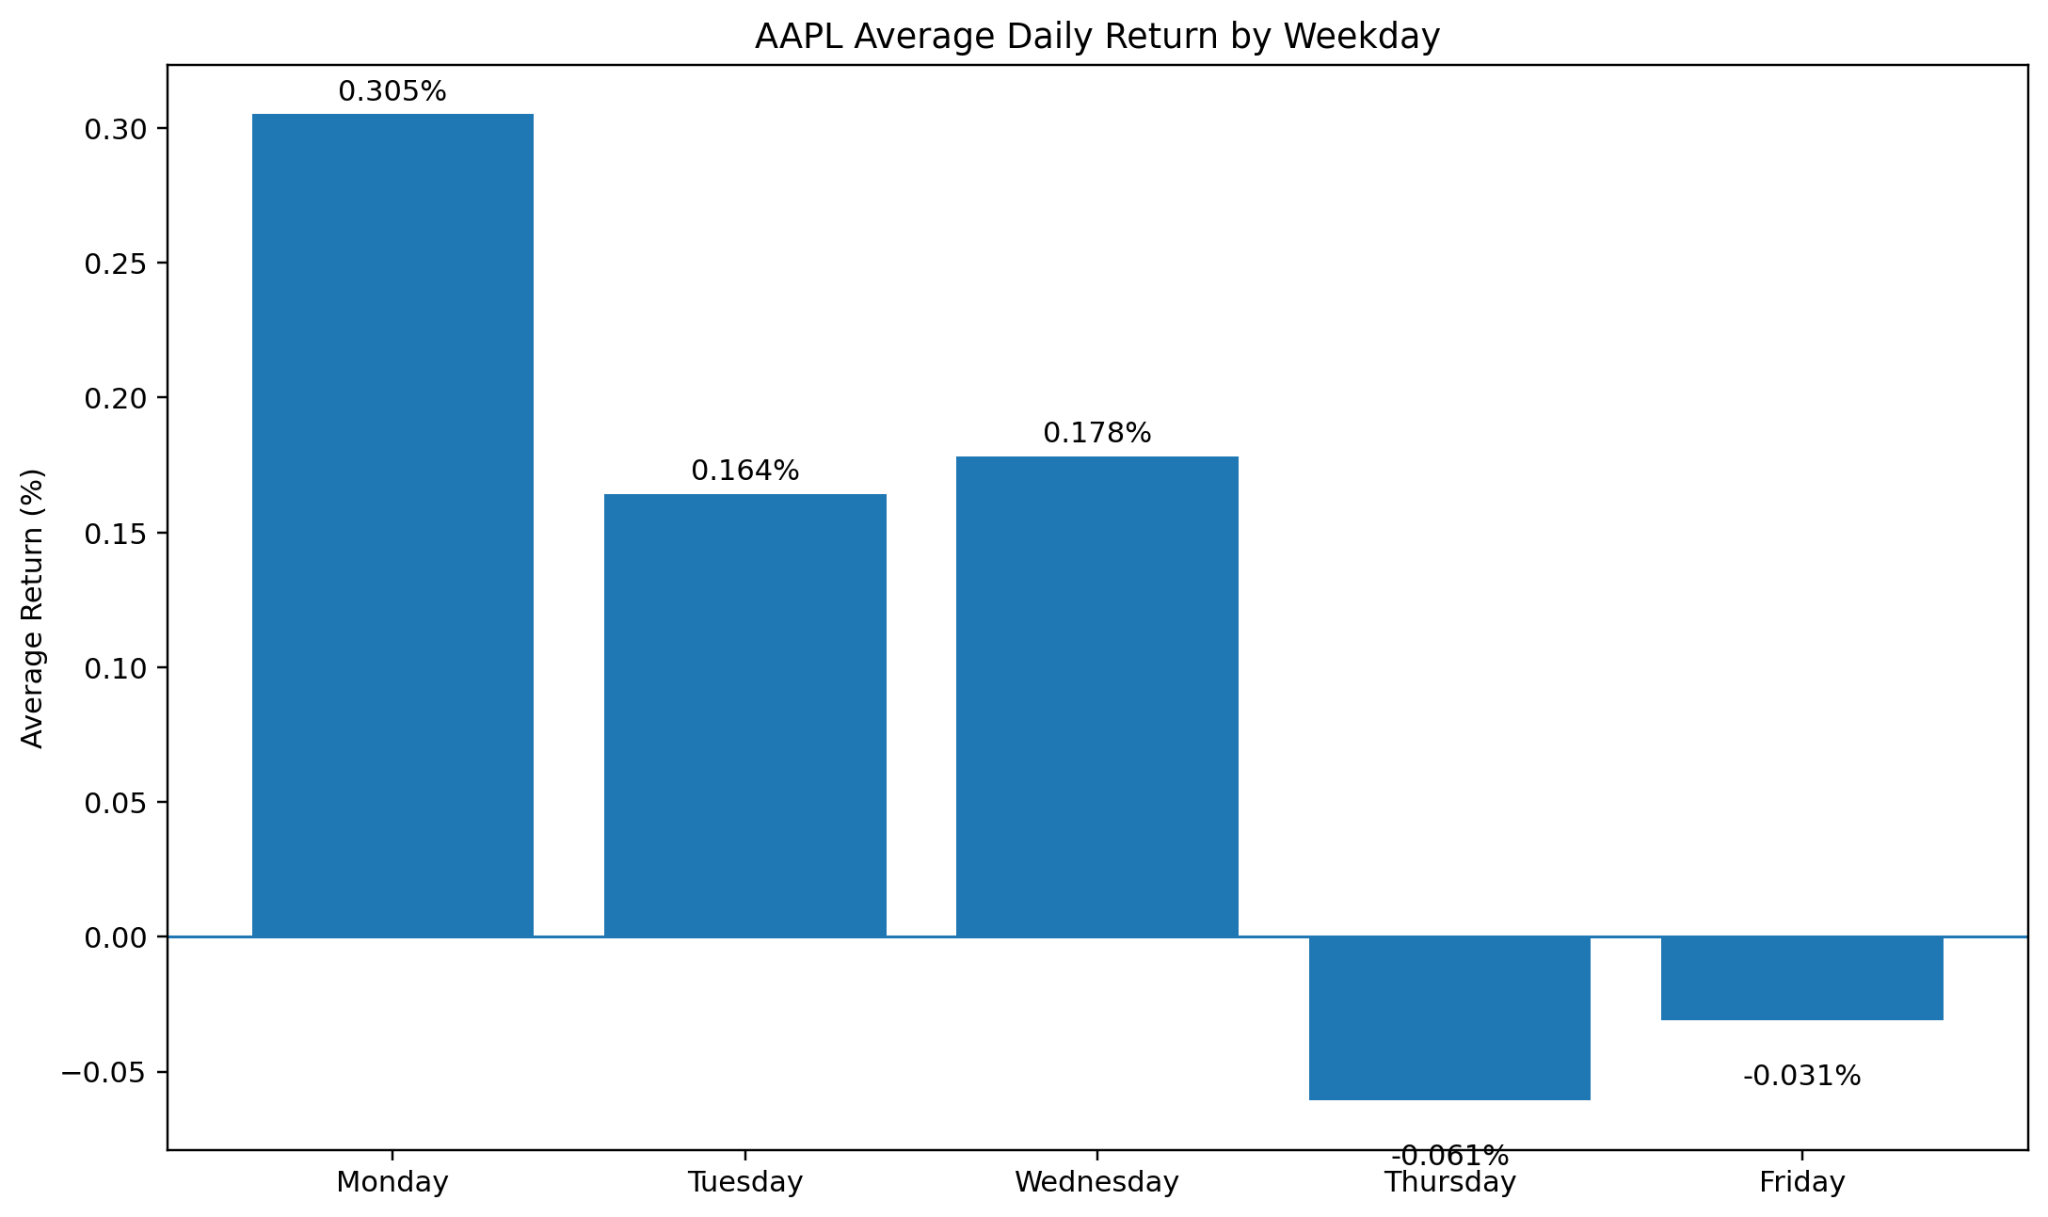
Figure 1. Average AAPL close-to-close return for each weekday.
The headline result: Monday leads
Monday generated an average return of 0.305%. That is almost twice Tuesday’s 0.164% and comfortably above Wednesday’s 0.178%. Thursday and Friday were negative on average, at -0.061% and -0.031% respectively. In practical terms, the strongest historical bias appeared at the start of the week, while the latter part of the week offered no positive average edge in this sample.
The median tells an equally important story. Monday’s median return was 0.355%, actually higher than its mean. This suggests that the result was not created solely by a handful of enormous positive outliers. Tuesday and Wednesday also had positive medians, while Thursday and Friday remained slightly negative.
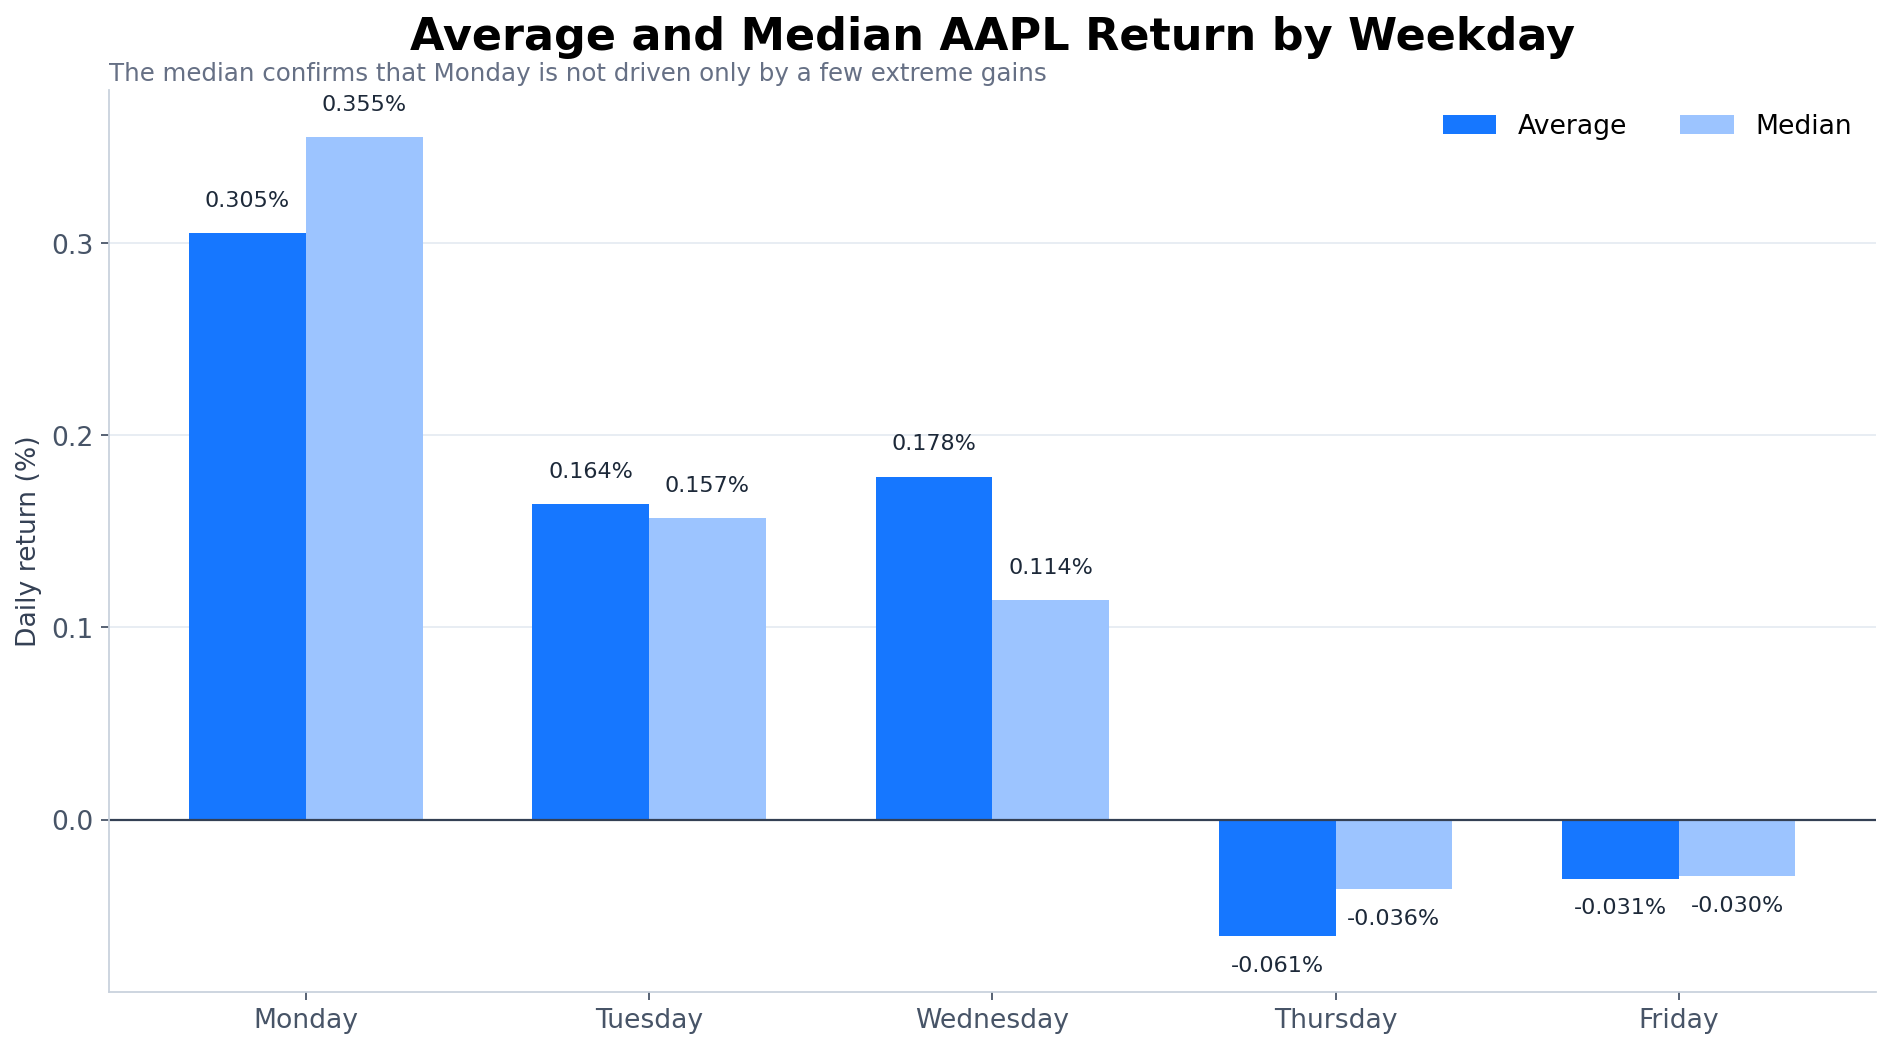
Figure 2. Average versus median return. Both measures rank Monday first.
| Weekday | Average | Median | Win rate | Sessions | Weekday-only total |
|---|---|---|---|---|---|
| Monday | 0.305% | 0.355% | 59.36% | 780 | 841.41% |
| Tuesday | 0.164% | 0.157% | 54.48% | 859 | 264.17% |
| Wednesday | 0.178% | 0.114% | 54.09% | 856 | 299.86% |
| Thursday | -0.061% | -0.036% | 48.75% | 841 | -47.47% |
| Friday | -0.031% | -0.030% | 49.10% | 837 | -32.08% |
How often was each weekday positive?
Average return can be misleading if a small number of large gains dominate the result, so win rate provides another useful check. Monday closed positively 59.36% of the time—the highest frequency in the study. Tuesday and Wednesday were positive in roughly 54% of sessions. Thursday and Friday fell below 50%, matching their negative average and median returns.
A 59% win rate does not mean low risk. Approximately four out of every ten Monday observations were still negative, and losses can cluster. Nevertheless, the agreement between Monday’s mean, median and win rate makes the pattern more convincing than a result supported by only one statistic.
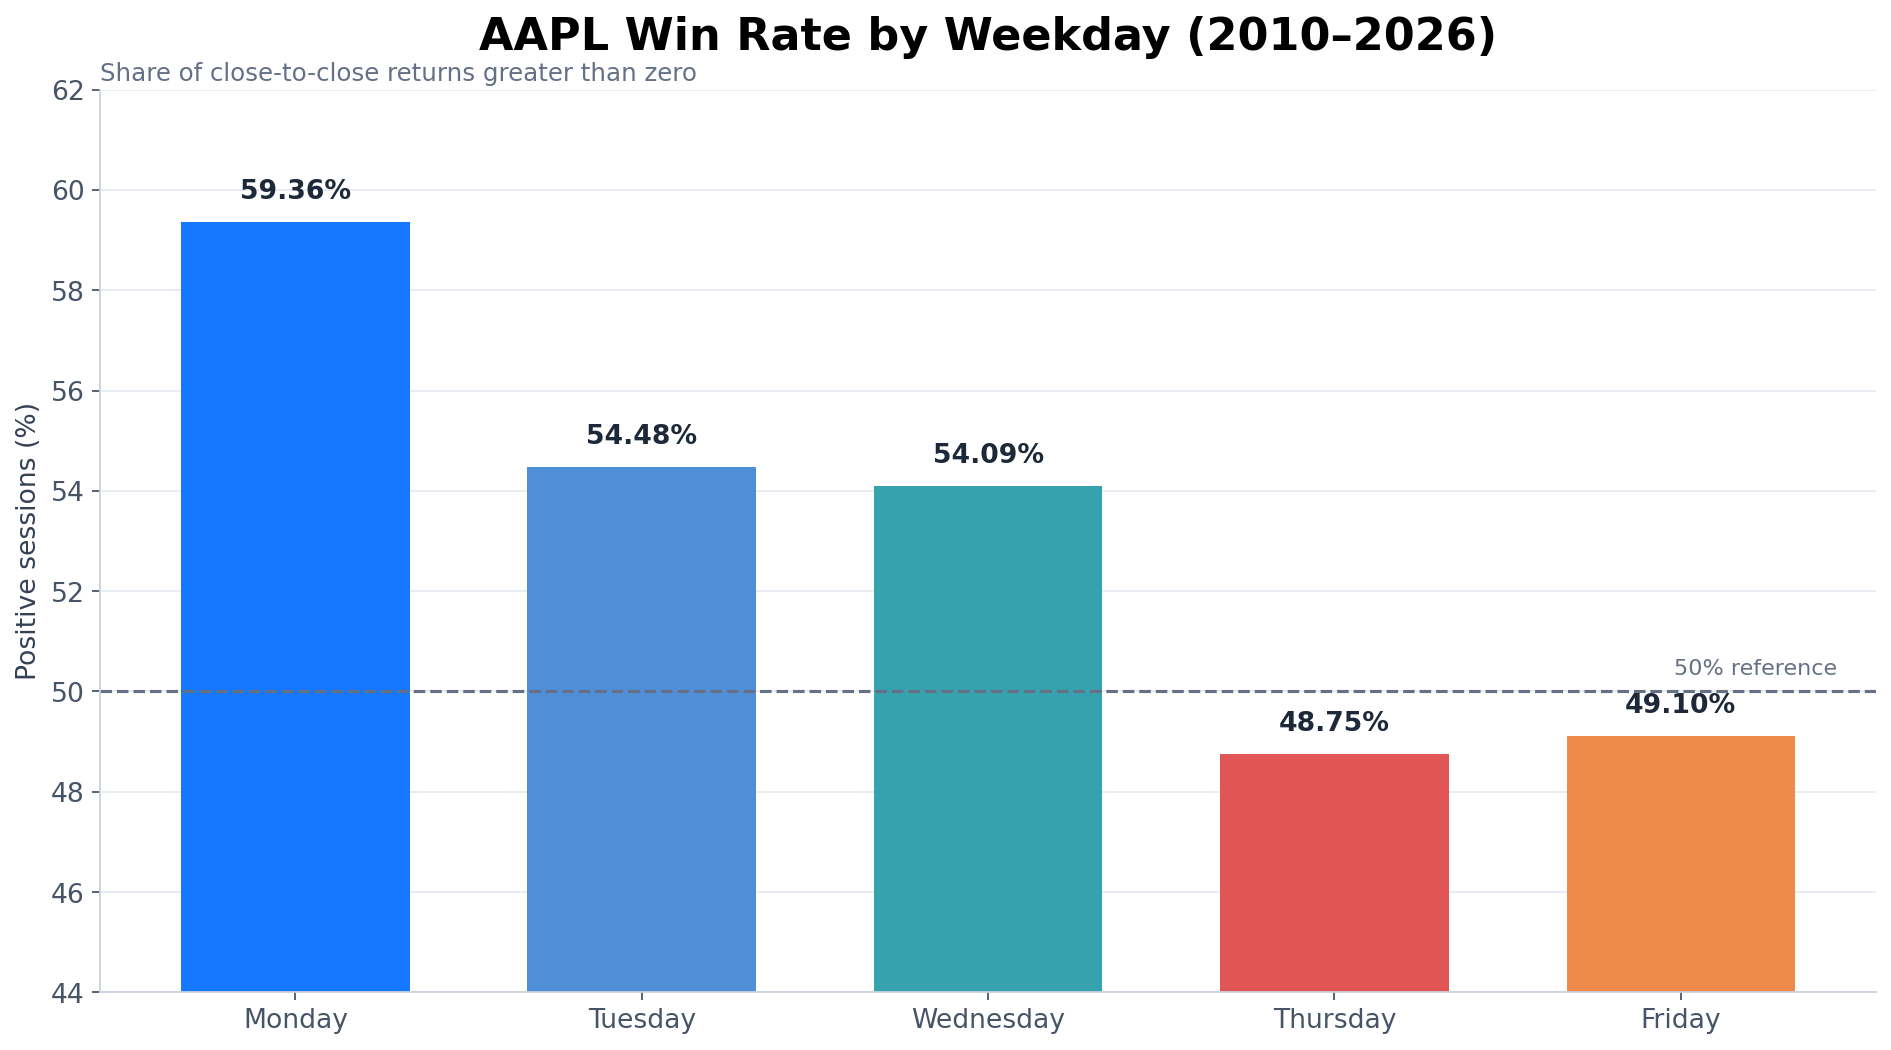
Figure 3. Monday had the highest proportion of positive observations.
Compounding the weekday effect
The weekday-only calculation compounds each return from the selected group while staying in cash for all other groups. Under this simplified construction, Monday returned 841.41% over the full period. A hypothetical $10,000 became approximately $94,141 before costs. Wednesday finished near $39,986 and Tuesday near $36,417. By contrast, Thursday reduced the same capital to about $5,253, while Friday ended near $6,792.
This comparison is useful for visualising the cumulative size of the bias, but it must not be confused with a directly executable backtest. To capture the Monday close-to-close return, for example, a trader would need exposure from Friday’s close through Monday’s close. Real orders, weekend gap risk and transaction costs can materially change the outcome. The curves also use different numbers of observations because holidays do not affect every weekday equally.
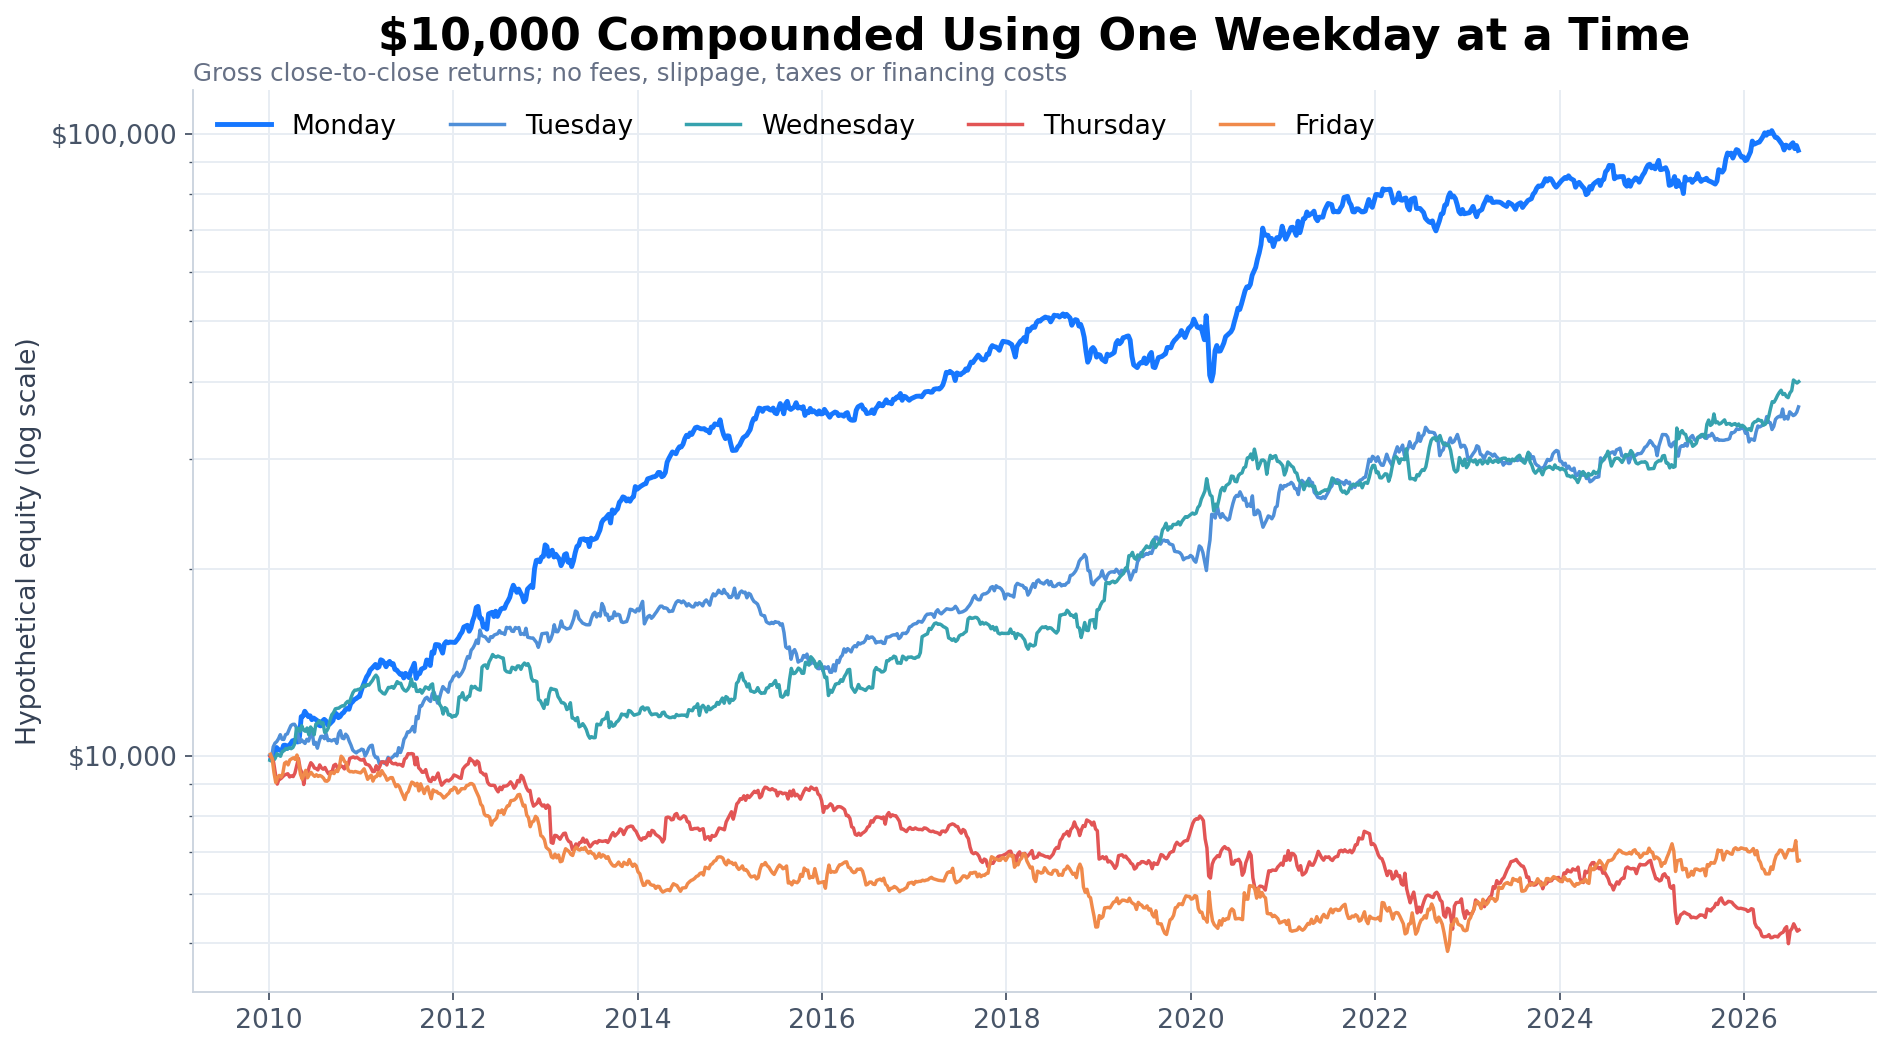
Figure 4. Hypothetical growth of $10,000 using one weekday group at a time. The vertical axis is logarithmic.
The risk hidden behind the averages
Daily AAPL movements were far larger than the weekday averages. Monday’s best observation was 9.31%, but its worst was -12.86%. Wednesday contained the largest positive session at 15.33%, while Thursday fell as much as -12.36%. A daily edge measured in tenths of one percent therefore sits inside a distribution capable of moving by several percent in either direction.
A simple one-sample statistical test places Monday’s average well above zero in this dataset (t-statistic approximately 4.59, unadjusted p-value below 0.001). Tuesday and Wednesday also pass the conventional 5% threshold, whereas Thursday and Friday do not. Still, daily returns are not perfectly independent, five weekdays were tested, and the market regime changed repeatedly between 2010 and 2026. Statistical significance in one historical sample is not the same thing as a stable, tradeable edge.
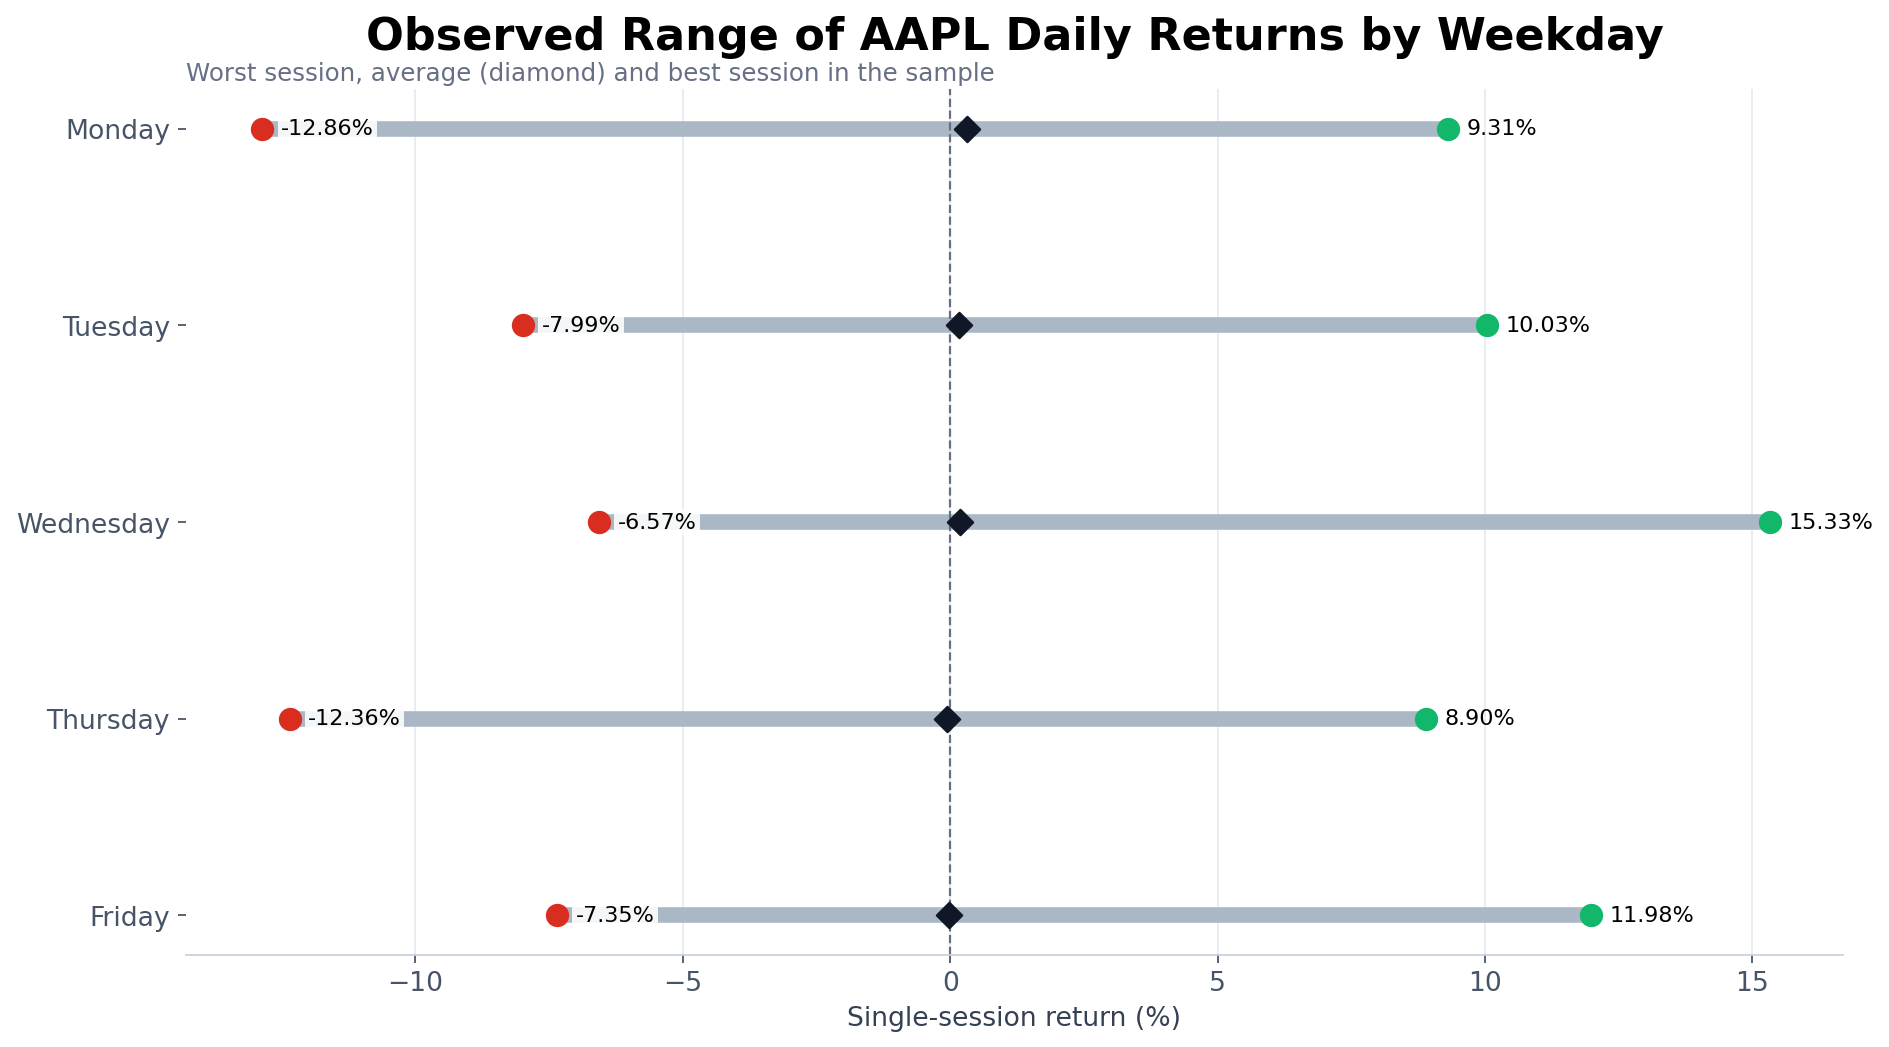
Figure 5. The average edge is small relative to the most extreme observed sessions.
Can this become a trading strategy?
The weekday effect is best treated as a filter, not as an entry signal by itself. One possible research path is to allow long setups from Friday’s close into Monday only when the broader AAPL trend is positive, volatility is below a defined ceiling and no major scheduled event is imminent. Another option is to use the weekday score to size an existing strategy rather than opening trades solely because the calendar says Monday.
Before deployment, I would retest the rule in rolling windows, compare the first and second halves of the sample, reserve recent years as out-of-sample data and include realistic costs. Earnings weeks, option-expiration weeks and different volatility regimes should also be examined separately. Finally, the entry and exit must be defined precisely: market-on-close, next-session open or intraday execution will not reproduce the same return series.
Conclusion
Based on the supplied AAPL data from 2010 through 7 August 2026, Monday was the best day of the week. It ranked first in average return, median return, win rate and hypothetical weekday-only compounding. Tuesday and Wednesday also showed positive historical tendencies, whereas Thursday and Friday were weak.
The most useful conclusion is not “buy Apple every Monday without conditions.” It is that weekday information may contain a meaningful bias worth combining with trend, volatility, event and risk-management rules. The next step is to test whether Monday’s advantage survives out-of-sample periods and realistic execution assumptions. If it does, the calendar can become one component of a disciplined AAPL trading model rather than a standalone prediction.
Data period: 5 January 2010–7 August 2026. Sample: 4,173 daily close-to-close returns