How to read a Strategy Tester report like a skeptic: five numbers before profit

The Strategy Tester report is built to make you look at one thing: the equity curve. Green line goes up, brain says yes. A skeptic reads the same report in a different order: five numbers first, profit last. Here are the five, each one illustrated with the report from our own gold portfolio backtest, so you can see the method on a real document.
One note before we start: every figure below comes from an MT5 backtest, and past performance does not guarantee future results. That sentence is not legal decoration, it is the correct way to read every number in this post.
1. Number of trades: your sample size
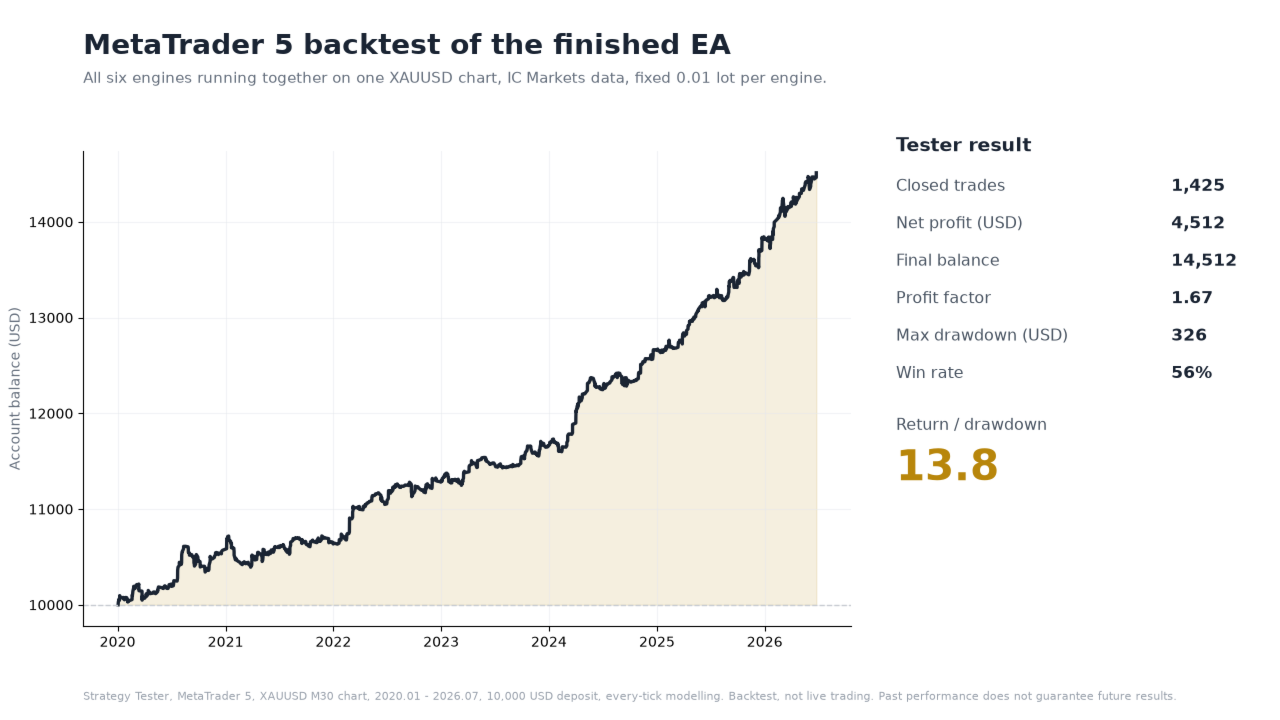
Before anything else, find the total number of trades. This is your sample size, and everything else in the report is only as reliable as this number is large. A strategy showing a gorgeous curve over 40 trades is a story, not a statistic. Our gold portfolio backtest contains 1,425 trades across seven years. That is a sample you can actually reason about: with hundreds of trades per logic, a lucky streak cannot dominate the totals the way it can in a small test. As a rough habit, treat anything under a few hundred trades as an anecdote and read the rest of the report accordingly.
2. Profit factor: quality of the edge
Profit factor is gross profit divided by gross loss. Below 1.0 the strategy loses. Around 1.0 it pays your broker and nothing else. Our backtest shows 1.67: for every dollar lost, 1.67 dollars were won. Now the skeptic's twist: a very high profit factor on a small sample is a warning, not a virtue. Profit factor 4.0 over 30 trades usually means curve-fitting. A moderate figure over a thousand trades tells you more than a spectacular one over fifty.
3. Maximum drawdown in currency, not just percent
Percentages flatter. A "3 percent drawdown" sounds harmless until you convert it into money and into your own stomach. Look for the drawdown expressed in the deposit currency and relate it to the lot size used in the test. In our backtest the maximum drawdown was 326 USD, with each of the six engines trading 0.01 lots. That ratio matters: if you scale the lot, the drawdown scales with it. A report that hides the drawdown, or shows it only against an enormous starting balance, is doing arithmetic against you.
4. Distribution by year: was it one lucky season?
A seven-year total can be manufactured by one exceptional year followed by six flat ones. Break the result down by year and count how many years closed positive. In our backtest, all seven years from 2020 to 2026 finished positive. That does not promise anything about year eight, but it tells you the edge was not a single regime: the strategy survived trending years, quiet years and violent ones. The reverse case is common and worth naming: a test where 80 percent of the profit comes from one year is really a bet that that year returns. If a report only shows the aggregate, ask for the yearly breakdown.
5. Costs: was the test charged real spread and commission?
The quietest way to fake a backtest is to run it on frictionless data. Check the modeling quality (real ticks where possible), the spread applied, and whether commission and swap were included. Gold is especially sensitive here: XAUUSD spreads widen hard around news, and a strategy that is profitable at 10 points of spread can be a donation at 40. Our tests are run with spread and commission included, because a result that ignores costs is not a result, it is fiction with decimals.
Then, and only then, the profit
After those five checks, the profit number finally has context. In our case: 4,512 USD net over seven backtest years at 0.01 lots per engine. Read alone, that number is marketing. Read after the five checks (sample of 1,425 trades, profit factor 1.67, drawdown 326 USD, seven positive years out of seven, costs included), it becomes information. Still a backtest, still no guarantee, but information.
If you want to practice this reading, take any EA from the Market and open its published report with these five questions. You can start with our free one, Wonder 8 (USDJPY H1, fixed 0.01 lot, stop loss and take profit on every trade), run your own test in the Strategy Tester, and read it like a skeptic before you ever look at the green line.