The random-walk yardstick: the hit rate you would have with no edge at all

Someone shows you a strategy with a 67% hit rate. Before you ask anything else, ask for the stop and the target. If the stop is twice as far away as the target, 67% is exactly what a coin flip produces. The formula is more than 300 years old, and I ran it against eleven years of real minute data to see whether it holds on prices, not just on paper. This is the short version of that study.
| Question | What hit rate does a strategy with no information at all reach? |
| Data | DAX, NQ and SPX, cash session, 2015 to 2026, about 35,000 coin-flip trades per market and stop-target ratio. |
| Answer | Stop divided by (stop plus target). Gross expectancy is zero in all twelve cells tested; net it is minus cost divided by stop. |
The drunkard between two ditches
A drunkard stands on a path. One metre to his left is a ditch, two metres to his right a second one. He steps randomly left or right. How often does he fall into the right ditch? Not half the time. The right ditch is twice as far away:
P(target first) = distance to stop / (distance to stop + distance to target) = 1 / (1 + 2) = 33%.
The left ditch is your stop, the right one your target. The drunkard knows nothing about the market and still reaches the target one time in three. That is the yardstick: the hit rate without any information.
| Stop : target | Chance reaches the target in |
|---|---|
| 1 : 1 | 50.0% |
| 1 : 2 | 33.3% |
| 1 : 5 | 16.7% |
| 1 : 10 | 9.1% |
| 2 : 1 | 66.7% |
| 3 : 1 | 75.0% |
And the expectation of the drunkard, in R? Target +2 R, stop −1 R, hit rate 1/3: one third times +2 plus two thirds times −1 equals zero. That holds for every ratio. Tightening the stop or moving the target changes the hit rate, never the expectation. The only number chance leaves behind is the cost: net expectation = −cost / stop distance. A high hit rate alone says one thing: the stop is wide.
The formula on real prices
I let exactly this drunkard loose on DAX, NQ and SPX, 2015 to 2026, cash session only: one trade every 30 minutes, direction by a coin flip with a fixed seed, fixed stop and target in points, evaluated on one-minute candles. About 35,000 trades per market and ratio.
| Market | Stop : target (pts) | n | Target hit | Yardstick | Time exits | avg R gross | avg R net |
|---|---|---|---|---|---|---|---|
| DAX | 20 : 20 | 35,196 | 49.8% | 50.0% | 0.8% | +0.003 | −0.122 |
| DAX | 20 : 40 | 35,196 | 31.9% | 33.3% | 3.5% | +0.008 | −0.117 |
| DAX | 40 : 20 | 35,196 | 65.0% | 66.7% | 3.4% | 0.000 | −0.062 |
| NQ | 40 : 80 | 34,755 | 14.5% | 33.3% | 48.6% | +0.002 | −0.060 |
| NQ | 40 : 200 | 34,755 | 2.8% | 16.7% | 57.8% | +0.014 | −0.049 |
| SPX | 8 : 16 | 34,734 | 18.2% | 33.3% | 36.8% | +0.003 | −0.097 |
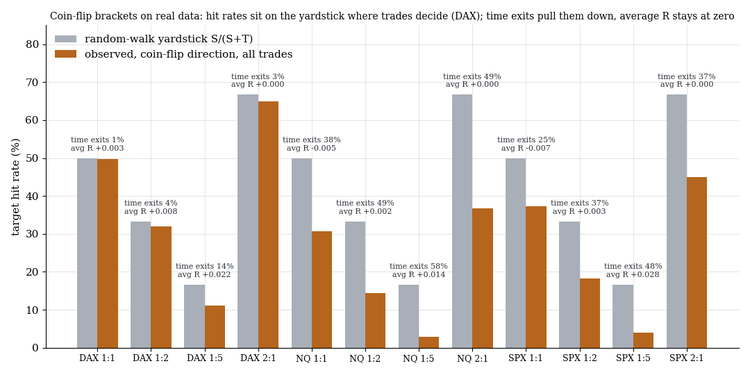
Observed hit rate against the yardstick, twelve cells on three markets.
On the DAX, where almost every trade decides within the session, the formula is right within one or two percentage points. Gross expectations across all twelve cells tested sit between −0.007 and +0.028 R, eleven of twelve below |t| = 2 with day-clustered errors. The net column is nothing but cost divided by stop. On NQ and SPX the raw hit rate falls far below the yardstick because many trades end undecided at the session close. The expectation does not fall. Which leads to the trap.
The trap: "we only count completed trades"
Some trades reach neither stop nor target by the close. The common answer is to count only the decided ones. On NQ with stop 40 and target 200, 57.8% of trades end undecided. Count only the decided ones and the hit rate drops to 6.6% against a yardstick of 16.7%, z = −32.7. That looks like a massive anti-edge. It is selection: the target is five times as far away and needs more time, so the trades decided by the close are disproportionately the ones that hit the near stop. Reverse the bracket to 80:40 and the decided-only hit rate rises to 71.7% against 66.7%. Now it looks like an edge, and it is the same selection.
The average R over all trades, with time exits valued at the close, stays at zero in every cell. Hit rates depend on your time limit. Expectations do not. Whoever counts only completed trades measures their holding time, not their strategy.
What it means for your EA
Before every optimisation, one question: what would my hit rate be if I knew nothing? Then two numbers instead of one: target hits against the yardstick with a z-score, and average R against −cost/stop with a t-statistic. If only the hit rate is high, you have a wide stop. The yardstick does not find edges. It removes the illusion of one.
Limits
Three index markets, cash session only, one trade every 30 minutes, fixed brackets in points. The yardstick assumes a driftless random walk; the drift-adjusted formula for trending indices is in the full study.
Full study (all tables, the method, every limit and the PDF): The random-walk yardstick
More research notes: my blog · Tools for prop firm accounts: all my products
Historical statistics are no guarantee of future market behaviour. This is not investment advice.