A 69% win rate can still be a thin edge: how to find the break-even win rate on any signal page

Most signal pages lead with the win rate, and 69% looks like a strong number. Our flagship account shows 69.54% this morning, over 4 659 closed trades. This post is about why that number on its own says almost nothing, and about the one line of arithmetic that turns it into something you can judge, on our account or on anyone else's.
What the win rate leaves out
A win rate counts trades, not money. It does not say how much a winning trade makes or how much a losing one costs. A system can win 90 trades in 100 and still lose money if its losses are large enough, and a system that wins 40 in 100 can make money if its wins are. The win rate is only half of a pair, and the other half is printed on the same page.
The break-even win rate, in one line
Every MQL5 signal page shows an average profit and an average loss per trade on its statistics tab. From those two numbers you can work out the win rate the account needs just to stand still:
break-even win rate = average loss ÷ (average win + average loss)
If wins and losses were the same size, you would need 50%. If the average loss is twice the average win, you need about 67%. The larger the losses are against the wins, the higher the bar the win rate has to clear.

Our own record, read this morning
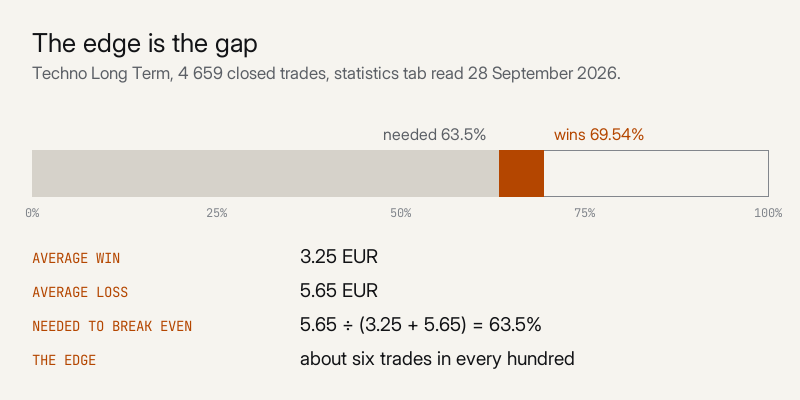
On the flagship account, Techno Long Term, the statistics tab read on 28 September 2026: 4 659 closed trades, 3 240 of them won (69.54%), an average win of 3.25 EUR and an average loss of 5.65 EUR. A loss costs about 1.7 times what a win pays.
5.65 ÷ (3.25 + 5.65) = 63.5%
That is the win rate this account needs just to break even. It wins 69.54%. So the edge is not 69.54%. It is the gap between the two, about six trades in every hundred, and everything the account has made lives in that gap.
What the gap tells you
A thin gap is not a fault. It is what a system with small, frequent wins and larger, rarer losses looks like. But it tells you how much room there is. If the average loss grew by a tenth, from 5.65 to 6.22 EUR, the break-even rate would rise to 65.7% and the gap would shrink by more than a third.
That is why the same win rate can describe a robust system or a fragile one. It depends entirely on what sits beside it.
Check any signal in two minutes
1. Open the statistics tab and note the profit trades percentage, the average profit and the average loss.
2. Divide the average loss by the sum of the two averages. That is the break-even win rate.
3. Compare it with the real win rate. If the real one sits only a point or two above, a slightly wider spread or a slower fill can erase the edge. If the gap is wide, the system has room.
4. If the page shows a very high win rate next to an average loss several times the average win, look at the worst trade and the drawdown before anything else. That shape is how a win rate is manufactured: small wins taken early, losses left to run.
One caution
Averages hide the shape of the losses. Two accounts with the same averages can have very different worst trades and very different drawdowns, so the break-even rate is a first check, not a verdict. And past results, ours included, do not predict future ones.
The figures in this post come from the public record of our flagship account on MQL5, where every closed trade since it began is listed: Techno Long Term, signal 2307342.