Building an MT5 P&L Dashboard: Day, Week, Month and Year Performance on the Chart
22 September 2026, 13:36

0
3
 Every MT5 statement tells you what happened. It does not tell you how a single month performed, how much of your floating P&L is actually green, or how much of your "profit" came from a deposit.
 I wanted those answers inside the terminal, without exporting CSV files and rebuilding the same pivot table every week. So I built AccountPnL Board, a MetaTrader 5 indicator that reads the account's own deal history and draws a compact P&L dashboard directly on the chart.
It is one .mq5 file. No DLLs, no network calls, no indicator sub-window, and no plot buffers.
WHY A CHART PANEL
Most account analytics tools either live in a separate window or require you to leave the terminal. I wanted the report where I already look: on the price chart, next to the instrument I am trading. The panel is a single bitmap drawn with CCanvas and attached as one OBJ_BITMAPLABEL. That keeps it independent of the chart's data window and template.
The indicator declares:
#property indicator_chart_window
#property indicator_plots 0
Zero plot buffers means no extra series, no data window entries and no effect on the chart's own calculations. The entire interface is painted by the indicator.
WHAT THE PANEL SHOWS
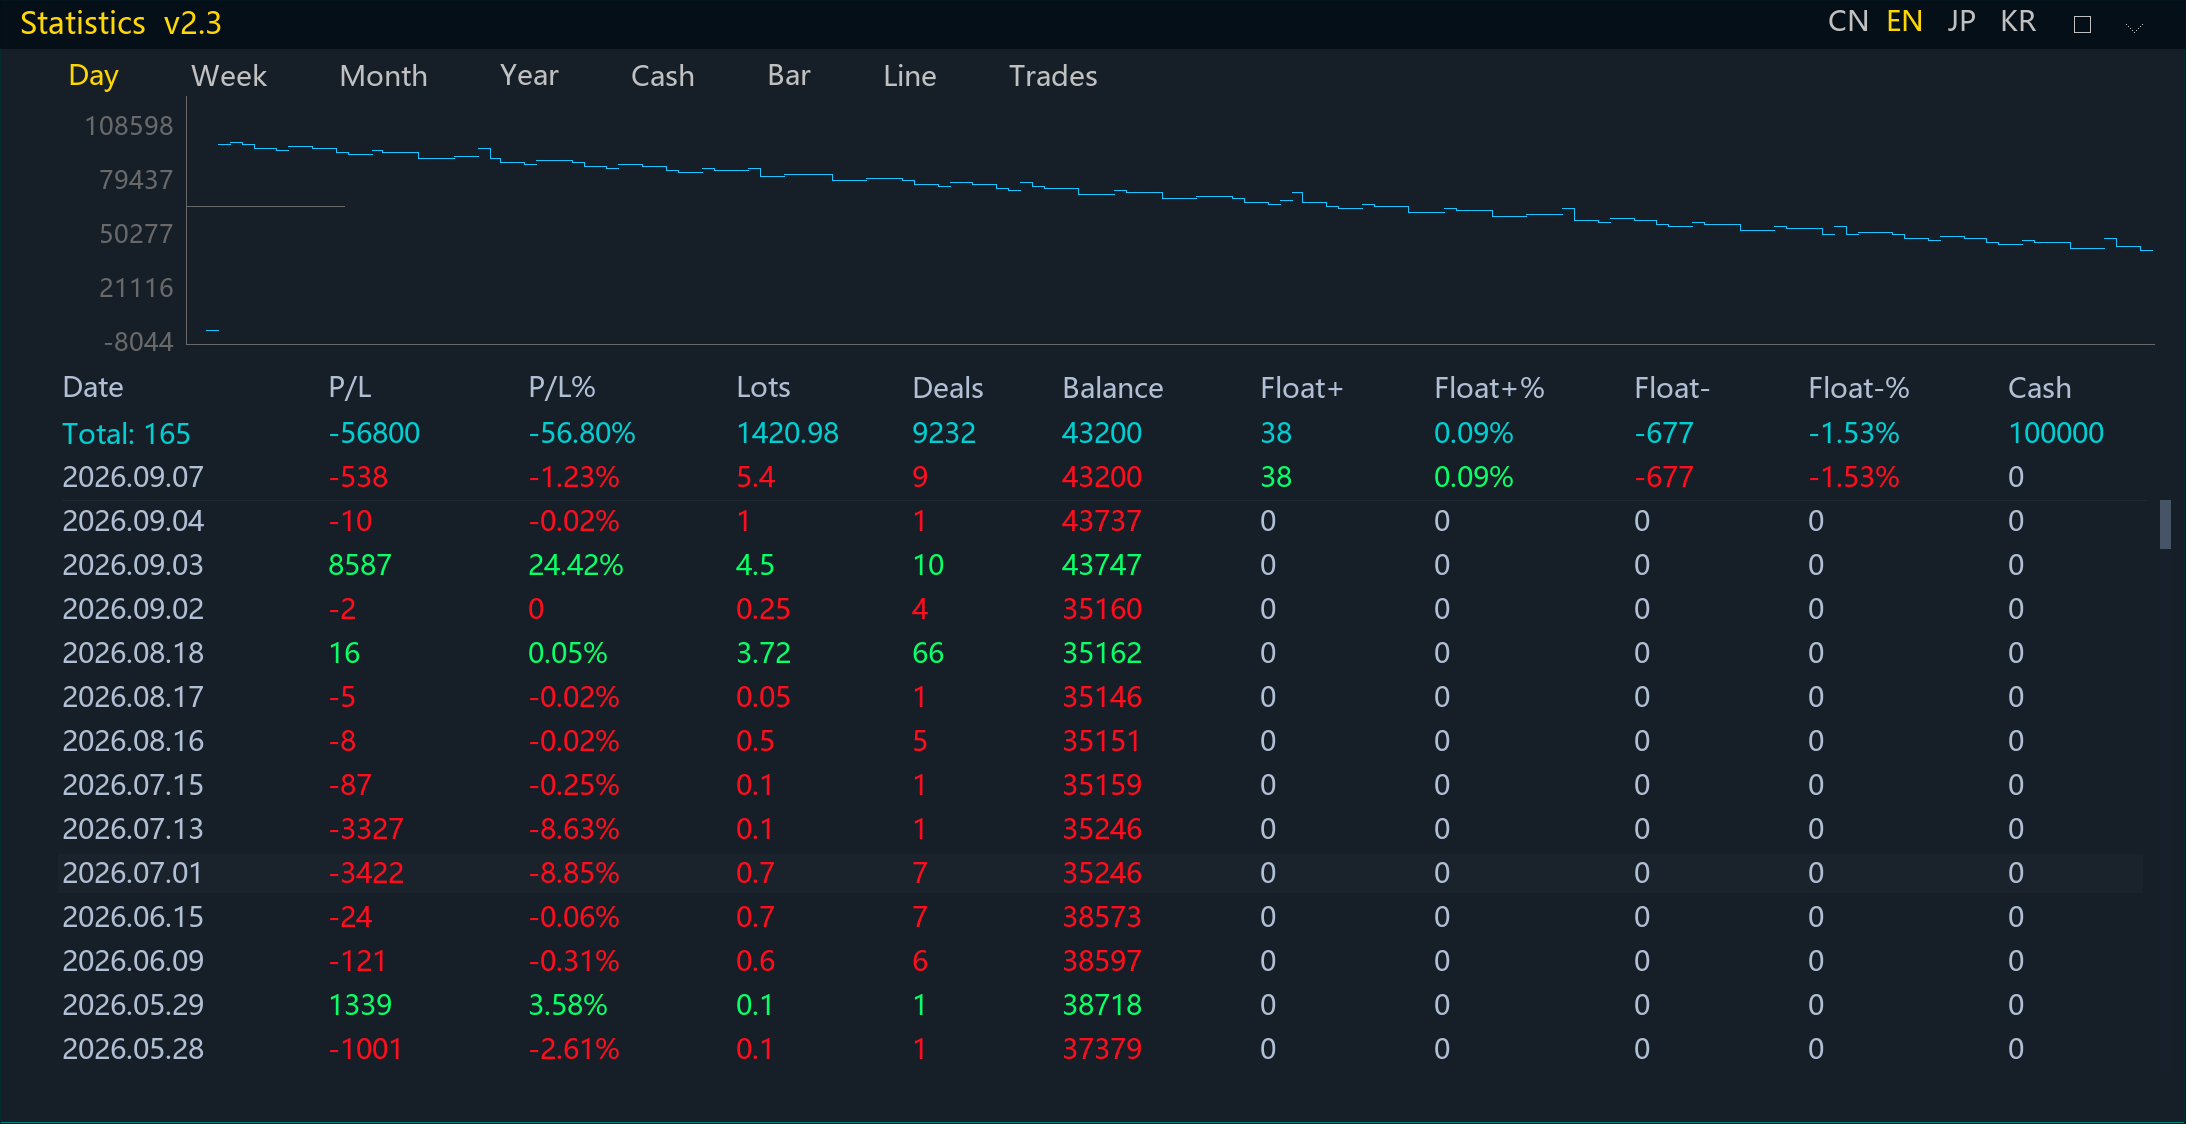
The main table has one row per period, switchable between Day, Week, Month and Year. Weeks start on Monday. Each row contains:
- Period start date
- Realised P&L
- P&L as a percentage
- Lots closed
- Number of closing deals
- Balance after the last deal of the period
- Floating profit and floating loss, split into separate columns
- Net deposit/withdrawal for the period
The newest period is pinned above a divider. Older periods scroll below it. The header and total row stay fixed, so you always know what the current period looks like without losing the historical context.
HOW THE NUMBERS ARE CALCULATED
Realised P&L is the sum of DEAL_PROFIT + DEAL_SWAP + DEAL_COMMISSION over BUY and SELL deals closed inside the period. Balance-type deals are excluded from trading P&L and reported separately in the cash ledger. That separation matters: a deposit can make a losing month look profitable if it is mixed into the same column.
P&L percentage uses the balance immediately before the period's first deal, not the account's initial deposit. Using the opening balance keeps periods comparable after deposits or withdrawals.
The balance column shows the account balance after the last deal of the period.
FLOATING P&L IS NOT ONE NUMBER
A single floating P&L figure can hide the shape of the open book. The panel therefore separates open positions into Float+ and Float- and shows both values and their percentage of current balance. If the net floating number is positive but almost all positions are losing, the split makes that visible immediately.
There is also an option to include commission already paid on open positions. In MQL5, POSITION_COMMISSION is deprecated and CPositionInfo::Commission() returns zero, so the indicator reads the entry deals and subtracts their DEAL_COMMISSION when this option is enabled.
CASH AND TRADES VIEWS
Two additional tabs cover the information that does not fit in a period table.
Cash lists every deposit and withdrawal with the balance after each one. It makes it possible to reconstruct how the account balance changed independently of trading results.
Trades lists every closed position: time, symbol, side, lots, open price, close price and P&L. The open price of a live position is cached by position ID and dropped when the position closes, because MQL5 does not keep that value for you after the position is gone.
CHART MODES
The panel can draw the balance curve as a line or as per-period bars. The automatic mode uses a line for the Day view and bars for Week, Month and Year. Clicking the chart-type tab again returns to automatic mode.
The drawing is aggregated by pixel column. A long history with thousands of deals does not make the frame slower; the chart is redrawn at screen resolution, not per deal.
LANGUAGES
The title bar has CN / EN / JP / KR buttons. Clicking one redraws the panel in Chinese, English, Japanese or Korean without restarting the indicator or rebuilding history. Dates and numeric values keep a neutral format.
One detail worth mentioning: Microsoft YaHei, which is a good Chinese font, contains no Hangul glyphs. The Korean interface therefore looked like a row of empty boxes in the first build. The indicator now resolves a font chain per language and switches to Malgun Gothic or Gulim for Korean when InpAutoFont is enabled.
PERFORMANCE NOTES
The data layer does one HistorySelect(0, TimeCurrent()) pass and builds the period table, trade log, cash ledger and historical balance curve together. Rebuilds are throttled by a timer, and OnTradeTransaction triggers an immediate rebuild when a deal is actually closed. The default refresh interval is three seconds.
This is not a signal, an expert advisor or a prediction tool. It does not place trades and it does not give trading advice. It reads the account's own history and presents it in a form that is easier to review.
WHAT I LEARNED
The most useful part of the project was not the drawing code. It was deciding what to calculate:
- P&L must include commission and swap.
- Deposits and withdrawals must be separated from trading results.
- Percentage return must use the period's opening balance.
- Floating P&L must be split by sign, not summed into one comforting number.
A statement can be complete and still fail to answer the questions a trader actually asks. The panel is my attempt to close that gap.
If you build something similar, the useful starting point is not the UI. Start with HistorySelect and write down exactly which deals belong to which period. The rest is formatting.