MSX AI Multi Symbol Scalper v2.10 — AUS200 M30 Strategy Tester Report | August 2026

1. AUS200 M30 Historical Strategy Tester Study
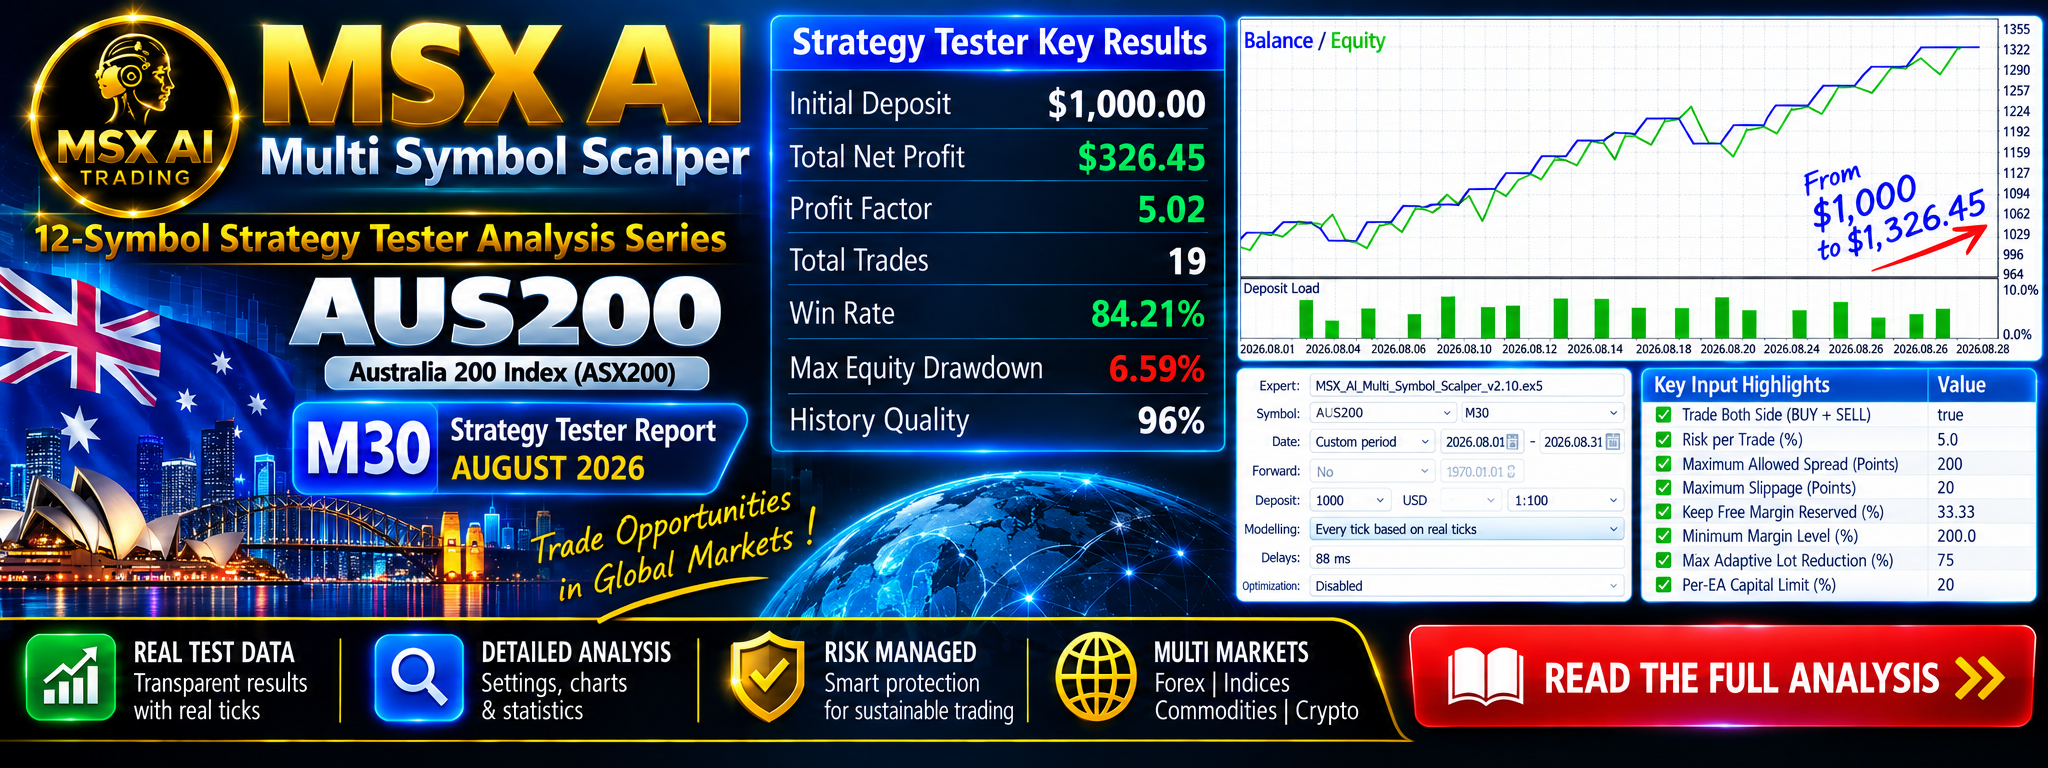
This report presents a historical MetaTrader 5 Strategy Tester study of MSX AI Multi Symbol Scalper v2.10 on AUS200 M30 for August 2026.
The test uses Every tick based on real ticks, a $1,000 initial deposit, 1:100 leverage, and the EA's configured risk, margin-control, Per-EA capital allocation, partial-profit, capital-protection and session-management parameters.
The result is an individual AUS200 study within the broader 12-Symbol Strategy Tester Analysis Series. It should not be interpreted as a complete multi-symbol portfolio result.
The report structure follows the same detailed format used for the EURUSD M15 Strategy Tester report, including the test configuration, trading/risk configuration, trend and Hard Reversal Exit settings, portfolio architecture note, complete tester statistics, BUY/SELL activity, tester evidence and historical-study disclosure.
2. Test Configuration
| Parameter | Configuration |
|---|---|
| Expert Advisor | MSX AI Multi Symbol Scalper v2.10 |
| Symbol | AUS200 |
| Timeframe | M30 |
| Test Period | 01–31 August 2026 |
| Forward Test | No |
| Initial Deposit | $1,000 |
| Leverage | 1:100 |
| Modeling | Every tick based on real ticks |
| Delay | 88 ms |
| Optimization | Disabled |
| Direction | Trade Both Side — BUY + SELL |
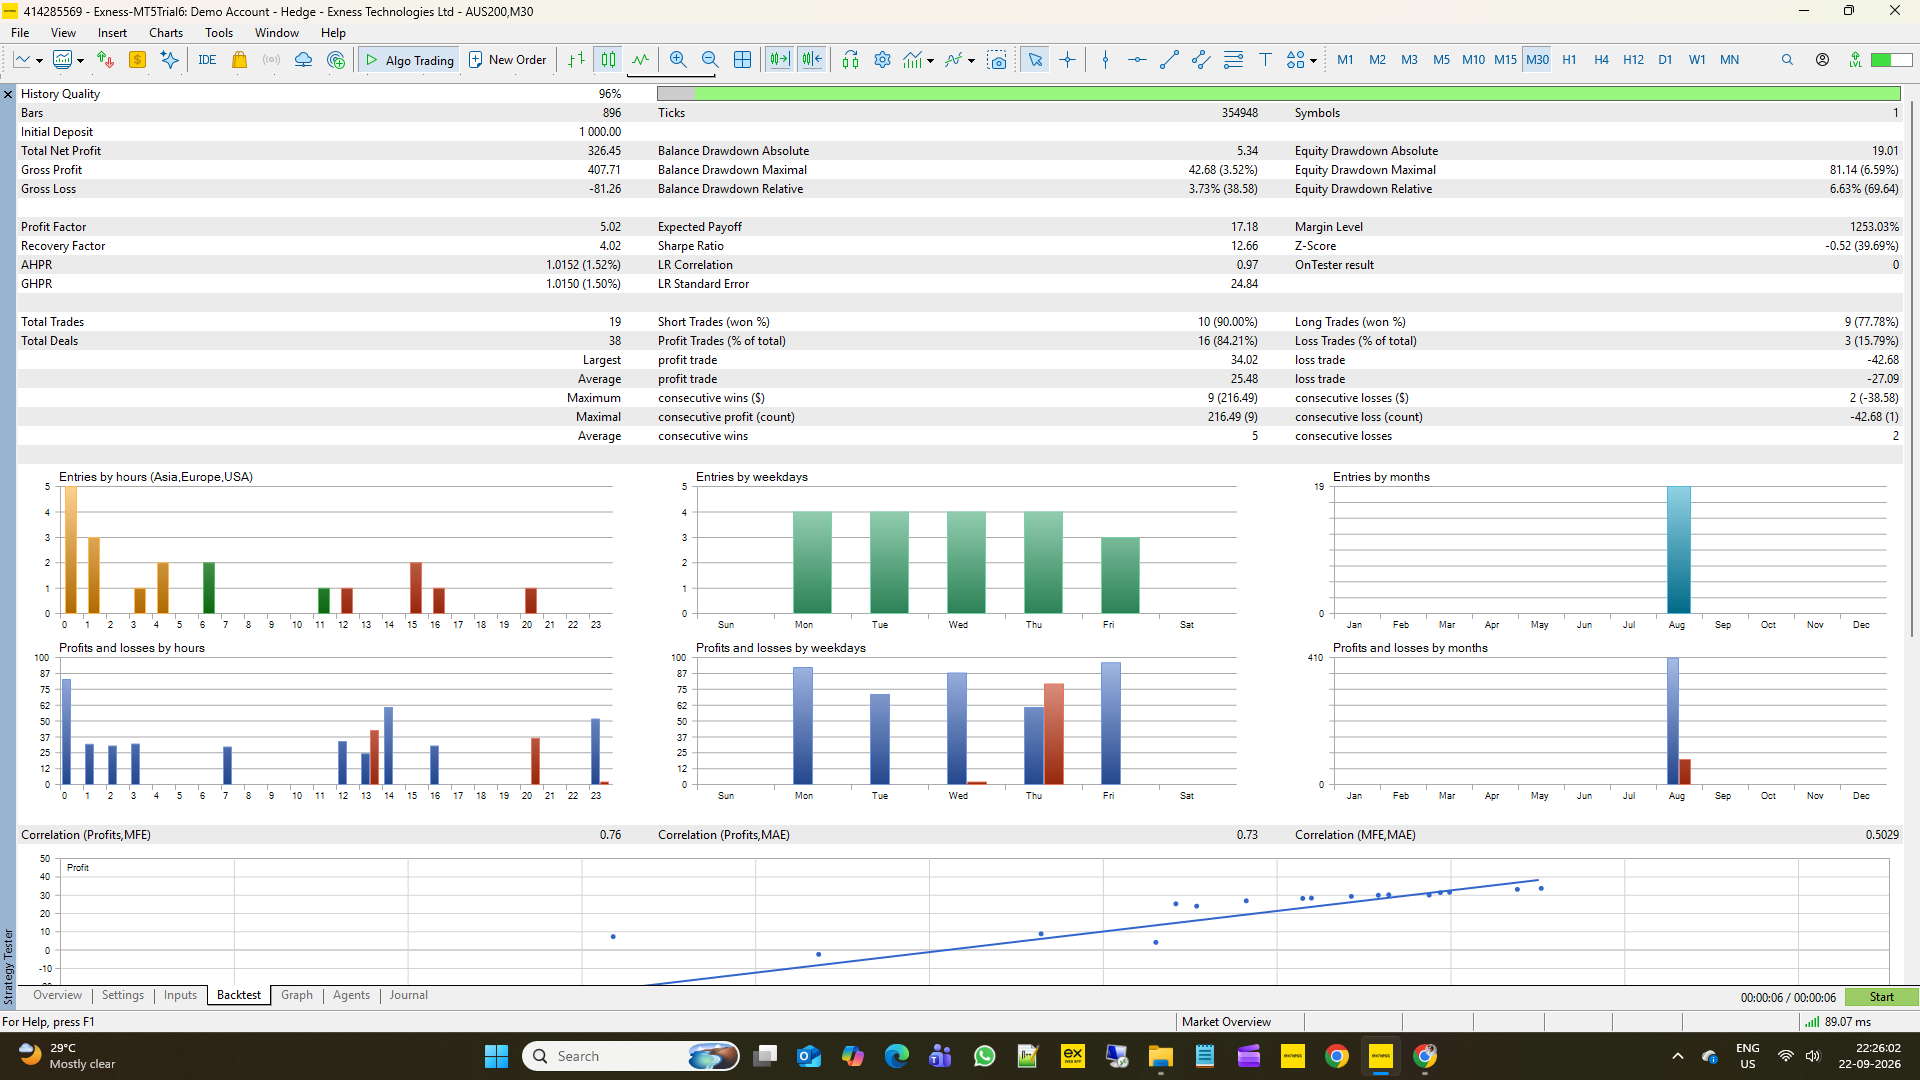
| History Quality | 96% |
| Bars | 896 |
| Ticks | 354,948 |
| Symbols | 1 |
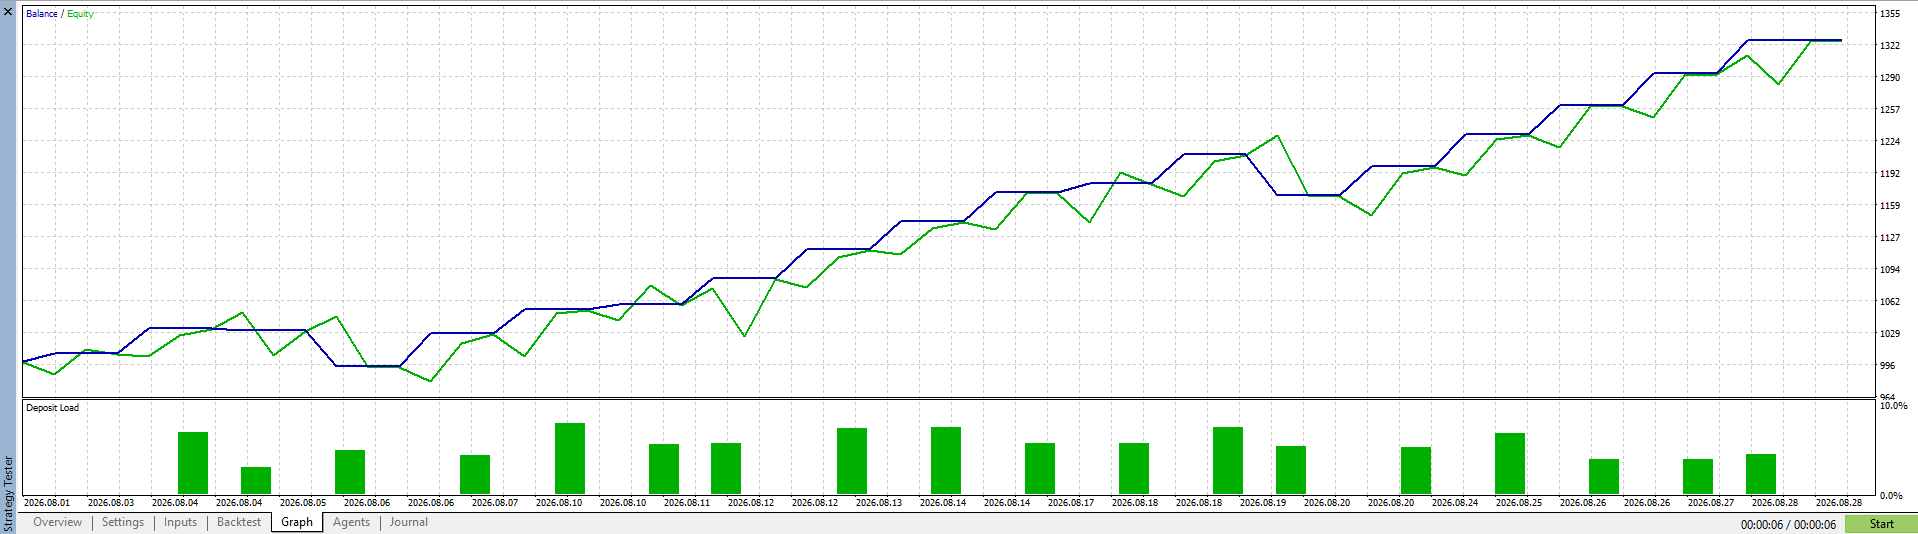
The Strategy Tester Journal confirms the final balance of $1,326.45, with 354,948 ticks and 896 bars generated for the AUS200 M30 test.
3. Key Trading & Risk Configuration
Trading & Execution
- Trade Only at New Trend Birth: False
- Limit One Trade per Trend: True
- Hard Reversal Exit: Enabled
- Soft Reversal Exit: Disabled
- Pullback Re-Entry: Disabled
- Maximum Spread Filter: Enabled — 200 points
- Maximum Slippage: Enabled — 20 points
- Lot Sizing Mode: Risk Percentage
- Risk per Trade: 5.0%
- Legacy Max Lot Cap: 0.05
Margin & Per-EA Capital Allocation
- Free Margin Reserved: 33.33%
- Minimum Projected Margin Level: 200%
- Excessive Adaptive Lot Reduction Block: Enabled
- Maximum Adaptive Lot Reduction: 75%
- Per-EA Capital Limit: Enabled
- Percentage Capital Limit: Enabled
- Per-EA Capital Allocation: 20%
These settings are particularly relevant when testing an index CFD because the broker's symbol-specific contract and margin requirements can affect the final executable lot size.
The Per-EA Capital Allocation is a dynamic margin-budget constraint, not a separate cash balance permanently assigned to AUS200.
4. Trend Configuration
The AUS200 M30 test used the following trend and signal configuration:
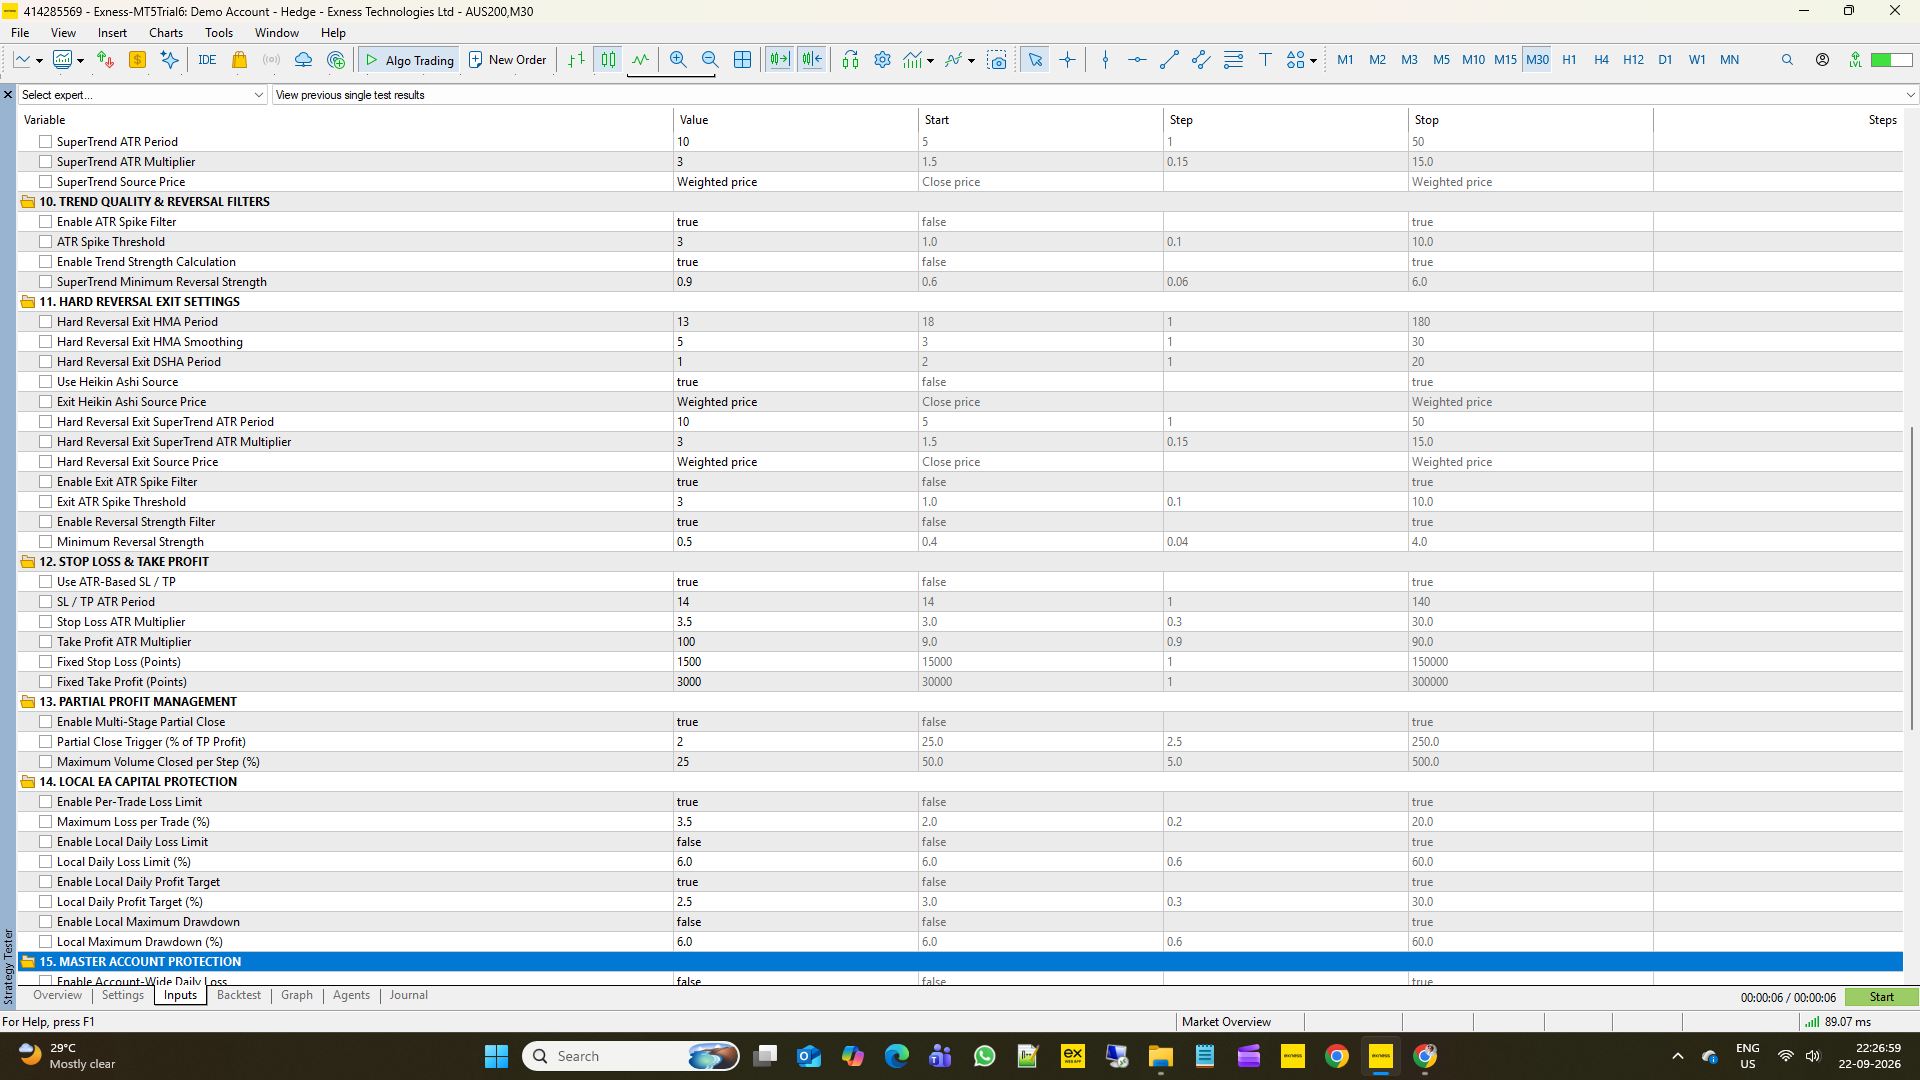
- HMA Period: 13
- HMA Smoothing: 5
- DSHA Period: 1
- Heikin Ashi Source: Enabled
- Source Price: Weighted Price
- SuperTrend ATR Period: 10
- SuperTrend ATR Multiplier: 3.0
- SuperTrend Source Price: Weighted Price
- ATR Spike Filter: Enabled
- ATR Spike Threshold: 3.0
- Trend Strength Calculation: Enabled
- Minimum Reversal Strength: 0.9
5. Hard Reversal Exit Configuration
The dedicated Hard Reversal Exit configuration used in this AUS200 M30 test was:
- Exit HMA Period: 13
- Exit HMA Smoothing: 5
- Exit DSHA Period: 1
- Heikin Ashi Exit Source: Enabled
- Exit Source Price: Weighted Price
- Exit SuperTrend ATR Period: 10
- Exit SuperTrend ATR Multiplier: 3.0
- Exit Source Price: Weighted Price
- Exit ATR Spike Filter: Enabled
- Exit ATR Spike Threshold: 3.0
- Reversal Strength Filter: Enabled
- Minimum Exit Reversal Strength: 0.5
The Hard Reversal Exit was enabled while Soft Reversal Exit and Pullback Re-Entry were disabled for this historical test.
6. Stop Loss, Take Profit & Partial Profit
ATR-Based SL/TP
- ATR-Based SL/TP: Enabled
- ATR Period: 14
- Stop Loss ATR Multiplier: 3.5
- Take Profit ATR Multiplier: 100
Multi-Stage Partial Profit
- Multi-Stage Partial Close: Enabled
- Partial Close Trigger: 2% of TP Profit
- Maximum Volume Closed per Step: 25%
The EA therefore used its multi-stage partial-profit mechanism during the test rather than treating the position as a single all-or-nothing position.
Local EA Capital Protection
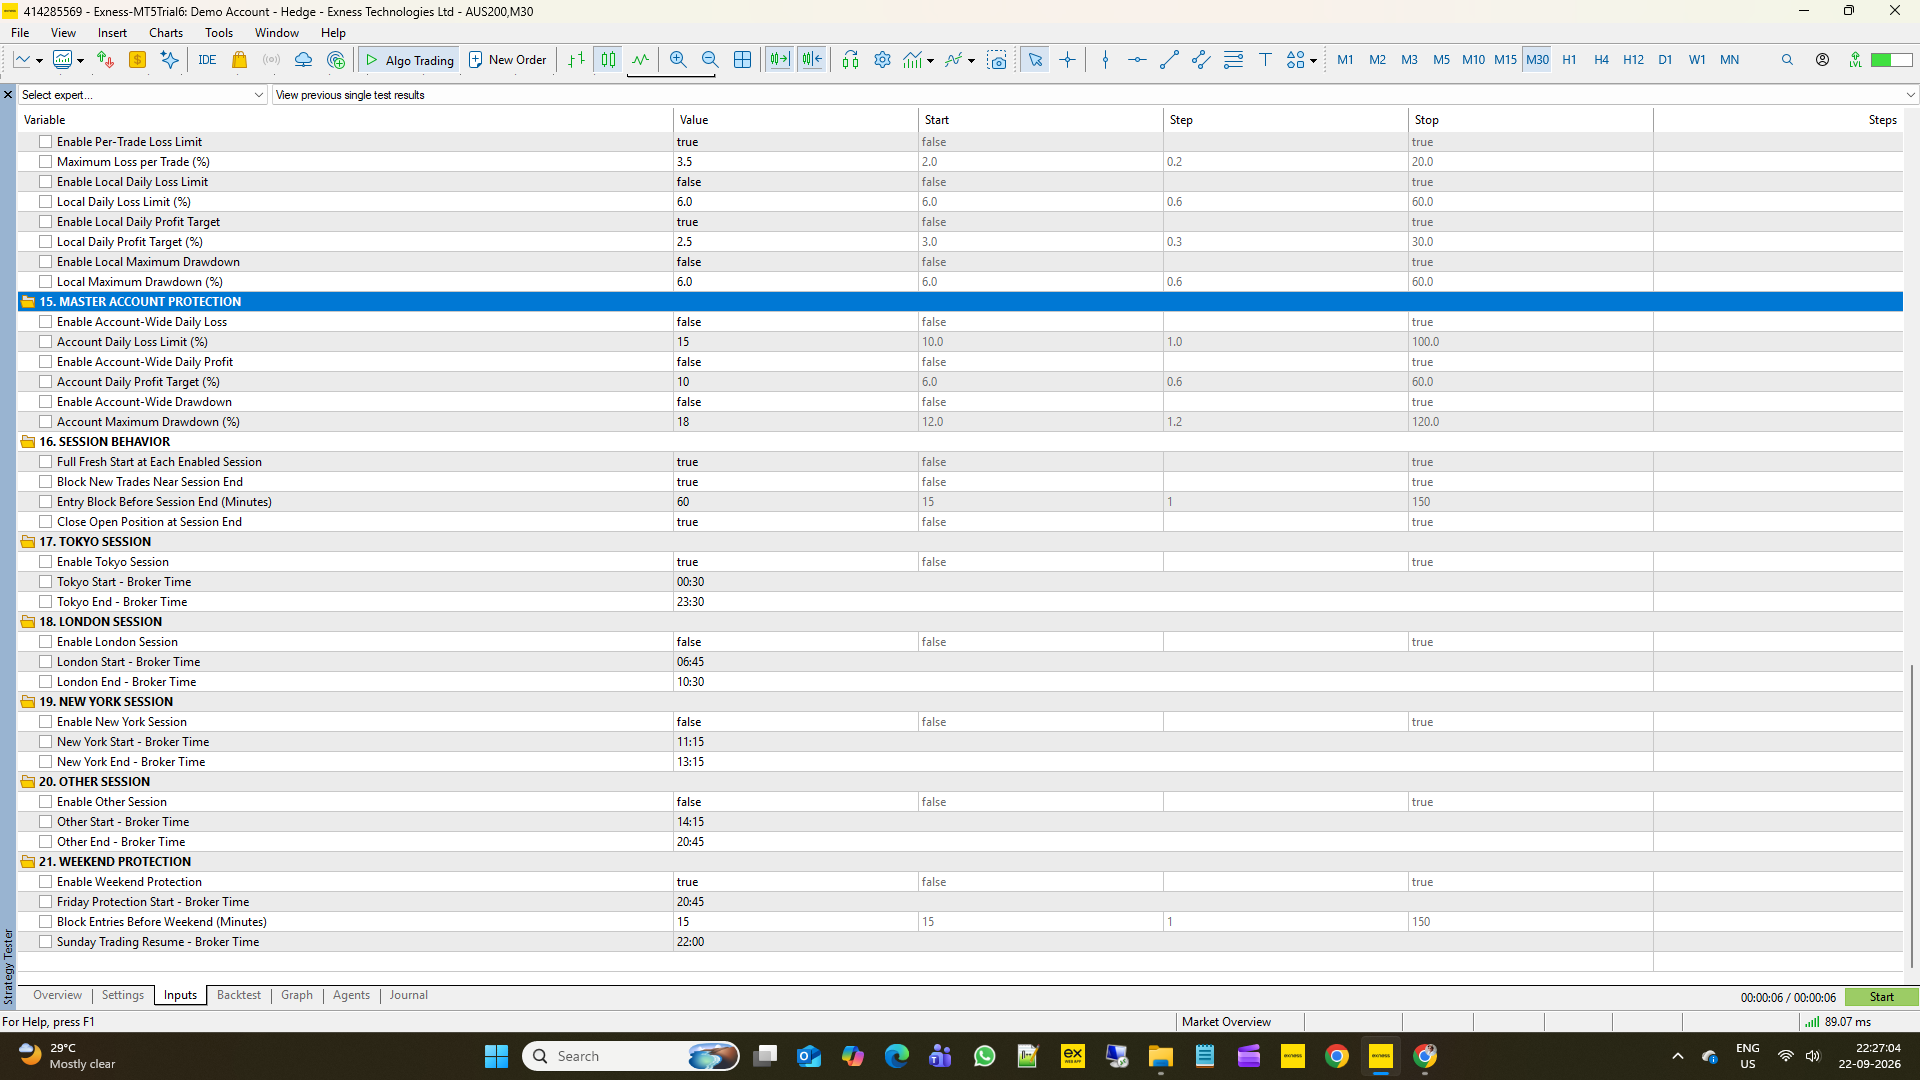
- Per-Trade Loss Limit: Enabled
- Maximum Loss per Trade: 3.5%
- Local Daily Loss Limit: Disabled
- Local Daily Loss Limit Setting: 6.0%
- Local Daily Profit Target: Enabled — 2.5%
- Local Maximum Drawdown: Disabled
- Local Maximum Drawdown Setting: 6.0%
The disabled functions remain shown here because their configured values were present in the Strategy Tester inputs, but they were not active protection triggers for this test.
Master Account Protection
The account-wide Master Protection functions were disabled for this individual AUS200 Strategy Tester study:
- Account-Wide Daily Loss: Disabled
- Account-Wide Daily Profit: Disabled
- Account-Wide Drawdown: Disabled
Their configured reference values were:
- Account Daily Loss Limit: 15%
- Account Daily Profit Target: 10%
- Account Maximum Drawdown: 18%
Because the three Master Protection switches were disabled, those values did not act as active limits during this individual-symbol test.
7. Session & Weekend Configuration
General Session Behaviour
- Full Fresh Start at Each Enabled Session: Enabled
- Block New Trades Near Session End: Enabled
- Entry Block Before Session End: 60 minutes
- Close Open Position at Session End: Enabled
Tokyo Session / Trading Session
- Tokyo Session: Enabled
- Start: 00:30 broker time
- End: 23:30 broker time
Other Sessions
- London Session: Disabled
- New York Session: Disabled
- Other Session: Disabled
Therefore, this particular AUS200 M30 test was configured to operate through the enabled broker-time Tokyo session window rather than separately activating the London, New York or Other session blocks.
Weekend Protection
- Weekend Protection: Enabled
- Friday Protection Start: 20:45 broker time
- Block Entries Before Weekend: 15 minutes
- Sunday Trading Resume: 22:00 broker time
8. Note — Understanding the Multi-Symbol Portfolio Architecture
The AUS200 result shown here represents one symbol and one EA instance in the Strategy Tester.
MSX AI Multi Symbol Scalper can also be deployed through multiple EA instances across different symbols, timeframes and trading-direction configurations.
The Per-EA Capital Allocation setting works together with:
- Free Margin Reserve
- Adaptive Lot Control
- Projected Margin Level protection
- Symbol-specific margin requirements
- Risk-based position sizing
It is therefore a dynamic margin-budget constraint, rather than a separate cash balance permanently assigned to AUS200.
The portfolio architecture can operate dynamically:
Valid Setup → Margin Check → Position Opened → Partial Profit Event → Partial Volume Reduced → Margin Released → Another Valid Setup May Use Available Margin
An EA does not force a trade when the required margin conditions are not satisfied.
Consequently, this individual AUS200 result should not simply be multiplied by the number of symbols or added together with the other individual Strategy Tester reports to represent a portfolio result.
9. Strategy Tester Results
| Metric | AUS200 M30 |
|---|---|
| History Quality | 96% |
| Bars | 896 |
| Ticks | 354,948 |
| Symbols | 1 |
| Initial Deposit | $1,000.00 |
| Final Balance | $1,326.45 |
| Total Net Profit | $326.45 |
| Gross Profit | $407.71 |
| Gross Loss | -$81.26 |
| Profit Factor | 5.02 |
| Expected Payoff | $17.18 |
| Recovery Factor | 4.02 |
| Sharpe Ratio | 12.66 |
| AHPR | 1.0152 (1.52%) |
| GHPR | 1.0150 (1.50%) |
| Balance Drawdown Absolute | $5.34 |
| Balance Drawdown Max | $42.68 (3.52%) |
| Balance Drawdown Relative | 3.73% ($38.58) |
| Equity Drawdown Absolute | $19.01 |
| Equity Drawdown Max | $81.14 (6.59%) |
| Equity Drawdown Relative | 6.63% ($69.64) |
| Margin Level | 1253.03% |
| Total Trades | 19 |
| Total Deals | 38 |
| Profit Trades | 16 (84.21%) |
| Loss Trades | 3 (15.79%) |
| Largest Profit Trade | $34.02 |
| Largest Loss Trade | -$42.68 |
| Average Profit Trade | $25.48 |
| Average Loss Trade | -$27.09 |
| Maximum Consecutive Wins | 9 ($216.49) |
| Maximum Consecutive Losses | 2 (-$38.58) |
| Average Consecutive Wins | 5 |
| Average Consecutive Losses | 2 |
| Z-Score | -0.52 (39.69%) |
| LR Correlation | 0.97 |
| LR Standard Error | 24.84 |
10. BUY / SELL Activity
SELL Trades
- Total: 10
- Winning: 9
- Win Rate: 90.00%
BUY Trades
- Total: 9
- Winning: 7
- Win Rate: 77.78%
Combined
| Direction | Trades | Winning Trades | Win Rate |
|---|---|---|---|
| SELL (Short) | 10 | 9 | 90.00% |
| BUY (Long) | 9 | 7 | 77.78% |
| Total | 19 | 16 | 84.21% |
The test therefore recorded a relatively balanced directional distribution, with 10 SELL trades and 9 BUY trades during the August 2026 historical period.
11. Historical Balance / Equity Curve
The Strategy Tester graph shows the historical progression of the Balance and Equity from the initial $1,000 deposit to the final tester balance of $1,326.45.
The graph also shows intermediate equity fluctuations and temporary drawdown periods during the test rather than displaying only the final balance.
The Strategy Tester graph additionally displays the Deposit Load during the historical test.
12. Strategy Tester Evidence
The following tester evidence is available for this AUS200 M30 study:
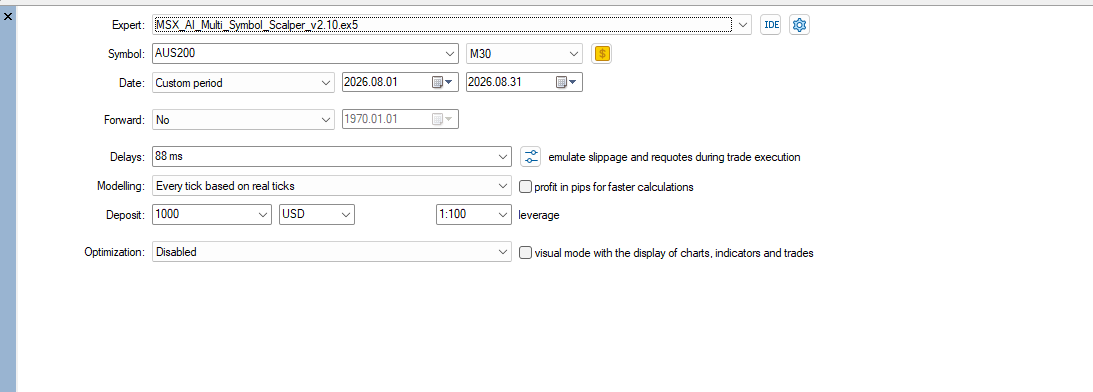
- Strategy Tester Settings — AUS200 M30, August 2026, real ticks, $1,000 deposit, 1:100 leverage and 88 ms delay.
- Strategy Tester Backtest Results — complete performance statistics.
- Strategy Tester Graph — historical Balance/Equity curve and Deposit Load.
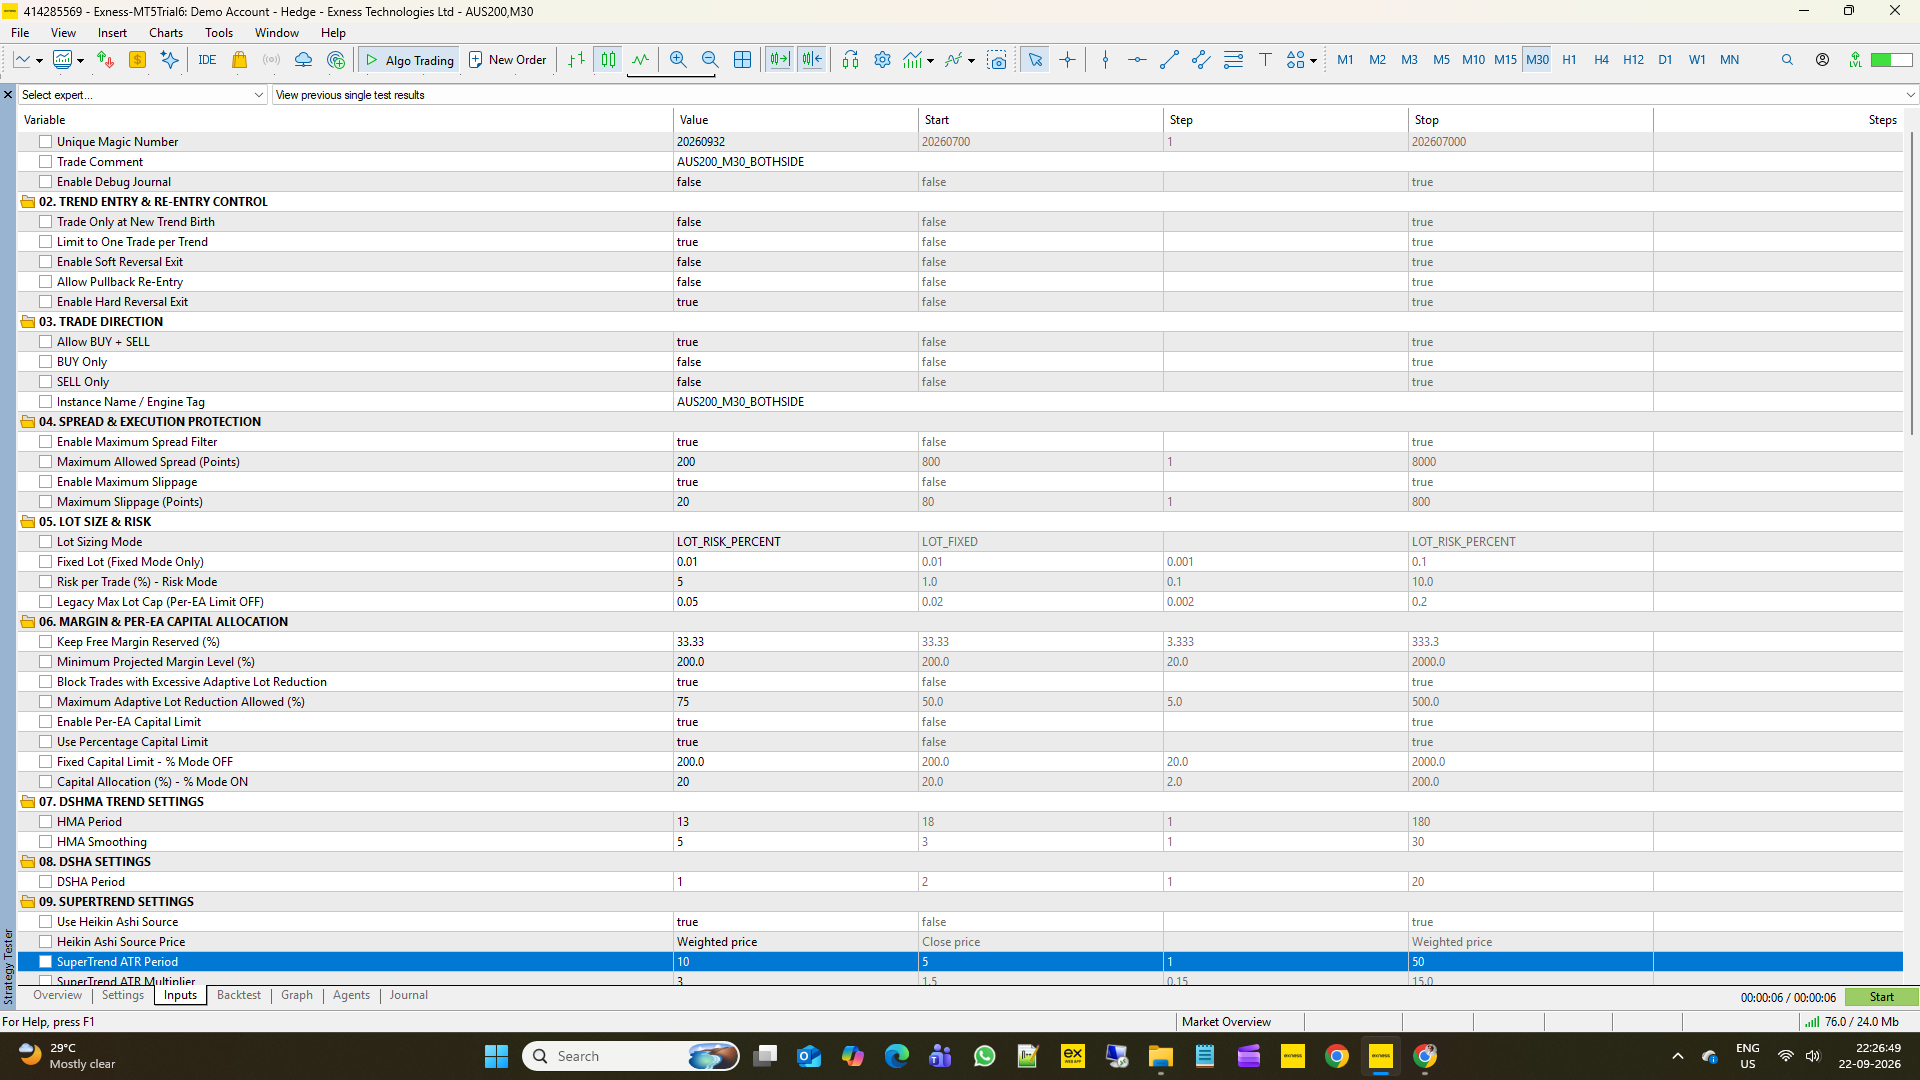
- Inputs 1 — trading direction, execution, risk, margin controls and Per-EA Capital Allocation.
- Inputs 2 — SuperTrend, trend filters, Hard Reversal Exit, SL/TP and Partial Profit settings.
- Inputs 3 — Local Protection, Master Protection, session and weekend configuration.
- Journal — selected execution records and final balance confirmation of $1,326.45.
The Strategy Tester settings show the test was performed on AUS200, M30, 01–31 August 2026, with Every tick based on real ticks, $1,000 deposit, 1:100 leverage, 88 ms delay and optimization disabled.
13. Reproduce the Test
The historical test can be reproduced in MetaTrader 5 using the same:
- EA version
- Symbol
- Timeframe
- Test period
- Tester model
- Deposit
- Leverage
- Delay
- Trading direction
- Risk settings
- Margin controls
- Trend settings
- Hard Reversal Exit configuration
- Partial Profit settings
- Session configuration
shown in this report.
Free Default .SET files are available for supported configurations.
For the corresponding default .SET file or configuration assistance, interested users may contact MSX AI Trading through MQL5 Private Chat.
14. 12-Symbol Strategy Tester Analysis Series
This AUS200 study is part of the:
MSX AI Multi Symbol Scalper — 12-Symbol Strategy Tester Analysis Series | Study, Compare & Evaluate
• BTCUSD • XAUUSD • USDJPY • USTEC • US500 • US30 • XAGUSD • ETHUSD • JP225 • USOIL • EURUSD • AUS200
The series examines individual symbols separately so that readers can study their historical Strategy Tester behaviour, configurations and statistics before evaluating how the EA may be configured for a broader multi-symbol portfolio deployment.
The AUS200 report also adds a different asset category to the series, demonstrating the flexible nature of the MSX AI Multi Symbol Scalper architecture across supported market segments.
15. Historical Study Disclosure
This report contains historical MetaTrader 5 Strategy Tester results only.
It is not a live trading record, investment performance statement, guarantee, forecast or promise of future results.
Actual live trading can differ because of:
- broker conditions
- spreads
- execution
- slippage
- liquidity
- symbol specifications
- margin requirements
- market conditions
- account conditions
- trading-session availability
- other execution and environmental factors.
The reported AUS200 result should therefore be evaluated as an individual historical test, not as a guaranteed portfolio outcome.
The 96% History Quality shown in the tester is a characteristic of this particular historical test and should not be interpreted as a guarantee of future data quality or live execution.
16. At a Glance
AUS200 M30 | August 2026
- Initial Deposit: $1,000
- Final Balance: $1,326.45
- Net Profit: $326.45
- Profit Factor: 5.02
- Total Trades: 19
- Profit Trades: 84.21%
- Balance Drawdown Max: 3.52%
- Equity Drawdown Max: 6.59%
- History Quality: 96%
- Modeling: Every tick based on real ticks
- Risk per Trade: 5%
- Per-EA Capital Allocation: 20%
- Partial Close: Enabled
- Hard Reversal Exit: Enabled
- Free Margin Reserved: 33.33%
- Minimum Projected Margin Level: 200%
- Maximum Adaptive Lot Reduction: 75%
MSX AI Multi Symbol Scalper v2.10
MetaTrader 5 Multi-Symbol, Multi-Timeframe & Flexible Portfolio Trading Expert Advisor
Historical Strategy Tester Study
AUS200 | M30 | August 2026
#AUS200
#AUS200Trading
#Australia200
#ASX200Trading
#IndexCFD
#AustralianIndex
#MT5IndexTrading
#IndexStrategyTester
#CFDBacktesting
#AUS200Analysis