What Profit Factor Can—and Cannot—Tell Us: Notes on Evaluating EA Backtests

When reviewing MetaTrader 5 Strategy Tester reports, Profit Factor and Net Profit are often the first metrics we look at.
A report showing a Profit Factor of 2.50 alongside a smooth upward equity curve creates an encouraging first impression. In quantitative evaluation, Profit Factor represents a straightforward ratio: total gross profits divided by total gross losses across a historical dataset.
While Profit Factor is a helpful summary statistic, it does not show how returns were distributed across time, how long account equity remained in drawdown, or how sensitive the logic might be to execution friction.
In my own testing, I find it useful to look at a few additional metrics alongside Profit Factor to gain broader context from Strategy Tester reports.
1. Recovery Factor (Net Profit / Maximum Drawdown)
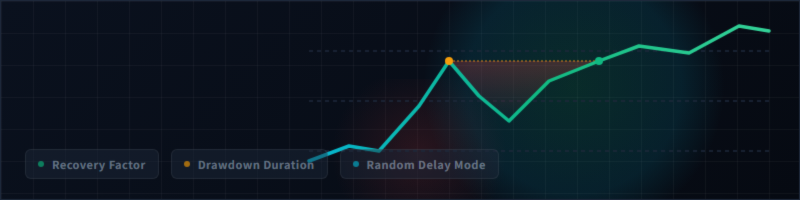
While Profit Factor measures the ratio of gross returns, Recovery Factor compares the net profit generated by a strategy with its maximum drawdown.
For example, a strategy might achieve a Profit Factor of 2.10 while experiencing a 35% drawdown along the way. If a test shows $7,000 in net profit alongside a maximum drawdown of $3,500, the resulting Recovery Factor is 2.00. This is one way I evaluate net return relative to historical peak drawdown risk. When calculating this independently, it is helpful to specify whether the drawdown measure refers to balance or equity.
2. Maximum Drawdown Duration (Underwater Period)
In addition to the magnitude of maximum drawdown ($ or %), drawdown duration—the time elapsed before equity returns to a new historical high—provides useful context for trade management and operational planning.
Maximum Drawdown Duration can be measured from an equity-curve time series as the longest interval from an equity peak until recovery to that level. If balance data are used instead, the resulting metric is best identified as balance drawdown duration rather than equity drawdown duration.
Different traders and strategies have different tolerances for underwater periods. Comparing drawdown duration across test runs helps evaluate whether a strategy's stagnation phases fit your operational expectations.
3. Expected Payoff vs Transaction Costs
Expected Payoff is a Strategy Tester statistic representing the average expected result per trade operation. To evaluate real-world feasibility under live conditions, it is worth comparing Expected Payoff against estimated transaction costs (spread, commission, and slippage).
One practical approach is to convert spread, commission, and expected slippage into monetary cost using the symbol's actual tick size and tick value, and then compare that cost directly with Expected Payoff.
If Expected Payoff is only slightly larger than estimated transaction costs, execution friction may consume a significant portion of the strategy's edge. Strategies with Expected Payoffs substantially larger than estimated costs tend to provide a larger cost buffer under the tested assumptions.
4. Trade Sample Size & Distribution
Statistical evaluation also benefits from examining sample size and trade distribution. A five-year historical test containing only 40 trades provides a relatively small sample, and the result may be heavily influenced by a limited number of market regimes.
A larger sample provides more observations, though sample size alone does not guarantee robustness. Serial dependence, regime concentration, and parameter sensitivity are additional factors worth considering.
5. Execution Latency Sensitivity
A baseline test can be run in MetaTrader 5's No Delay mode, where trade requests are processed under ideal execution conditions.
MetaTrader 5's built-in Random Delay mode introduces simulated execution delay to trade requests. In my workflow, I treat Random Delay as a sensitivity stress test to delayed trade requests rather than a direct model of VPS ping or broker latency. Comparing a No Delay test with a Random Delay test helps highlight whether a strategy relies on immediate fills or maintains structural stability when execution is delayed.
Observations for Strategy Evaluation
When reviewing an Expert Advisor report in MetaTrader 5, these are five metrics I find helpful to examine together:
- Review Recovery Factor alongside Profit Factor.
- Measure Maximum Drawdown Duration from equity curve history.
- Compare Expected Payoff against transaction costs using actual tick size and tick value.
- Consider sample size while keeping regime concentration and serial dependence in mind.
- Observe execution sensitivity using MetaTrader 5's Random Delay mode.
Different strategies may require different interpretations, and the goal here is not to define a universal rule, but to share context from our testing workflow.




![[iVISTscalp5]: EURUSD. Forecast First. Market Reaction Afterwards//October 12-16, 2026](https://c.mql5.com/6/1038/splash-preview-777972.png "[iVISTscalp5]: EURUSD. Forecast First. Market Reaction Afterwards//October 12-16, 2026")