
Exit on the second counter-candle against a trailing stop: 66,511 trades, one answer

The idea is old and plausible. A trailing stop reacts to price, not to structure, and routinely hands back part of the gain. A structural exit should do better: flatten the position as soon as the second consecutive counter-candle on M5 shows the trade is invalidated. Anyone tracing this on a chart finds days where the rule exits exactly at the high. I had a manual month review that graded the rule day by day and came out positive. Then I ran it over eleven years. This is the short version.
| Question | Does closing a trade on the second counter-candle on M5 beat a trailing stop? |
| Data | 66,511 trades from six breakout setups on DAX, FTSE, Dow and Nasdaq, January 2015 to June 2026, identical paths for every exit. |
| Answer | No. Minus 0.072 R per trade against the trailing stop, t = minus 15.8, in every market and every setup. |
Six exits on the same 66,511 trades
Four indices (DAX, FTSE, Dow, Nasdaq), six breakout setups, January 2015 to June 2026, paths in 5-minute buckets from entry. Every variant sees exactly the same trades and the same paths; only the exit differs. MECH1/2/3 exit at the close of the first, second or third consecutive counter-candle with a fixed stop at −1 R. TRAIL is a trailing stop (break-even at +0.5 R, trail 1.0 R, step 0.5). HOLD stays in until session end. Costs charged at entry, standard errors clustered by day.
| Exit variant | avg R | t | Win rate | Share ≥ 3 R | Mean loser |
|---|---|---|---|---|---|
| MECH1 (1st counter-candle) | −0.007 | −1.5 | 37% | 1.77% | −0.543 |
| MECH2 (2nd counter-candle) | +0.010 | +1.6 | 37% | 3.35% | −0.689 |
| MECH3 (3rd counter-candle) | +0.025 | +3.0 | 34% | 5.12% | −0.798 |
| TRAIL 0.5 / 1.0 / 0.5 | +0.082 | +16.4 | 37% | 1.61% | −0.996 |
| HOLD to session end | +0.053 | +3.4 | 22% | 10.20% | −0.985 |
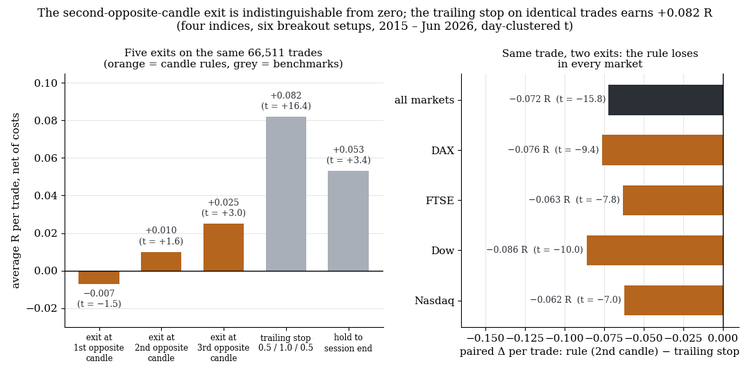
Five exits on the same 66,511 trades.
The mechanical exit is indistinguishable from zero. The trailing stop on the same trades is clearly positive. Two details deserve a second look. The win rate of MECH2 and TRAIL is identical, so the rule does not win more often, it wins less. And the ordering MECH1 < MECH2 < MECH3 < HOLD is monotone: the longer you tolerate counter-candles, the better it gets, and even stubbornly holding to the close beats all three candle rules.
The paired comparison
The honest test is not two means but the per-trade difference: the same trade, closed once with MECH2 and once with TRAIL.
| Segment | MECH2 minus TRAIL per trade | t |
|---|---|---|
| All markets | −0.072 R | −15.8 |
| DAX | −0.076 | −9.4 |
| FTSE | −0.063 | −7.8 |
| Dow | −0.086 | −10.0 |
| Nasdaq | −0.062 | −7.0 |
Across the six setups the difference ranges from −0.026 R (t = −2.1) to −0.264 R (t = −25.0). Out of sample from 2022 onward, MECH2 is ahead of the trailing stop in none of the six setups.
Why a rule that catches the tail better still loses
The surprising part: the mechanical exit really is better at the right edge. MECH2 delivers twice as many trades above 3 R as the trailing stop (3.35% against 1.61%) and cuts losers at −0.69 R on average instead of −1.0 R. What is missing is the middle of the distribution. The trailing stop locks in break-even at +0.5 R and banks gains in steps from +1 R onward. The counter-candle rule throws out a winner that has not yet reached the first trail step as soon as two red five-minute candles appear, near zero or slightly negative. Two counter-candles on M5 are evidently more often noise than a structural break within a trend.
The month that seemed to confirm the rule
The trigger for this study was a review of August 2026, 668 trades on 19 days. Through the engine: MECH2 −0.152 R (5 green days, 14 red), TRAIL −0.069 R (10 green, 9 red), paired difference −0.082 R at t = −2.8, the same order of magnitude as eleven years of history. Only Nasdaq was positive under MECH2, +4.8 R, and that rested on one day: on 13 August a single fade trade ran to +8.0 R with the counter-candle rule and +3.1 R with the trailing stop. Without that day the Nasdaq month stands at −5.9 R under MECH2 and +2.5 R under TRAIL. The manual review had the month resting on exactly this day. That is the recency error in its purest form, and it is dangerous because the chart confirms it.
What it means for your EA
If your EA exits on counter-candles, compare it against a trailing stop on the same trades, trade by trade, before you trust it. A rule that looks right on the chart of a good day can lose steadily on the middle of the distribution, the trades that were about to become small winners.
Limits
Four indices, six breakout setups, costs charged at entry. A hybrid (trailing up to +1 R, counter-candles after that) and counter-candles on M15 were not tested. The August review is one month.
Full study (all tables, the method, every limit and the PDF): Exit on the second counter-candle: does a mechanical exit beat the trailing stop?
More research notes: my blog · Tools for prop firm accounts: all my products
Historical statistics are no guarantee of future market behaviour. This is not investment advice.