Fibonacci extensions reach 1.618 less often than a random walk: 26,795 double bottoms

Fibonacci extensions are among the most used tools in chart analysis, and the claim behind them is a forecast: after a structure such as a double bottom, price has an elevated tendency to reach certain multiples of the first leg, and the zone from 1.618 to 2.0 is where moves end. Such claims almost always appear without a benchmark. "Price reached 1.618 in two thirds of cases" sounds like a statement about Fibonacci. It is, at first, only a statement about distances. So I put the rule against the only fair comparison: a driftless random walk with the same distances. Short version below.
| Question | Do Fibonacci extensions reach 1.618 more often than chance after a double bottom? |
| Data | 26,795 mechanically defined double bottoms and tops on DAX, FTSE, NQ and Dow, 2015 to 2026, horizon 24 hours. |
| Answer | Less often: 67% against 71% for a random walk with the same distances, t = minus 13.5. The 0.5 pullback entry is a fair coin. |
The construction
A double bottom is defined mechanically on M5 candles built from M1 data: two swing lows at a similar level (tolerance 25% of the leg), an intermediate high between them, separation 3 to 60 candles, leg at least three times the median candle range. The leg runs from the low (0) to the intermediate high (1.0). Activation is the first M5 close above the intermediate high. Double tops are mirrored. DAX, FTSE, NQ and Dow, 2015 to 2026, 26,795 activated sequences, horizon 24 hours.
The benchmark: a driftless random walk starting between a stop and a target reaches the target first with probability p = d(stop) / (d(stop) + d(target)), computed for every sequence from its actual geometry and averaged. Only a hit rate above this p would be a Fibonacci effect.
Test A: the magnet is weaker than chance
| Market | Sequences | 1.618 before low break | Random walk | t |
|---|---|---|---|---|
| DAX | 6,824 | 67% | 71% | −6.3 |
| FTSE | 6,878 | 66% | 70% | −6.5 |
| NQ | 6,391 | 67% | 71% | −7.5 |
| Dow | 6,702 | 67% | 71% | −6.7 |
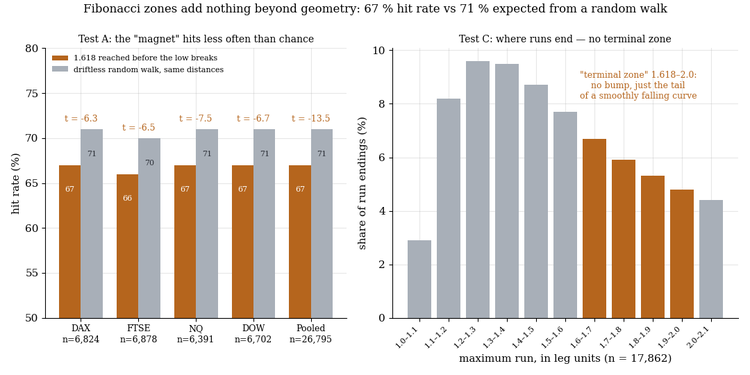
| Pooled | 26,795 | 67% | 71% | −13.5 |
The magnet hits less often than chance.
The Fibonacci hit rate is four percentage points lower than the random-walk expectation on each of the four markets. The 67% is almost entirely geometry: after activation price is already above the intermediate high, the low is far away, the 1.618 mark comparatively close. A magnet that hits less often than chance at equal distance is not one.
Test B: the 0.5 pullback is a fair coin
The classic entry: wait for the retrace to half the leg, stop below the low, target 1.618, net of spread and slippage. 13,635 entries. Win rate 35.5%, random-walk expectation 34.8%, difference at t = +1.8, below the significance threshold. After costs +0.020 R per trade remains, negative on the FTSE. The bracket has a reward-to-risk of about 2.2 to 1; with a win rate matching chance, its expectancy is zero by construction. That is the result one expects from a setup with no information content.
Test C: no terminal zone
If 1.618 to 2.0 is where moves run out, the density of run endings should show a hump there. Across 17,862 sequences the distribution peaks at 1.2 to 1.3 leg units and then declines monotonically: 6.7% per band at 1.6 to 1.7, 5.9%, 5.3%, 4.8% at 1.9 to 2.0, 4.4% beyond. The zone is a section of a smoothly falling curve that says long runs are rarer than short ones. That holds for any price series, including a random one.
What it means for your EA
In all three tests the zones deliver nothing the distance geometry does not already dictate. This is not a statement that Fibonacci traders cannot be profitable. It is a statement about where their edge does not come from. Anyone making money with these zones is making it with something else, context, timing, risk management, and the zones are a coordinate system, not a forecast. The methodological point matters more than the pattern: a hit rate without a benchmark is not information. 67% sounds like a finding until one knows that pure geometry predicts 71%.
Limits
One mechanical double-bottom definition, only 1.618 and 2.0 as targets and 0.5 as entry, a random walk without drift or volatility structure, and no out-of-sample split (there was no parameter search, the definition was fixed before the test).
Full study (all tables, the method, every limit and the PDF): Fibonacci zones as a forecast: do they beat a random walk?
More research notes: my blog · Tools for prop firm accounts: all my products
Historical statistics are no guarantee of future market behaviour. This is not investment advice.