
When a backtest is testing the database
This article uses Apple’s 2020 four-for-one split as a concrete example, explains the mechanism inside NorthSlope, compares results from several MT5 environments and proposes a reproducible validation workflow. It is a study of data integrity, not a claim that a corrected backtest guarantees future profitability.
What a stock split actually changes
Suppose one share trades at $500 immediately before a 4:1 split. After the split, the investor owns four shares at approximately $125 each:
| State | Shares | Price per share | Position value |
|---|---|---|---|
| Before the split | 1 | $500 | $500 |
| After a 4:1 split | 4 | $125 | $500 |
Ignoring ordinary market movement, the economic value is unchanged. The quotation scale and share count have changed.
For a continuous research series, a common backward-adjustment divides all pre-split OHLC prices by the split factor. Pre-split volume is normally multiplied by the factor when share volume is part of the dataset. With a 4:1 split:
Adjusted pre-split price = Original pre-split price / 4
Adjusted pre-split volume = Original pre-split volume × 4
If a database leaves the earlier price near $500 but starts the next session near $125, a naïve return calculation produces approximately:
125 / 500 - 1 = -75%
That is not a 75% economic loss. It is a change of units. Nevertheless, an indicator that receives only OHLC bars cannot distinguish it from a genuine collapse.
Apple announced that shareholders of record would receive three additional shares for each share held and that trading would begin on a split-adjusted basis on **31 August 2020**. Apple’s investor FAQ also records the event as a 4:1 split. These dates are valuable checkpoints when auditing AAPL history (Apple Newsroom, Apple Investor Relations)

Figure 2. One higher-priced share becomes four lower-priced shares; the split alone does not create a gain or a loss.
How MT5 receives and replays stock history
An EA normally consumes the bars supplied for the broker’s symbol. In NorthSlope, `CopyRates()` loads `MqlRates` data for the configured symbol and timeframe. The structure contains time, open, high, low, close, spread and volume fields. MetaQuotes documents `CopyRates()` as the function that obtains the available history for a symbol and period, while the Strategy Tester loads the required symbol history from the terminal and creates the test sequence from those data (CopyRates reference, Strategy Tester reference)
This has an important practical consequence: MT5 cannot repair a corporate action that is already represented inconsistently in the broker’s history. The tester can model ticks with great precision and still replay the wrong economic series. “Every tick based on real ticks” improves intrabar fidelity; it does not, by itself, prove that corporate actions were normalized correctly.
Different brokers may therefore produce different stock backtests even when:
- the EA source and inputs are identical;
- the symbol refers to the same company;
- the timeframe and nominal date range match;
- the starting balance is the same.
Possible differences include adjusted versus unadjusted OHLC history, missing bars, quote-session boundaries, spreads, tick availability, contract size, minimum volume, volume step and margin rules. MT5 exposes many of these instrument settings through symbol properties, including tick size, tick value, contract size and volume limits (MQL5 symbol properties)
The symbol name alone is therefore not enough. AAPL, AAPL.US, #AAPL or another alias may represent instruments with different historical and trading specifications.
How one artificial bar propagates through NorthSlope
NorthSlope calculates true range from the current high/low and the previous close:
double true_range=MathMax(rates[i].high-rates[i].low,
MathMax(MathAbs(rates[i].high-previous_close),
MathAbs(rates[i].low-previous_close)));
If previous_close is on the pre-split scale and the new bar is on the post-split scale, both gap terms become enormous. That value enters the Wilder-style ATR calculation and then the Supertrend bands. A single discontinuity can remain influential for multiple bars because ATR is smoothed rather than reset immediately.
NorthSlope then proposes the buy stop from the closed bar and ATR:
closed_bar.close - StopATRMultiple * signal_atr
With the default StopATRMultiple=2.0, an inflated ATR creates an abnormally wide stop. The EA does not guess volume from points alone; it asks MT5 to estimate the one-lot loss between entry and stop, then scales volume to the selected risk percentage:
OrderCalcProfit(ORDER_TYPE_BUY,_Symbol,1.0,entry,stop,one_lot_profit);
double risk_cash = capital * RiskPercent / 100.0;
double raw_volume = MathMin(risk_cash / MathAbs(one_lot_profit), MaxVolume);
This is generally a robust approach because OrderCalcProfit() returns the estimated result in account currency and incorporates the symbol’s calculation environment (MQL5 OrderCalcProfit). But the calculation can only be as meaningful as the prices and symbol specifications supplied to it.
The complete propagation path is:
- inconsistent split bar;
- artificial true-range and ATR spike;
- displaced Supertrend line or direction change;
- abnormal entry, exit or stop distance;
- altered one-lot loss and rounded broker volume;
- changed trade result and account equity;
- changed risk budget for later trades.
This is why removing one visually obvious loss from a report is not a sufficient correction. The signal state and all path-dependent calculations should be rebuilt from a coherent series.
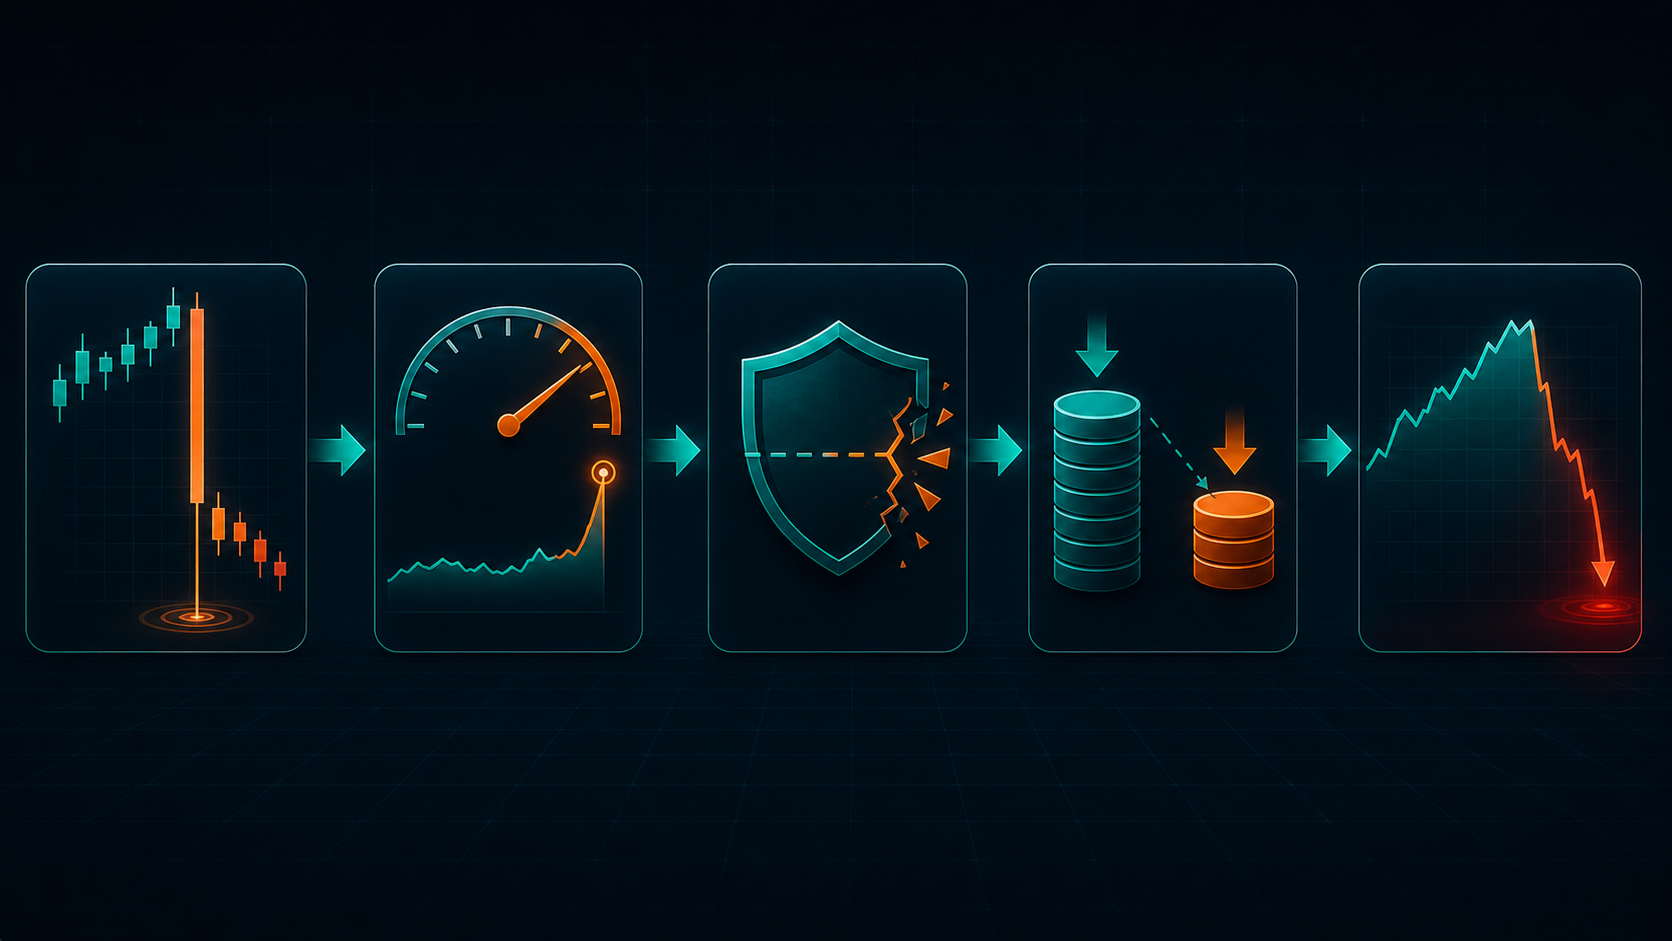
Figure 3. An unadjusted split can travel through volatility, protection, sizing and finally the reported equity curve.
Want to explore the EA behind this case study?** NorthSlope combines long-only H1 Supertrend-slope signals with ATR-based protection and risk-based position sizing.
The AAPL 4:1 case: what to inspect around 31 August 2020
For the Apple event, I inspect a window around the last session before and the first session after split-adjusted trading began. The first check is not the EA report, it is the raw H1 and daily OHLC sequence.
Red flags include:
- a price ratio close to 4:1 or 1:4 between adjacent sessions;
- pre-split bars near the old scale and post-split bars near the new scale;
- a single extreme true-range observation without corresponding economic news;
- an ATR spike that begins exactly at the corporate-action boundary;
- a stop, entry or exit at a price that belongs to the other scale;
- different brokers showing the discontinuity on different timestamps or not showing it at all.
A useful diagnostic ratio is:
R = Previous close / Current open
For a forward split, `R` may be close to an integer such as 2, 3, 4 or 5. This is only an anomaly detector, not proof. Genuine gaps, bad ticks, symbol changes and other corporate actions can produce unusual ratios. The suspected date should be checked against an authoritative corporate-action record.
The most revealing experiment is an A/B test:
- run the untouched broker history;
- run a coherently adjusted copy with the same EA, inputs and test settings;
- compare the first different signal, not only the final balance;
- inspect ATR, Supertrend, entry price, stop price and volume at that point;
- continue comparing subsequent trades to identify path dependence.
If the first divergence appears at the split boundary, and the corrected series agrees with independent sources, the evidence points to data representation rather than a failure of the trading rule.
Comparing NorthSlope Backtests Across Brokers
For the environments where I recorded both the originally reported and normalized simulations, the change was material:
| Environment | Reported net profit | Corrected net profit | Reported PF | Corrected PF |
|---|---|---|---|---|
| BlackBull Markets | $8,689.40 | $21,197.11 | 1.25 | 1.93 |
| FTMO | $5,675.03 | $20,653.18 | 1.13 | 1.73 |
| IC Markets | $13,095.60 | $27,747.16 | 1.35 | 2.19 |
The important conclusion is not that normalization always improves a strategy. A valid correction can improve or worsen a result. The conclusion is that a corporate-action mismatch can materially change the result, so the unverified report should not be used to judge the EA.
The additional Darwinex and Fusion Markets runs provide independent historical paths. Their results also differ in trade count and performance, which is expected when broker history and instrument specifications differ. Cross-broker agreement should be evaluated at the level of dates, signals and price continuity—not only by asking whether every final balance is identical.

Figure 4. BlackBull Markets: the panel records the reported versus corrected difference and the normalized AAPL 4:1 anomaly treatment.
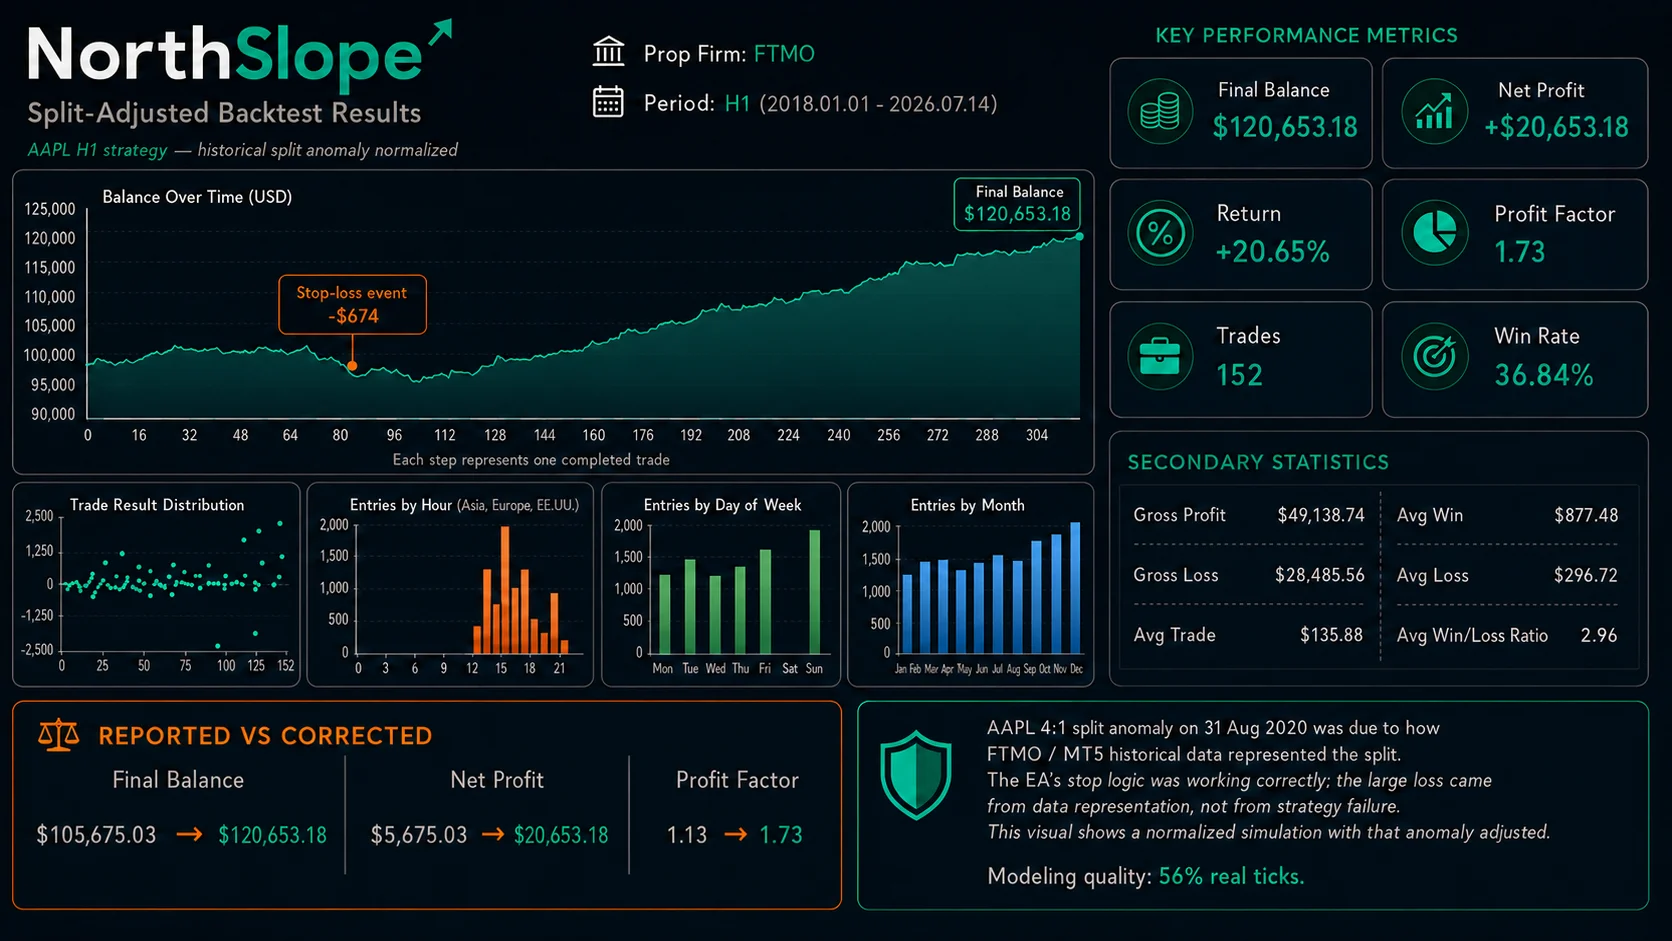
Figure 5. FTMO: the same split boundary materially affected the reported and normalized statistics.

Figure 6. IC Markets: another example of the reported-versus-corrected gap.

Figure 7. Darwinex: an independent live-broker historical test used for comparison.

Figure 8. Fusion Markets: a separate historical path with a different trade count and performance profile.
Two cautions are essential. First, the modeling-quality percentages shown on some panels limit how strongly those particular runs should be interpreted. Second, backtests are simulations; spreads, execution, financing, data quality and future market behavior can differ from the test.
Correcting the data without fooling the tester
A defensible correction should satisfy four principles.
Use one consistent scale
Choose a coherent methodology for the complete affected history. For a backward-adjusted 4:1 series, divide every pre-split open, high, low and close by four. Do not adjust only the final pre-split bar or only the close.
If volume matters to the strategy, transform it consistently with the source methodology. Also verify that the corrected OHLC values still obey:
Low ≤ Open and Close ≤ High
Prices should be aligned to the symbol’s tick size, and duplicate or missing timestamps should be checked.
Preserve the instrument’s economics
Price adjustment is only one layer. The researcher must understand what one lot represents, which contract size is active, how profit is calculated, what minimum volume and volume step apply, and whether the broker changed those properties historically.
For NorthSlope this matters directly because the stop-to-entry loss for one lot controls volume. A corrected price series combined with an incoherent contract specification can still create false risk.
Recalculate from the beginning of the indicator warm-up
ATR and Supertrend are stateful. Start the corrected test far enough before the event to rebuild the indicator normally. NorthSlope requests at least 350 calculation bars by default, so the dataset must provide enough pre-event history for stable initialization.
Do not splice corrected indicator values into an already-running report. Re-run the whole test so signal generation, sizing and compounding all follow the corrected path.
Keep both versions and document the transformation
A reproducible study retains:
- the original broker export;
- the corrected dataset as a separate symbol or file;
- the split factor and effective date;
- the source used to verify the corporate action;
- a transformation log or script hash;
- the MT5 build, EA version, inputs, test mode and symbol properties;
- both untouched and corrected reports.
That audit trail turns “I removed a bad trade” into a testable data-quality claim.

Figure 9. Compare independent histories, isolate the corporate-action boundary, correct the dataset coherently and rerun the complete strategy.
Validation checklist and conclusion
Before accepting any MT5 backtest on individual stocks, I now use the following checklist:
- Identify every split, reverse split, symbol migration and major corporate action inside the test period.
- Compare raw OHLC bars around each effective date with an authoritative event record.
- Check whether all pre-event OHLC values use the same scale as the post-event history.
- Inspect volume continuity if volume enters the strategy.
- Record tick size, tick value, contract size, calculation mode and volume limits.
- Compare at least two independent data sources when possible.
- Plot true range and ATR to reveal corporate-action spikes.
- Run untouched and corrected A/B tests with identical EA settings.
- Compare the first divergent signal, stop and volume—not only final profit.
- Re-run from enough history to rebuild stateful indicators.
- Retain the original files and document every transformation.
- Treat low real-tick coverage and missing sessions as separate limitations.
The central lesson is simple: a realistic tick model cannot rescue an economically inconsistent price series. For stock EAs, data engineering is part of strategy validation.
In the NorthSlope case, Apple’s 2020 split could enter MT5 history as an artificial collapse, contaminate ATR and Supertrend, change stop distance and volume, and then alter the compounded equity path. The EA’s stop and risk logic may be executing exactly as programmed while the report still describes a market history that never existed in economic terms.
The correct response is not to ignore the losing observation, and it is not to celebrate the normalized result automatically. The correct response is to verify the corporate action, normalize the complete series coherently, preserve the instrument specifications, rerun the full strategy and disclose the methodology.
That process produces a backtest worth analyzing and, just as importantly, makes clear what the test still cannot prove.
Discover NorthSlope for MetaTrader 5. Review the EA's operating logic and product information before running your own tests.
Risk disclaimer: This article is for educational and software-testing purposes only. Historical and simulated results do not guarantee future performance. Trading stocks and CFDs involves risk, and broker execution, financing, corporate-action handling and symbol specifications may differ from a backtest.
EA used in the case study: NorthSlope v1.30, a configurable long-only H1 Supertrend-slope Expert Advisor with ATR-based stops and risk-based position sizing.