19 Consecutive Profitable Years, 12.7% Average Annual Return, ~5% Maximum Drawdown — BUSHIDO by the Numbers

Here are the results of the approximately 19-year backtest (2007–2026) of BUSHIDO, our USDJPY-only EA — numbers only.
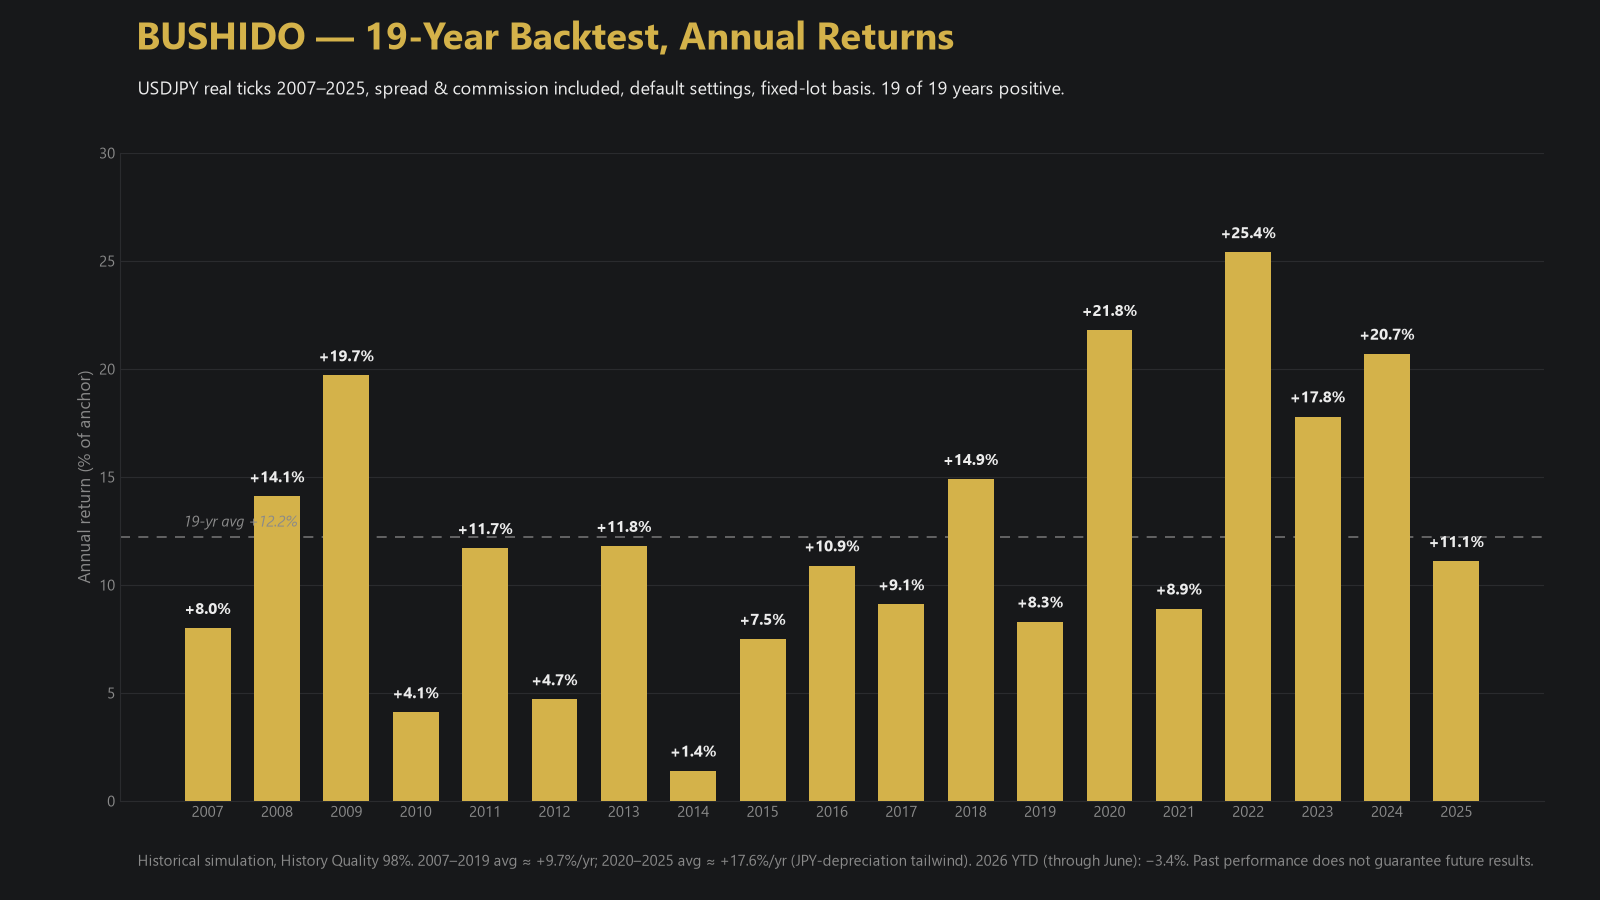
- 19 consecutive profitable years — no losing year in the entire test period
- Average annual return 12.7% (19-year CAGR, recommended setting)
- Maximum drawdown 5.2%
- Probability of reaching the 18% Permanent Stop: 1.35% (estimated from 20,000 Monte Carlo simulations with randomized trade sequences)
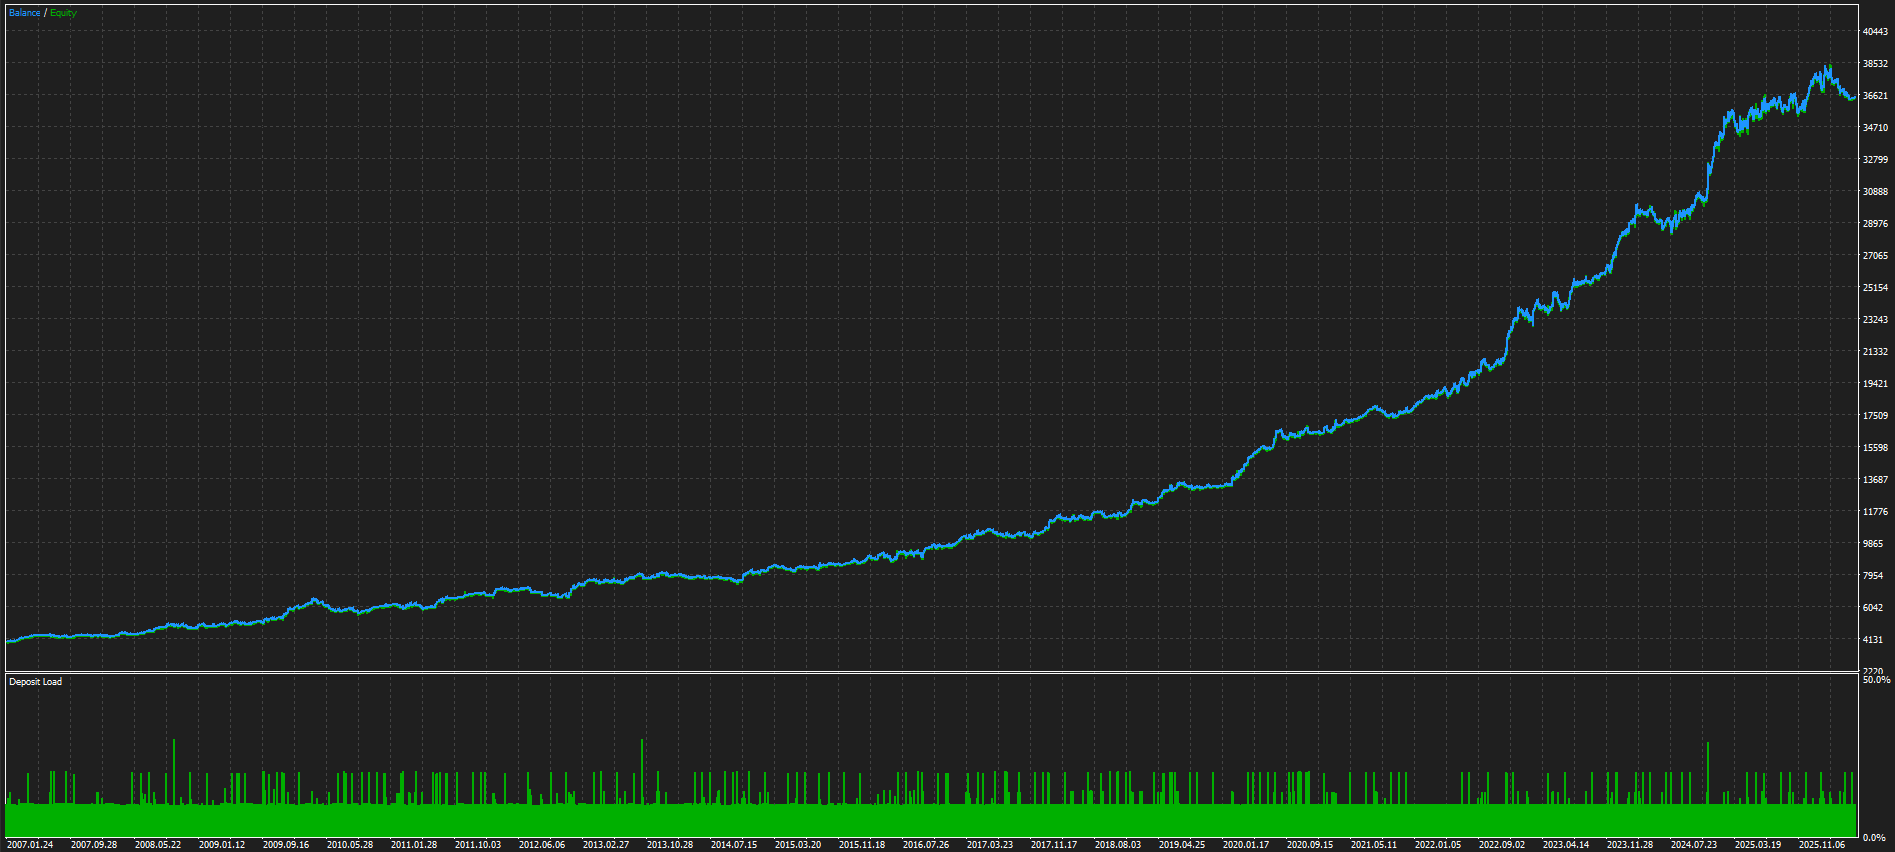
The backtest uses approximately 19 years of real tick data (real-tick modeling, history quality 98%, ~0.7 pips total trading cost included). The figures above are actual results of that test.
■ Behind these numbers
During development we ran more than 200,000 simulations and rejected about 95% of the ideas we tested. The portfolio built only from the surviving strategies is what produces both a high average annual return and a low maximum drawdown.
No spectacular short-term spikes — just finishing every one of the 19 years positive. That consistency is BUSHIDO's biggest selling point.
■ If you want higher returns
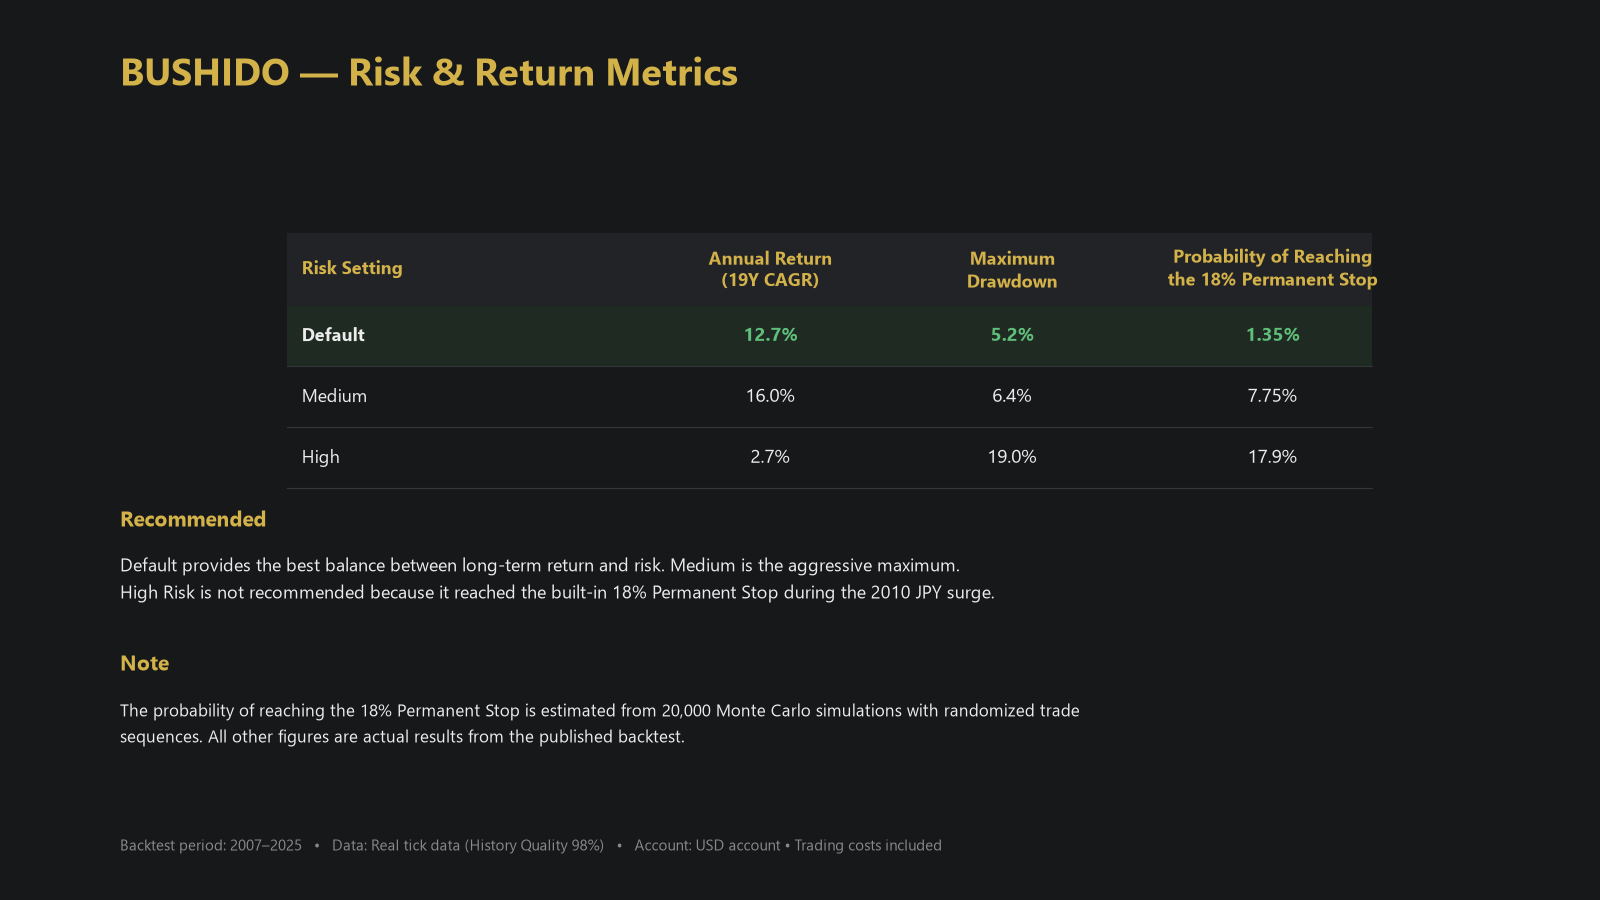
Risk and return can be adjusted with a single input parameter, "Risk level".
- Default (recommended): 12.7% average annual return, 5.2% maximum drawdown
- Medium Risk: 16.0% average annual return, 6.4% maximum drawdown
The full comparison table and test conditions are on the product page.
■ Links
Product page (all figures, comparison table, test conditions):
https://www.mql5.com/en/market/product/186851
User Guide & FAQ:
https://www.mql5.com/en/blogs/post/772982
* All figures in this article come from backtests and Monte Carlo simulations. Past performance does not guarantee future results.