
The Institutional Edge: How to Scalp MT5 with Volume Bubbles and Volume Profile?

Mastering the Market Footprint: Ultimate Guide to the Volume Bubble & Volume Profile MT5 Indicator
Indicator link: https://www.mql5.com/en/market/product/181661
If you are a scalper, you already know that trading without institutional volume data is like driving in the dark without headlights. Standard indicators lag, but volume never lies.
This system maps institutional intent directly onto your charts, giving you an immediate edge in fast-moving markets like XAUUSD.
Example scenario
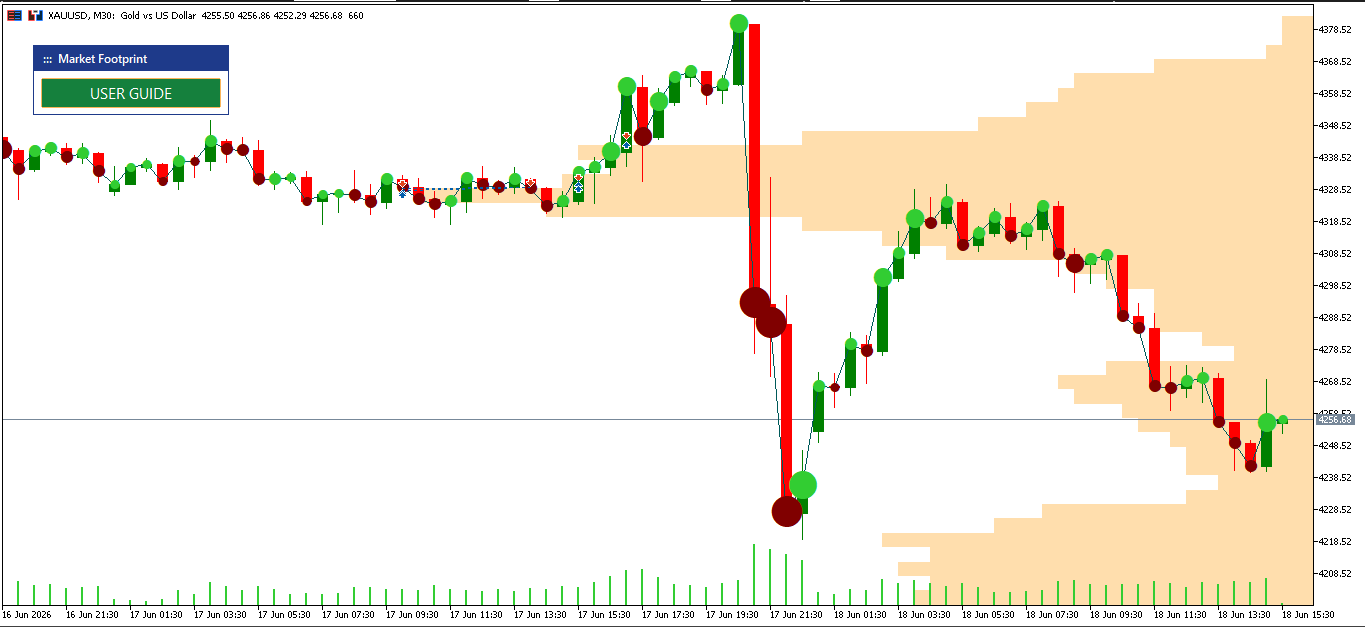
The Massive Maroon Bubble: At the absolute bottom of the plunge (near $4228), a massive maroon dot appears. This represents a massive spike in selling volume, caused by retail stop-losses cascadingly triggering alongside panic sellers capitulating.
The V-Reversal Absorption: Institutional buyers waited for this exact pool of massive sell liquidity. The moment those retail stops hit the market, major players stepped in and aggressively bought up the orders—instantly shifting control back to an enormous green bubble that stabilized the floor and launched the recovery.
How It Works: Decoding the Interface
This indicator breaks price action down into two primary dimensions: time-based volume exhaustion/aggression (the Bubbles) and price-based volume support/resistance (the Right-Side Profile).
Placement: One dot/bubble is plotted on every single candle bar, anchored exactly to that bar's closing price.
- GREEN Dot: The bar closed UP, proving that buyers held control of the close.
- MAROON Dot: The bar closed DOWN, proving that sellers dominated the close.
2. Why Bubble Size Matters
The indicator utilizes a 5-tier relative volume engine that compares the current bar's volume against the busiest recent bars:
- BIG Dot = Heavy Volume: This indicates strong institutional participation, real order flow momentum, and heavy conviction.
- TINY Dot = Thin Volume: This represents a weak, low-liquidity move. These moves lack backing and are easily faded or reversed.
3. Right-Side Volume (Profile)
While bubbles show when the volume came in, the horizontal histogram on the right show where it is concentrated:
- Horizontal Bars: Displays the cumulative total volume traded AT each specific price level.
- LONG Bar (High Volume Node): Represents a "Value Zone" or a price magnet where major business was transacted.
- SHORT Bar (Low Volume Node): Points to an institutional void where price skipped fast due to an absence of commercial interest.
How It Helps Scalpers
Scalping is all about capitalizing on rapid, highly reliable micro-movements. This setup acts as a high-precision filter for your entries and exits:
- Eliminates Fakeouts: If price attempts to break a key level but prints a tiny dot, you immediately know the breakout lacks institutional backing and can safely look for a reversal.
- Pins Perfect Targets: The long horizontal bars on the Volume Profile act like high-gravity magnets. When scalping a breakout, you know exactly where price is heading next to place your Take Profit.
- Instant Risk Definition: It helps you spot institutional walls instantly, allowing you to hide your Stop Loss tightly behind heavy volume nodes.
High-Accuracy Setups for Maximum Precision
To get the highest win-rate from this indicator, look for the convergence of both components. Based on image_e2345f.png, these are the two highest-probability setups you should look for:
Setup 1: The High-Volume Reversal (Fading Resistance/Support)
The Long-Bar Wall: Look at the Right-Side Volume Profile to identify the longest horizontal bars (major institutional resistance or support).
The Footprint Confirmation:
- When price hits a LONG profile bar from below and prints a Big MAROON dot, it confirms sellers are actively capping resistance.
- When price tests a LONG profile bar from above and prints a Big GREEN dot, it confirms buyers are aggressively defending support.
Setup 2: The Vacuum Breakout (Trading the Voids)
- The Thin Zone: Locate a sharp drop-off in the horizontal volume profile—a region of SHORT bars.
- The Footprint Confirmation: When price penetrates this zone accompanied by growing bubble sizes, expect explosive momentum. Price travels incredibly fast through short-bar zones because there are no historical orders to slow it down.
- The Execution: Enter a rapid momentum scalp as soon as price enters the thin volume void, riding it straight to the next major high-volume block.


