
Trend Reversal Marker: Multi-MA Ribbon Indicator with ROC-Based Reversal Detection for MT4 and MT5

Introduction
Most retail traders enter trends too late and exit too early. By the time the obvious candlestick patterns and indicator signals confirm a new direction, the move is already half over. The opposite mistake is just as common -- getting shaken out of a healthy trend during a normal pullback because a single moving average rolled over for one or two bars.
Trend Reversal Marker takes a structural approach to this problem. Instead of relying on a single moving average, it computes eleven Simple Moving Averages spanning short-, medium-, and long-term lookbacks (10, 20, 30, 40, 50, 60, 70, 80, 90, 100, and 200 bars) and analyzes the slope of each one. The slope is measured with the Rate of Change (ROC) function. When most of the short-term averages start sloping in the opposite direction of the long-term average, the indicator counts how many have flipped and converts that count into a "reversal probability" reading from 0% to 90%.
The indicator is available for both MetaTrader 4 and MetaTrader 5.
Download the indicator:
- MetaTrader 5: Trend Reversal Marker MT5
- MetaTrader 4: Trend Reversal Marker MT4
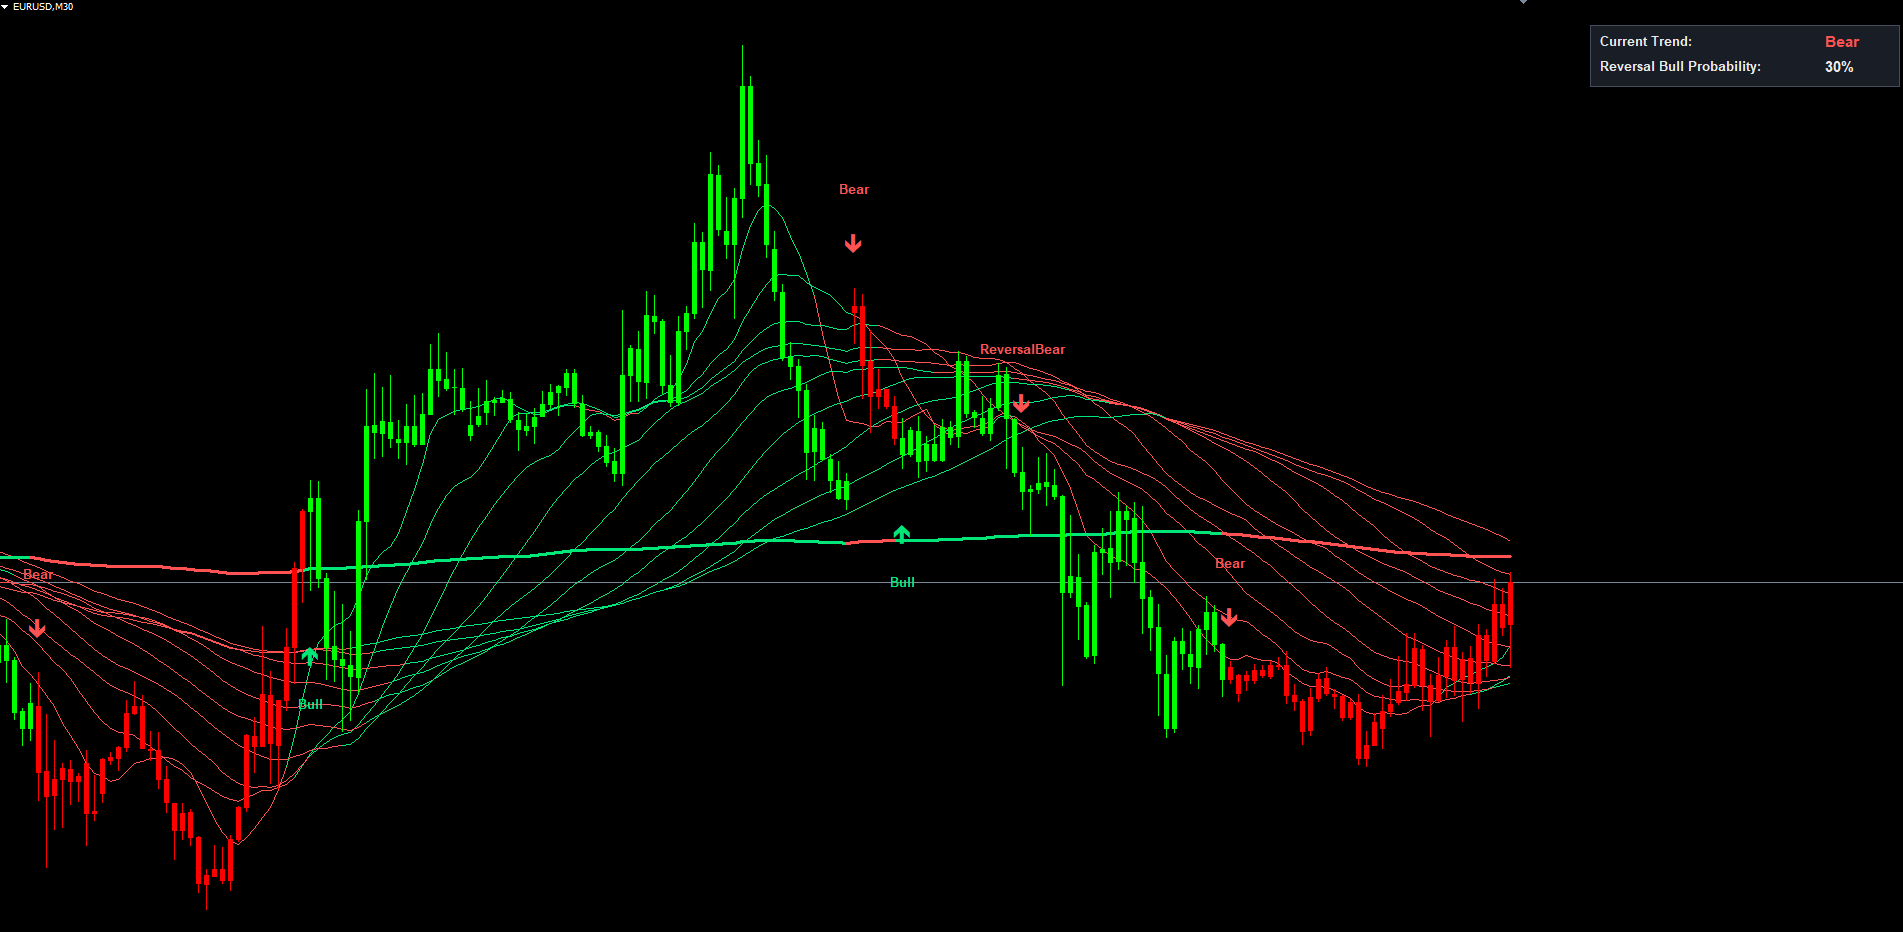
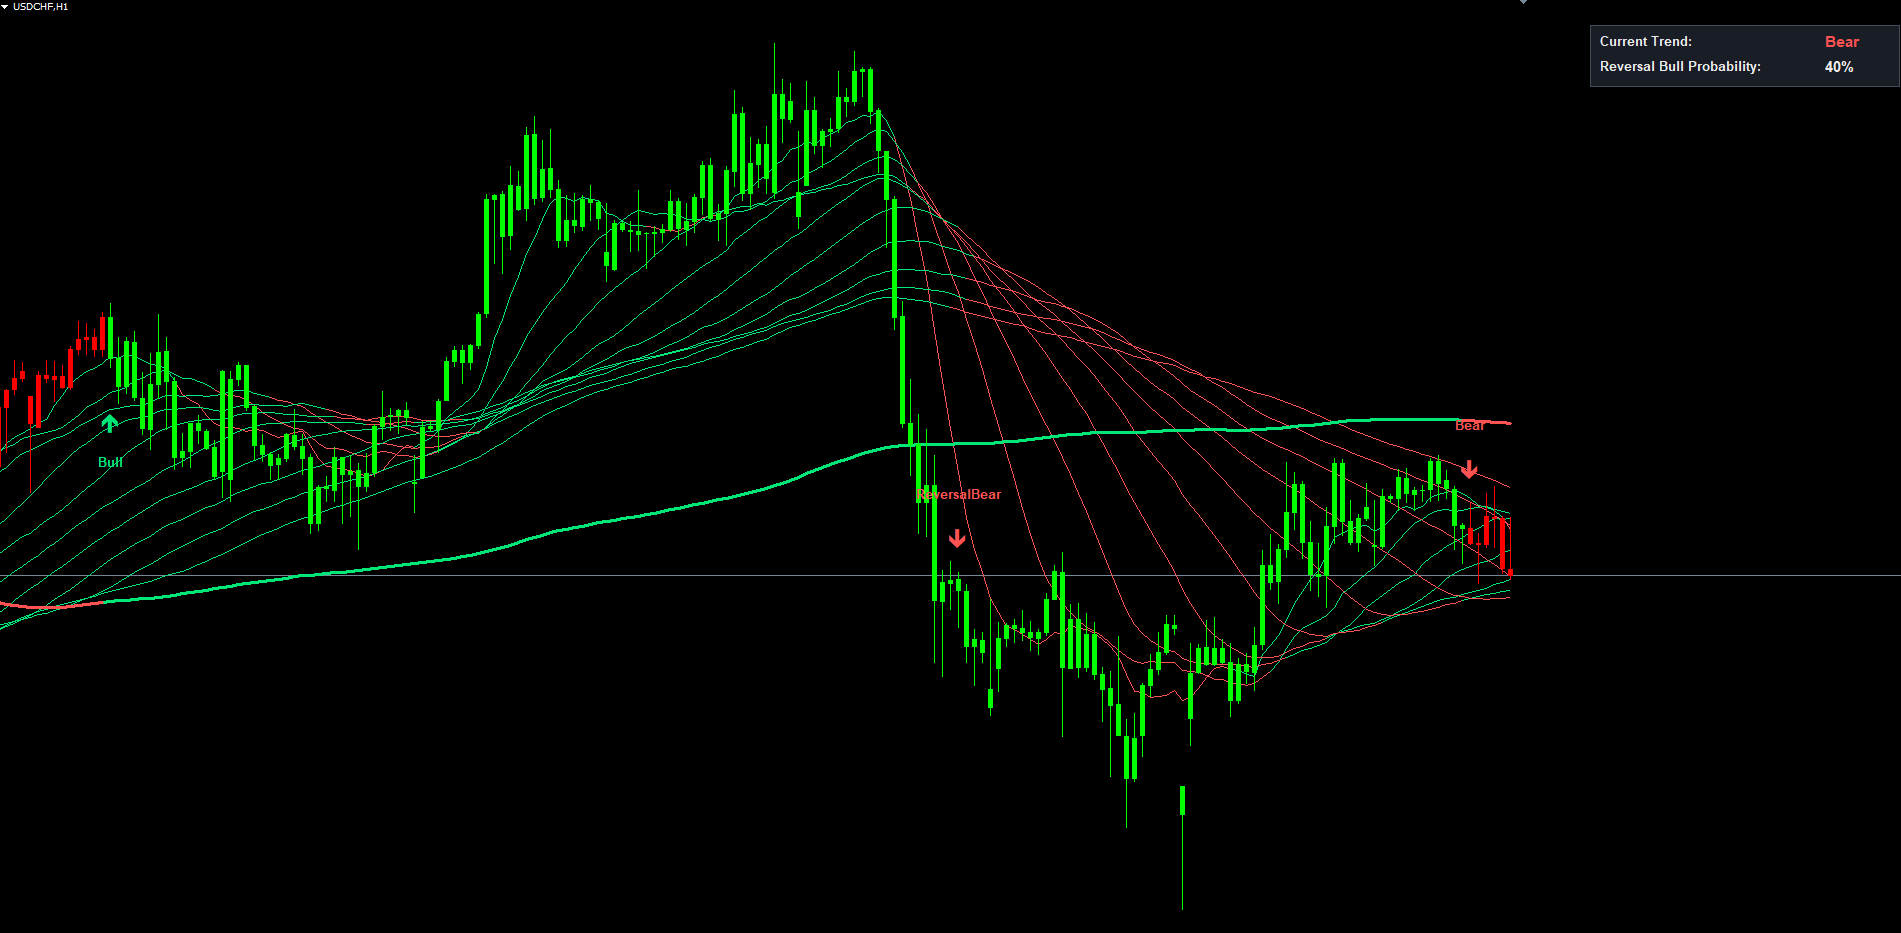
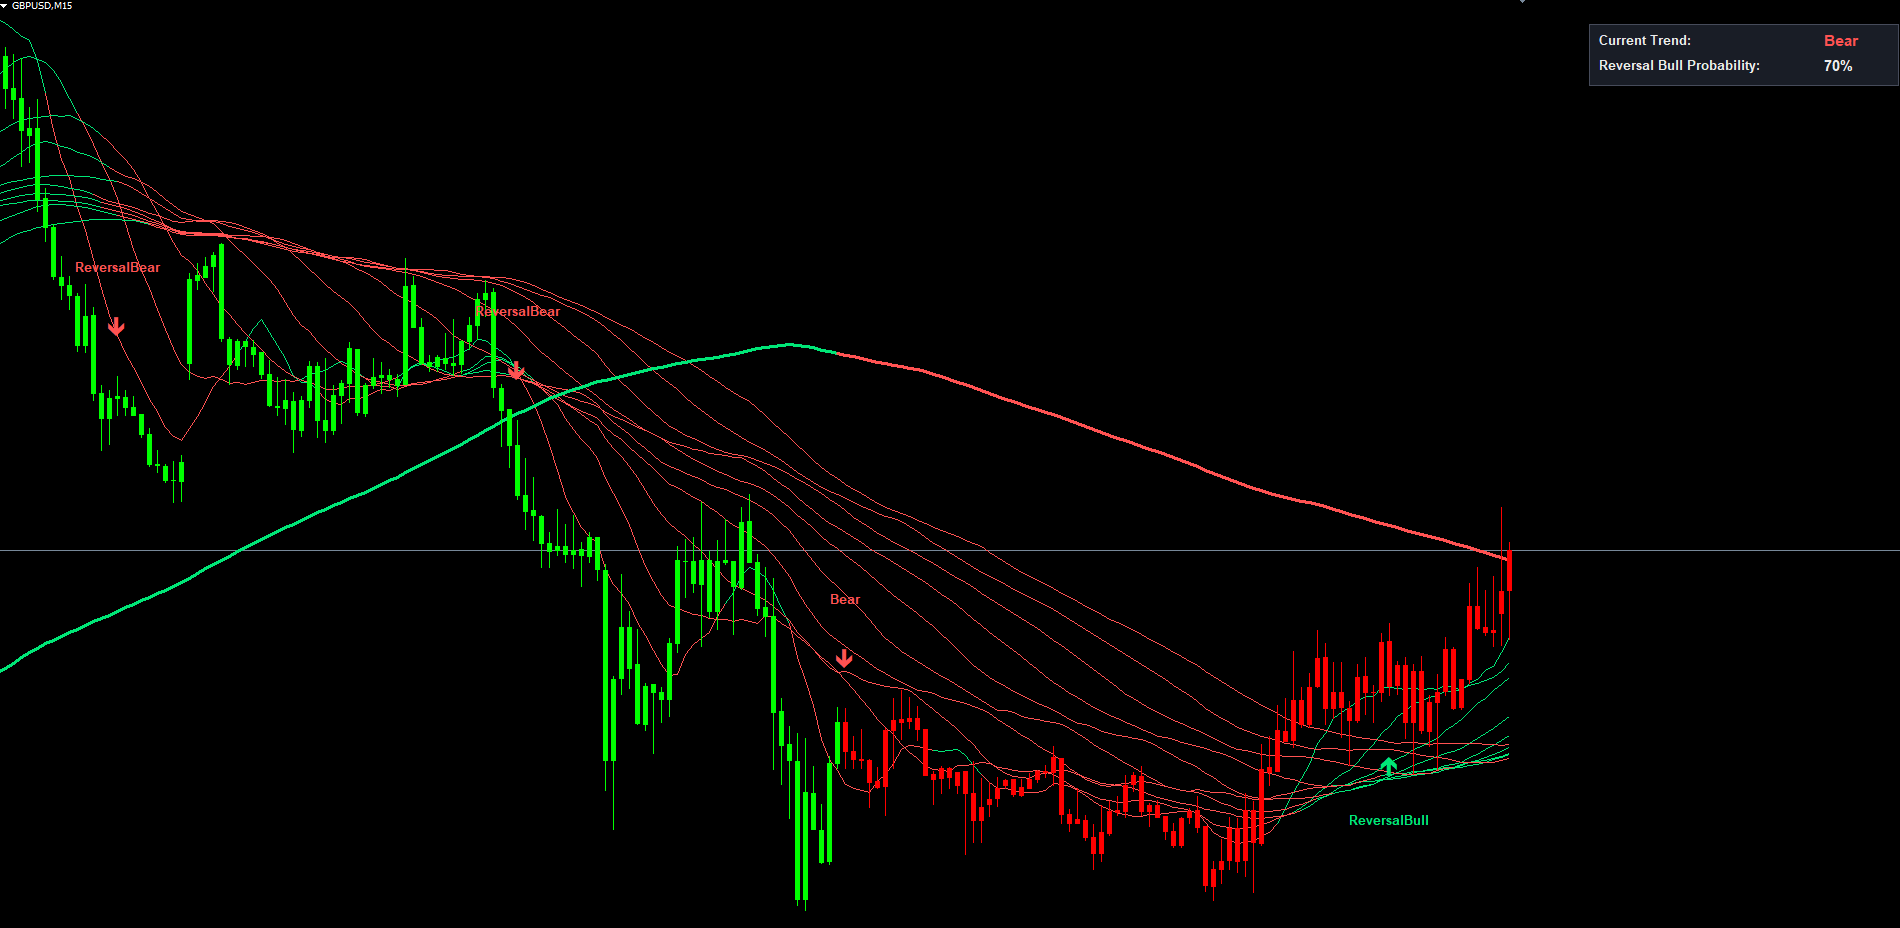
The 200-period MA acts as the structural trend reference. When its 14-bar ROC crosses above zero, a Bull label is placed on the chart and an alert fires; when it crosses below, a Bear label is placed. Between these structural turns, the indicator monitors how many shorter MAs are sloping against the long-term direction. As that count climbs, individual MA lines flip color from the trend tone to the opposite tone, the dashboard reads out the percentage, and when the count crosses the user-defined sensitivity threshold a Reversal Bull or Reversal Bear label appears with a fourth alert channel.
Every signal printed on the chart is permanent. The indicator processes only closed bars for crossover detection and the on-chart labels are guarded against duplicate placement -- what you see on historical bars is what would have appeared in real time on those same bars.
Why Use a Multi-MA Ribbon Instead of a Single Moving Average
The single-moving-average approach has a known weakness. A 50-period MA rising above a 200-period MA tells you nothing about whether momentum is broad-based or narrow. Two markets can both show a 50/200 golden cross while being in radically different states: in one the entire MA stack from 10 to 200 slopes up in unison; in the other only the 50 has flipped while the 30, 70, 100, and 200 are still rolling over.
A ribbon of eleven MAs exposes this difference directly. When all eleven slope in the same direction, the trend has multi-timeframe agreement. When the shorter members (10, 20, 30, 40) start to flatten or slope opposite while the longer members (100, 200) continue, early divergence is visible. That divergence may resolve into a healthy pullback, or grow until enough members flip and the entire ribbon rolls over.
Trend Reversal Marker quantifies that progression. By taking the ROC of each MA and counting how many short-term ROCs have flipped against the long-term ROC, it produces a numeric readout of how much of the ribbon has turned. A reading of 30% means three of nine measurable short MAs are sloping opposite the trend; 70% means seven of nine have flipped. The trigger threshold (SignalPercentage) is configurable from 1 to 9.
The benefits over single-MA systems are twofold. First, noise is filtered -- one or two MAs flipping briefly does not generate a reversal label, so traders are not shaken out by minor pullbacks. Second, it provides early warning well before the dominant MA crosses zero, because by the time enough short members have flipped to reach a moderate threshold, the structural turn is usually already underway in price action.
The Rate of Change Function Explained
Rate of Change (ROC) measures the percentage change in a value over a fixed lookback period: (MA_now - MA_n_bars_ago) / MA_n_bars_ago * 100 . The lookback n is set by the RocLength input (default: 14 bars).
ROC is preferred over a simple bar-to-bar slope comparison because it smooths out tick fluctuations and the percentage normalization makes results comparable across instruments with different price scales. Positive ROC means the MA is sloping up; negative means down; zero means flat.
The 14-bar default balances sensitivity and stability. Shorter windows (5-7) react faster but produce whipsaws. Longer windows (20-30) are smoother but lag.
The indicator computes ROC for all eleven MAs on every bar. The ROC of the 200-period MA ( roc11 ) defines the dominant trend direction. The ROCs of the shorter MAs are used to detect divergence from that trend.
Trend Detection: The Bull and Bear Signals
The most basic signal is the Bull / Bear label, which marks the moment the dominant trend changes direction.
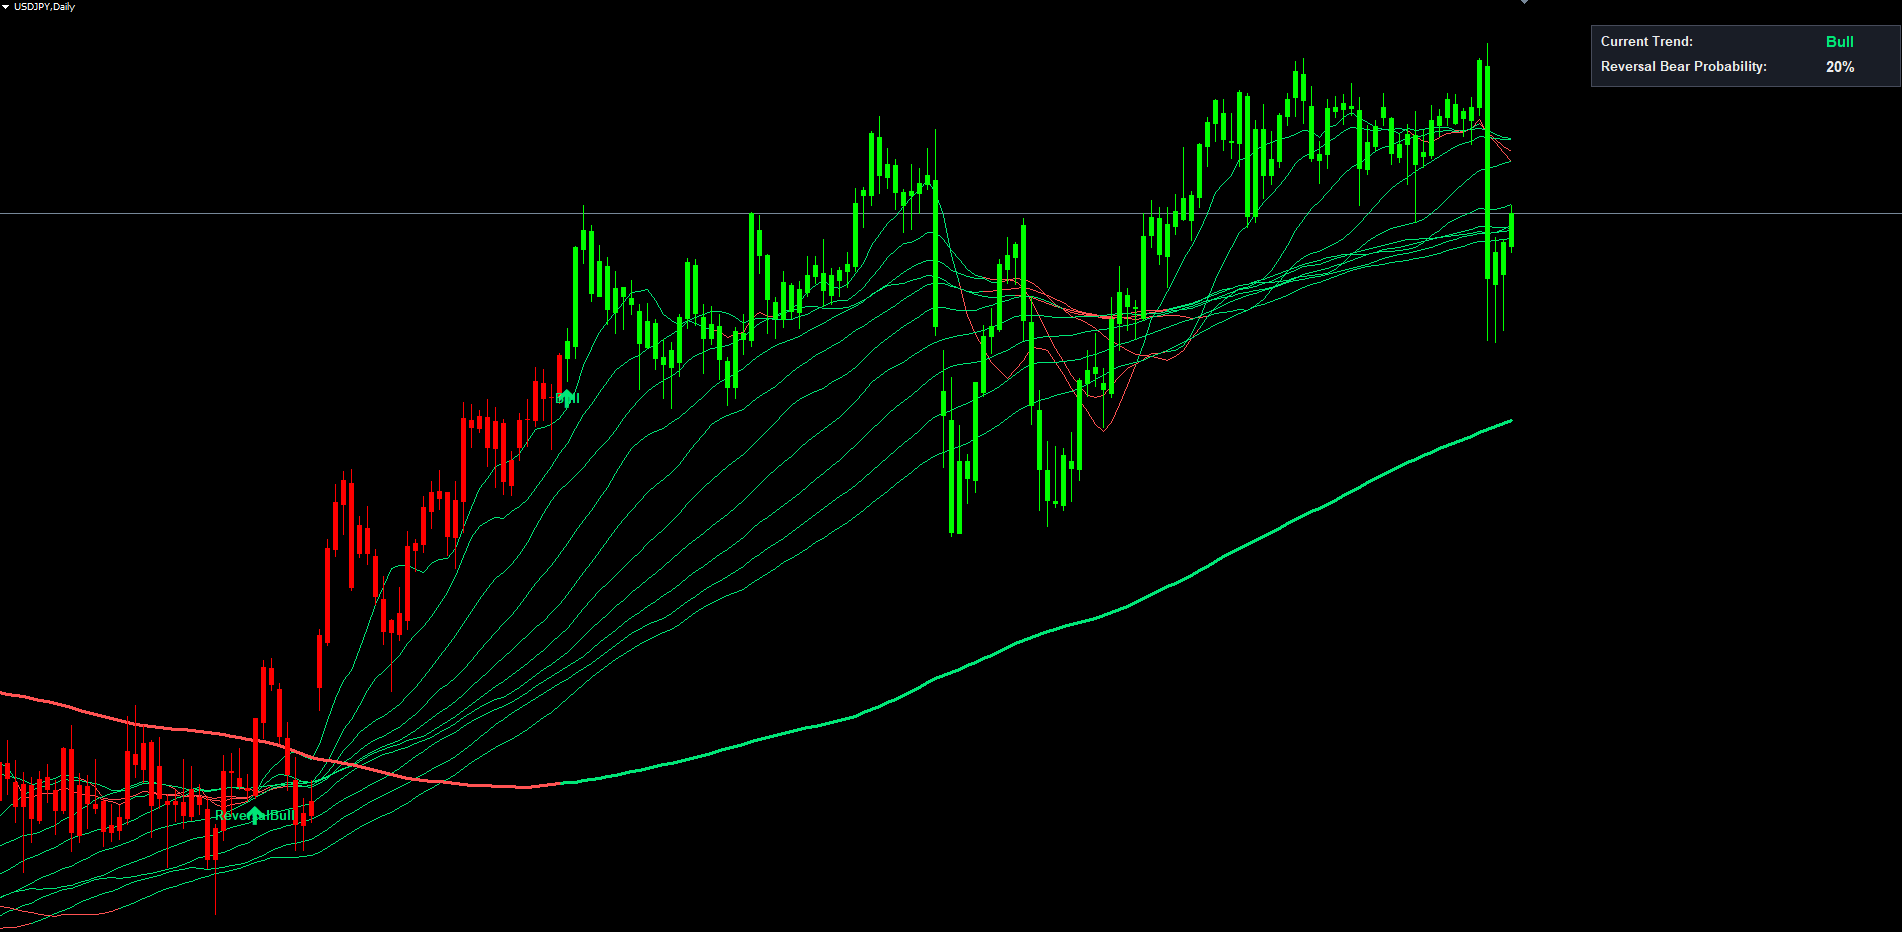
A Bull signal fires when roc11 crosses above zero -- the 200-period SMA, which had been sloping downward, has just begun to slope upward. The label is placed below the bar's low in green. A Bear signal fires when roc11 crosses below zero -- the 200 SMA has just begun to slope downward after sloping upward. The label is placed above the bar's high in red.
These signals are infrequent on higher timeframes. On a daily chart of a major Forex pair, the 200 SMA changes its 14-bar ROC sign just a few times per year, and each occurrence corresponds to a major structural turn. On lower timeframes the events are more frequent but each one still represents a meaningful change in the prevailing trend bias on that timeframe.
Bull and Bear signals serve as entry triggers for traders who want to participate in fresh trends from the very beginning of structural confirmation, and as bias resets for any auxiliary systems that consume the indicator's output. They are non-repainting: crossover detection runs on the most recently CLOSED bar, not the live forming bar. If price would temporarily push roc11 across zero but pulls back before the bar closes, no signal is generated. Once a label appears, it is permanent.
Reversal Probability and the Reversal Signals
Between Bull and Bear structural turns the dominant trend is established but the market does not move in a straight line. The challenge for the trend trader is to distinguish a routine pullback from the early stages of a true reversal.
The reversal probability calculation handles this. On every bar, the indicator counts how many short MAs (1 through 10, skipping MA6 to preserve compatibility with the original Pine source) are sloping against the dominant trend. The maximum count is 9. The count is multiplied by 10 to produce the percentage shown in the dashboard.
When roc11 > 0 (uptrend), the dashboard reads "Reversal Bear Probability:" and shows the percentage of short MAs that have flipped to negative slope. 0% means every short MA agrees; 50% means half have started declining; 90% means a structural reversal is almost certainly in motion. Mirror logic applies in downtrends.
Beyond display, the indicator fires an explicit signal when the count crosses the SignalPercentage threshold (default: 5, range: 1-9). A ReversalBull label appears when the bull-count crosses above the threshold during a downtrend (and no concurrent Bear label is firing). A ReversalBear label appears when the bear-count crosses above the threshold during an uptrend.
Low SignalPercentage values (1-3) make the indicator very reactive -- more signals but more false alarms during deep pullbacks. High values (7-9) only trigger when nearly every short MA has flipped, capturing the most decisive turns with significant lag. The default of 5 fires when a clear majority (6 or more of 9) have flipped, which historically corresponds to the early stages of a genuine reversal rather than a temporary correction.
Reversal signals describe the current state of MA agreement; they are not price predictions. Some traders use them as exit triggers (lock in profits when the trend weakens), others as early warnings to tighten stops, and a smaller group as counter-trend entries on shorter timeframes.
Color-Switching Moving Average Lines
Each of the eleven MA lines is colored individually based on its current ROC sign relative to the dominant trend:
- A short MA whose ROC has flipped against the trend is drawn in the OPPOSITE color
- A short MA whose ROC agrees with roc11 is drawn in the trend color
- The 200-period MA is always drawn in the dominant trend color
In a healthy uptrend, all eleven MAs are green. As the rally tires, the 10, 20, 30 lines flip to red one by one. By the time half the ribbon has switched color, the visual signature is unmistakable -- no need to read the dashboard percentage.
The 200-period MA is drawn at width 3 (thicker than the other ten) so traders can identify the dominant reference at a glance. The other ten use width 1, producing the dense ribbon appearance. Color transitions are bridged automatically: when an MA flips color across bars, the indicator places a connecting point in both buffers so the line is continuous with no visual gap.
A glance at the chart conveys the entire structural state: trend direction (color of MA200), strength of agreement (how many thin MAs match), and progress toward reversal (how many have flipped).
The Trend-Colored Candle Overlay
The indicator overlays each price candle with a thick colored body matching the dominant trend. When roc11 > 0 bodies are bright green; when roc11 < 0 they are bright red. The overlay uses paired DRAW_HISTOGRAM buffers in MT4 and DRAW_HISTOGRAM2 buffers in MT5, drawn on top of the chart's native candles with body width 3 and wick width 1.
The candle coloring is purely informational -- it does not generate signals. Its role is to make the dominant trend direction obvious at every bar, helping with manual pattern recognition (e.g. recognizing a bullish engulfing during a clearly green region versus mid-reversal). Disable via ShowColoredCandles.
The On-Chart Dashboard
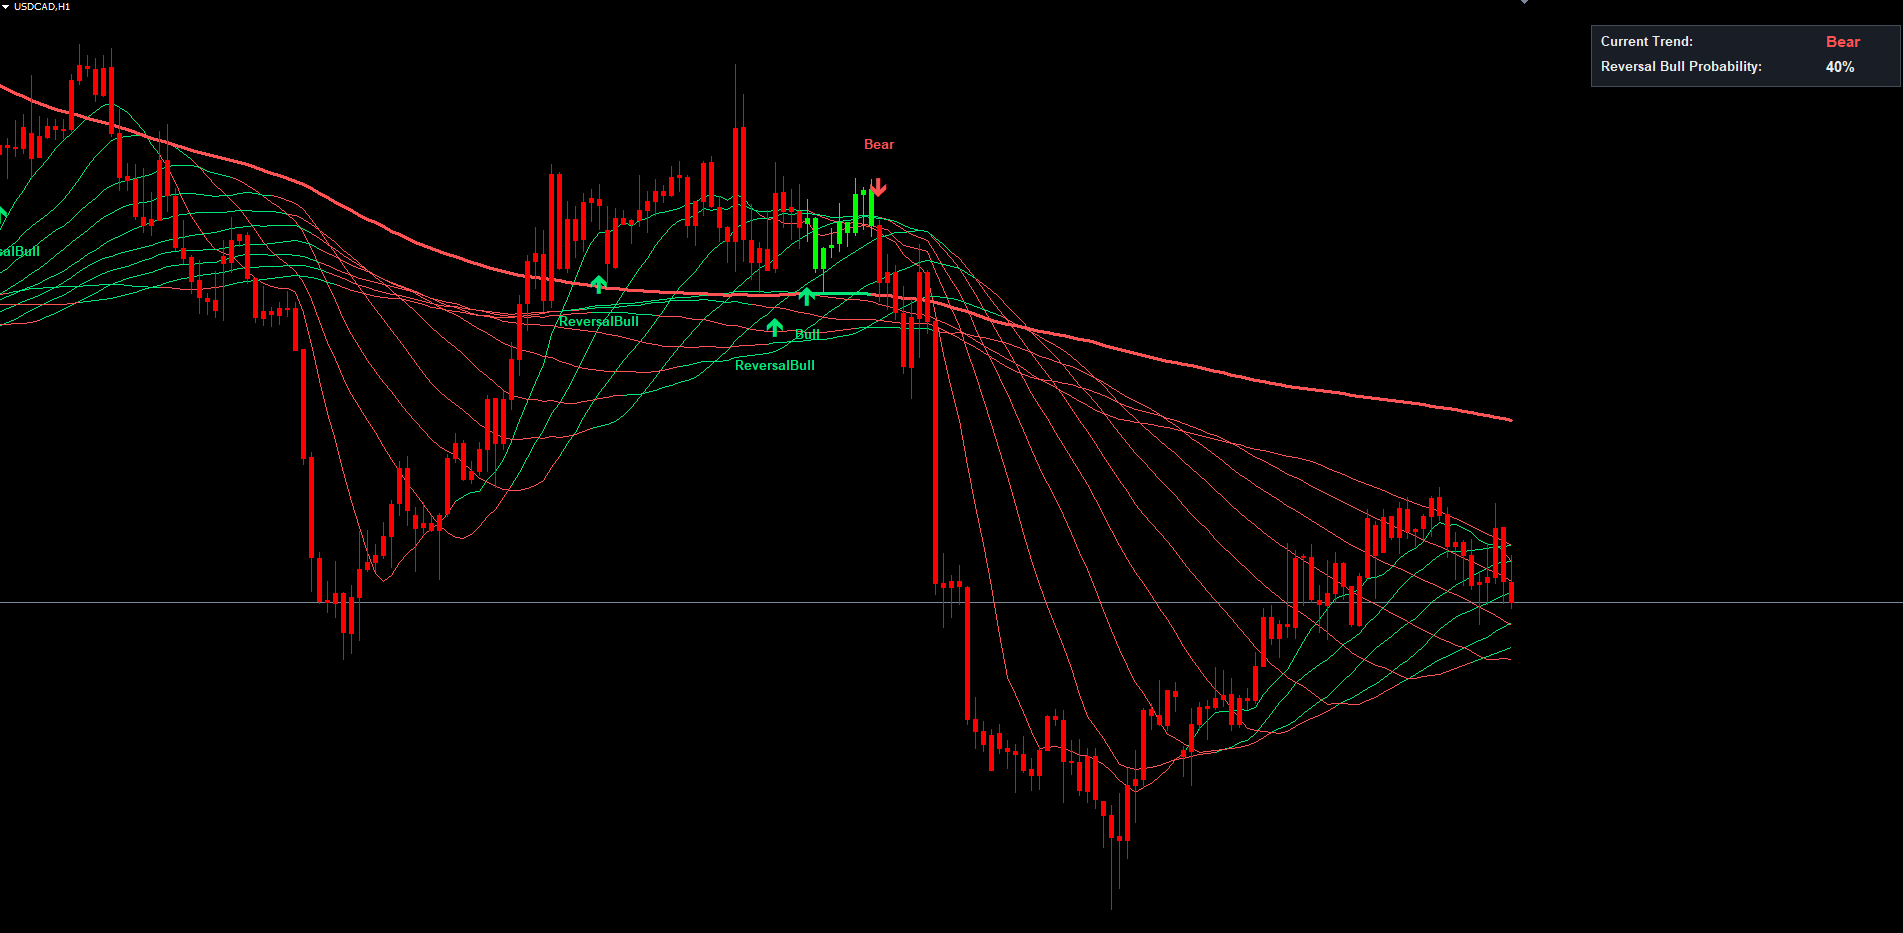
A fixed-position information panel anchored to the upper-right corner displays two rows that update on every tick:
Row 1: Current Trend. "Bull" in green when roc11 > 0, "Bear" in red when roc11 < 0.
Row 2: Reversal Probability. In uptrends reads "Reversal Bear Probability:" with a number from 0% to 90%. In downtrends reads "Reversal Bull Probability:" with the bear-count percentage.
The panel updates every 500 ms in MT5 (driven by an internal timer) and on every tick in MT4. Traders see the percentage tick up in real time as the market evolves -- when a strong rally stalls, the percentage climbs from single digits into the teens and beyond, and crossing the SignalPercentage threshold triggers the corresponding Reversal label.
The panel automatically repositions when the chart is resized. Internally it anchors to CORNER_LEFT_UPPER with the X coordinate computed as chart_width - panel_width - margin , avoiding the MT4/MT5 issue where right-corner-anchored objects extend off-screen at certain chart sizes. Disable via ShowDashboard.
The Alert System
The indicator generates alerts for four distinct events:
- Bull Signal -- roc11 crosses above zero (new uptrend)
- Bear Signal -- roc11 crosses below zero (new downtrend)
- Reversal Bull -- bull-count crosses SignalPercentage during a downtrend
- Reversal Bear -- bear-count crosses SignalPercentage during an uptrend
Each alert can be enabled / disabled individually (AlertBull, AlertBear, AlertReversalBull, AlertReversalBear), all on by default.
Four delivery channels are configurable independently:
| Channel | Default | Parameter |
|---|---|---|
| Popup dialog | Enabled | AlertPopup = true |
| Sound (alert.wav) | Enabled | AlertSound = true |
| Push (mobile) | Disabled | AlertPush = false |
| Disabled | AlertEmail = false |
AlertSoundFile lets you choose any .wav file in the MetaTrader Sounds folder. All alerts are guarded by per-event bar tracking -- once a Bull alert fires for a bar, no second Bull alert can fire on the same bar. The message format includes symbol, timeframe and event description, e.g. [EURUSD H1] TRMI: Reversal Bear (countBear > 5) .
Push notifications require a MetaQuotes ID configured in Tools > Options > Notifications. Email alerts require SMTP setup in Tools > Options > Email.
Non-Repainting Architecture
A non-repainting indicator never modifies, removes or repositions a signal after placement. Repainting indicators look great in backtests because every "wrong" signal in the past was silently corrected, but they fail in live trading. Trend Reversal Marker is non-repainting by design.
Three implementation pillars:
Closed-bar evaluation. Crossover detection runs on the most recently CLOSED bar (shift = 1), not the live forming bar. Even if intra-bar price would briefly satisfy a condition, no signal generates until the bar closes with the final value.
Per-event bar tracking. Each signal type stores the timestamp of the last bar on which it fired. On subsequent ticks within the same bar, the signal cannot re-fire.
Object-name uniqueness. Signal labels (OBJ_ARROW + OBJ_TEXT) are named with the bar's timestamp as suffix (e.g. TRMI_Bull_A_1717372800 ). Before drawing, the indicator checks whether the object exists and skips if so. Re-calculation passes cannot duplicate or overwrite existing signals.
In practice: every label visible on the chart was placed on the bar where the crossover completed at bar close. Backtesting produces results matching what a trader would have seen in real time.
The Calculation in Detail
For readers who want to understand exactly how each bar is processed, the per-bar logic is:
- Compute eleven SMAs at the current bar -- one per Length1..Length11 input
- Compute eleven ROCs with (MA_now - MA_RocLength_bars_ago) / MA_RocLength_bars_ago * 100
- Determine trend direction: roc11 > 0 = bull, roc11 < 0 = bear
- Determine each MA's color: short MAs whose ROC has flipped against the trend get the OPPOSITE color; otherwise they match the trend. MA200 always matches roc11 sign
- Count reverting MAs: sum the "reverting bull" flags from MA1, MA2, MA3, MA4, MA5, MA7, MA8, MA9, MA10 (skipping MA6 for Pine compatibility) into countBull; countBear similarly. Both max at 9
- Detect crossovers (closed bars only):
- Bull = roc11 > 0 AND roc11_prev <= 0
- Bear = roc11 < 0 AND roc11_prev >= 0
- ReversalBull = countBull > SignalPercentage AND countBull_prev <= SignalPercentage AND NOT Bear
- ReversalBear = countBear > SignalPercentage AND countBear_prev <= SignalPercentage AND NOT Bull
- Place labels and fire alerts for any signal that is true on this bar and hasn't already been alerted for this bar's timestamp
- Update buffers: write MA values into bull/bear plot buffers per the color rule; write candle OHLC into the bull or bear candle buffers per roc11 sign
- Update dashboard with live trend and reversal probability
The sequence runs on every tick for the forming bar but only fires new signals when a crossover is detected on a freshly closed bar.
Practical Trading Workflow
The most common workflow is a four-step process:
- Read the dominant trend from the dashboard or from the color of the thick MA200 line.
- Watch the ribbon for early reversal cues. If most thin MAs match MA200's color, the trend has broad agreement. If several flip to the opposite color, watch the dashboard percentage -- a reversal may be developing.
- React to Bull/Bear and Reversal labels. Bull/Bear means the structural trend has officially changed. Reversal labels are early warnings; many traders use them to scale out of trend positions or tighten stops, then wait for the Bull/Bear confirmation before reversing direction.
- Use alerts for unattended monitoring. Four signal alerts × four delivery channels lets you monitor a watchlist of instruments without watching charts continuously.
Timeframe Considerations
Lower timeframes (M1-M15): MA200 covers a short calendar window. Signals fire frequently. Best for scalping.
Medium timeframes (M30-H4): MA200 covers several days to weeks. Signals are well-spaced and align with multi-day structure. Most popular for swing trading.
Higher timeframes (D1-W1): MA200 covers most of a year or several years. Bull/Bear signals are rare and mark major structural turns. Best for position trading or for confirming the dominant bias before trading a lower timeframe.
Multi-Symbol and Multi-Timeframe Setups
Each chart instance maintains its own state, so the indicator can be applied to many charts simultaneously. A common configuration: attach to all major Forex pairs on the H1 chart with push notifications enabled, then open the relevant chart only when an alert arrives. A more advanced setup uses two timeframes per instrument -- H4 for dominant bias, H1 for entry timing.
Parameter Reference
All input parameters are listed below with their defaults and descriptions. Parameters can be modified through the indicator's Inputs tab when adding it to a chart or by right-clicking the indicator and selecting Properties.
Moving Average Lengths
| Parameter | Default | Description |
|---|---|---|
| Length1 | 10 | Period for the 1st (fastest) SMA |
| Length2 | 20 | Period for the 2nd SMA |
| Length3 | 30 | Period for the 3rd SMA |
| Length4 | 40 | Period for the 4th SMA |
| Length5 | 50 | Period for the 5th SMA |
| Length6 | 60 | Period for the 6th SMA |
| Length7 | 70 | Period for the 7th SMA |
| Length8 | 80 | Period for the 8th SMA |
| Length9 | 90 | Period for the 9th SMA |
| Length10 | 100 | Period for the 10th SMA |
| Length11 | 200 | Period for the 11th SMA (long-term trend reference) |
Trend Sensitivity
| Parameter | Default | Description |
|---|---|---|
| RocLength | 14 | Lookback length for ROC calculation on every MA |
| SignalPercentage | 5 | Reversal sensitivity threshold (1-9). Lower values fire ReversalBull / ReversalBear labels sooner |
Visual Toggles
| Parameter | Default | Description |
|---|---|---|
| ShowMAs | true | Display the 11-MA ribbon on the chart |
| ShowColoredCandles | true | Overlay candles with bull/bear color matching trend |
| ShowSignals | true | Show Bull/Bear/ReversalBull/ReversalBear text labels |
| ShowDashboard | true | Display the upper-right info dashboard |
Alert Switches
| Parameter | Default | Description |
|---|---|---|
| AlertBull | true | Send alert when a Bull signal fires |
| AlertBear | true | Send alert when a Bear signal fires |
| AlertReversalBull | true | Send alert when a ReversalBull signal fires |
| AlertReversalBear | true | Send alert when a ReversalBear signal fires |
Alert Delivery Channels
| Parameter | Default | Description |
|---|---|---|
| AlertPopup | true | Show on-screen popup dialog |
| AlertSound | true | Play sound from AlertSoundFile |
| AlertPush | false | Send push notification to MT mobile app |
| AlertEmail | false | Send email through MT SMTP |
| AlertSoundFile | "alert.wav" | Filename of sound to play (must exist in MT Sounds folder) |
Recommended Configuration Profiles
Conservative (rare, high-conviction). SignalPercentage = 7 or 8. Reversal labels only fire when nearly every short MA has flipped. Stay in trends as long as possible and only react to undeniable structural turns.
Default (balanced). SignalPercentage = 5. Fires Reversal labels when 6 or more of 9 short MAs have flipped, corresponding to the early stages of a genuine reversal.
Aggressive (early warnings). SignalPercentage = 2 or 3. Reversal labels fire at the first sign of MA divergence. Maximum sensitivity at the cost of more false alarms during deep pullbacks.
Installation
Trend Reversal Marker is distributed through the MQL5.com Market and installs automatically after purchase.
- Purchase from the MQL5.com Market product page.
- The indicator downloads and installs automatically into MetaTrader.
- Open the Navigator panel (Ctrl+N) and expand Indicators > Market.
- Drag Trend Reversal Marker onto any chart.
- Adjust input parameters if needed and click OK.
Works on all timeframes and instruments. No manual file copying required.
First load processes all available history. Minimum data: ~220 bars (Length11 + RocLength + 5). Ensure the chart has at least 250 bars; if not, increase Max bars in chart in Options > Charts. The indicator uses 34 buffers and creates graphical objects (signal arrows, text, dashboard) with the "TRMI_" prefix that are automatically cleaned up on removal.
Conclusion
Trend Reversal Marker turns "is this a pullback or a reversal?" into a quantitative reading. By tracking the slope of eleven SMAs and counting how many have flipped against the dominant trend, it produces a 0% to 90% probability score that updates on every tick. Two label types -- structural Bull / Bear at MA200 ROC zero crossings and ReversalBull / ReversalBear at the user-defined sensitivity threshold -- provide explicit entry and warning signals with full alert delivery on four channels.
The 11-MA ribbon paints itself in the trend color when MAs agree and in the opposite color when they have flipped, giving immediate visual feedback on trend health. Combined with the trend-colored candle overlay and the upper-right dashboard, the chart conveys the entire structural state at a glance. The non-repainting architecture ensures that what you see is what you would have seen in real time.
The indicator is designed for trend-followers and swing traders who want a structured, repeatable approach to identifying early reversals across Forex, Crypto, Stocks, Commodities, and Indices. It performs well on M30, H1, and H4 for swing entries but adapts to any timeframe.
Download the indicator:
- MetaTrader 5: Trend Reversal Marker MT5
- MetaTrader 4: Trend Reversal Marker MT4
CONTACT & SUPPORT
- Email: info@forexobroker.com
- Questions: Use the Comments section on the product page or send a private message
- Bug Reports: Please include your broker name, account type, and a screenshot
-
✅ All MQL Tools: https://www.mql5.com/en/users/forexobroker/ ✅
--------------------------------------------------------------------------------------------------------------
🏦 **Broker I use**: https://icmarkets.com/?camp=55869
🏦 **Broker For EU Traders I use 1**: https://www.ictrading.com?camp=91414
🏦 **Broker I use 2**: https://one.exnessonelink.com/boarding/sign-up/a/c_thuv62ocfq
💻 **VPS**: https://chocoping.com/processing/aff.php?aff=738
💼 **Companies I use for getting funded**:
Fundednext: https://fundednext.com/?fpr=kestutis39
The5ers: https://www.the5ers.com/?afmc=16kl
FTMO: https://trader.ftmo.com/?affiliates=nRAyOhmFRnEnFdOpdLeh
Risk Disclaimer
Trading foreign exchange and CFDs on margin carries a high level of risk and may not be suitable for all investors. You may sustain a loss exceeding your initial investment. Trend Quorum is a technical analysis tool and does not guarantee profitable trades. Past performance is not indicative of future results. The authors accept no liability for any loss arising from use of the indicator. By using Trend Quorum you acknowledge sole responsibility for your trading decisions.


![[XAUUSD]: Weekly Liquidity Activation Points (timings), June 29 - July 3, 2026](https://c.mql5.com/6/1014/splash-preview-772062.png "[XAUUSD]: Weekly Liquidity Activation Points (timings), June 29 - July 3, 2026")
