

Introduction
Every trader who has ever opened a MetaTrader chart with an RSI on it knows the same frustration. The RSI sits in a separate window below price. To read it, your eyes leave the candles, scan down, find a 0–100 number, and then come back up to figure out which candle that number actually belongs to. The cognitive switch breaks pattern recognition. Worse: when the RSI prints "72", you have no idea what price the market would need to reach for it to print "70" again. The overbought level is an abstract number, not a place on the chart.
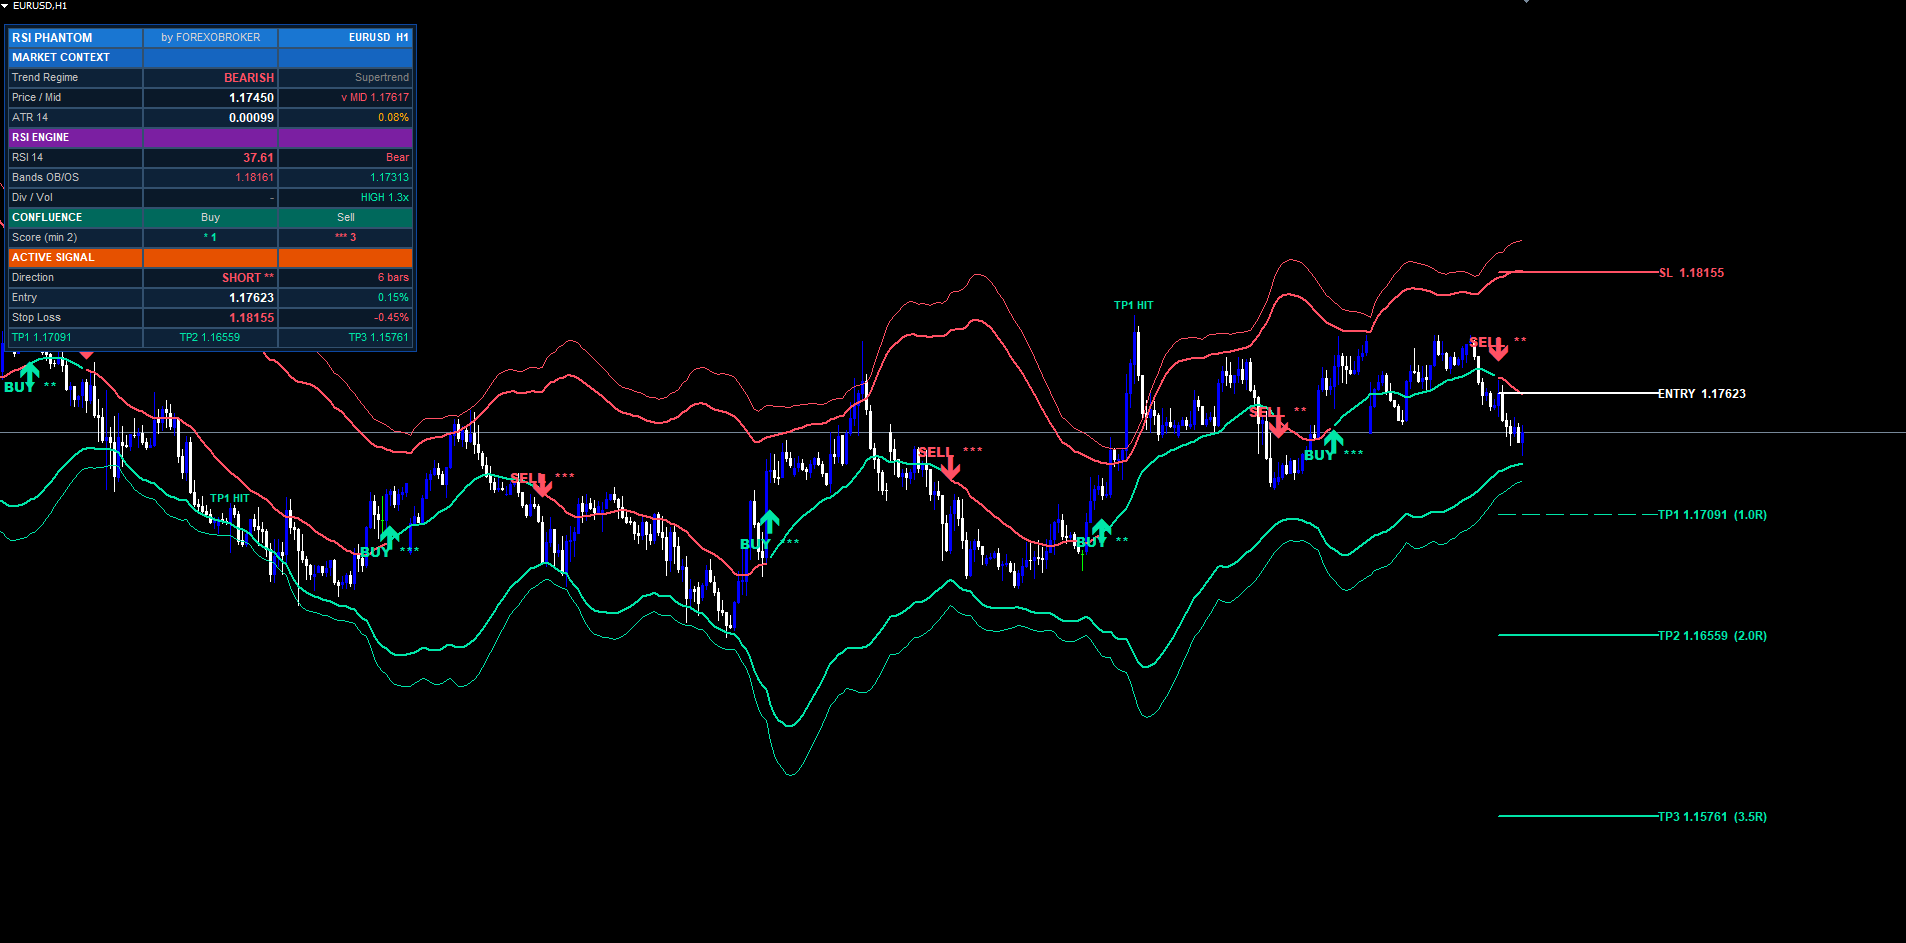
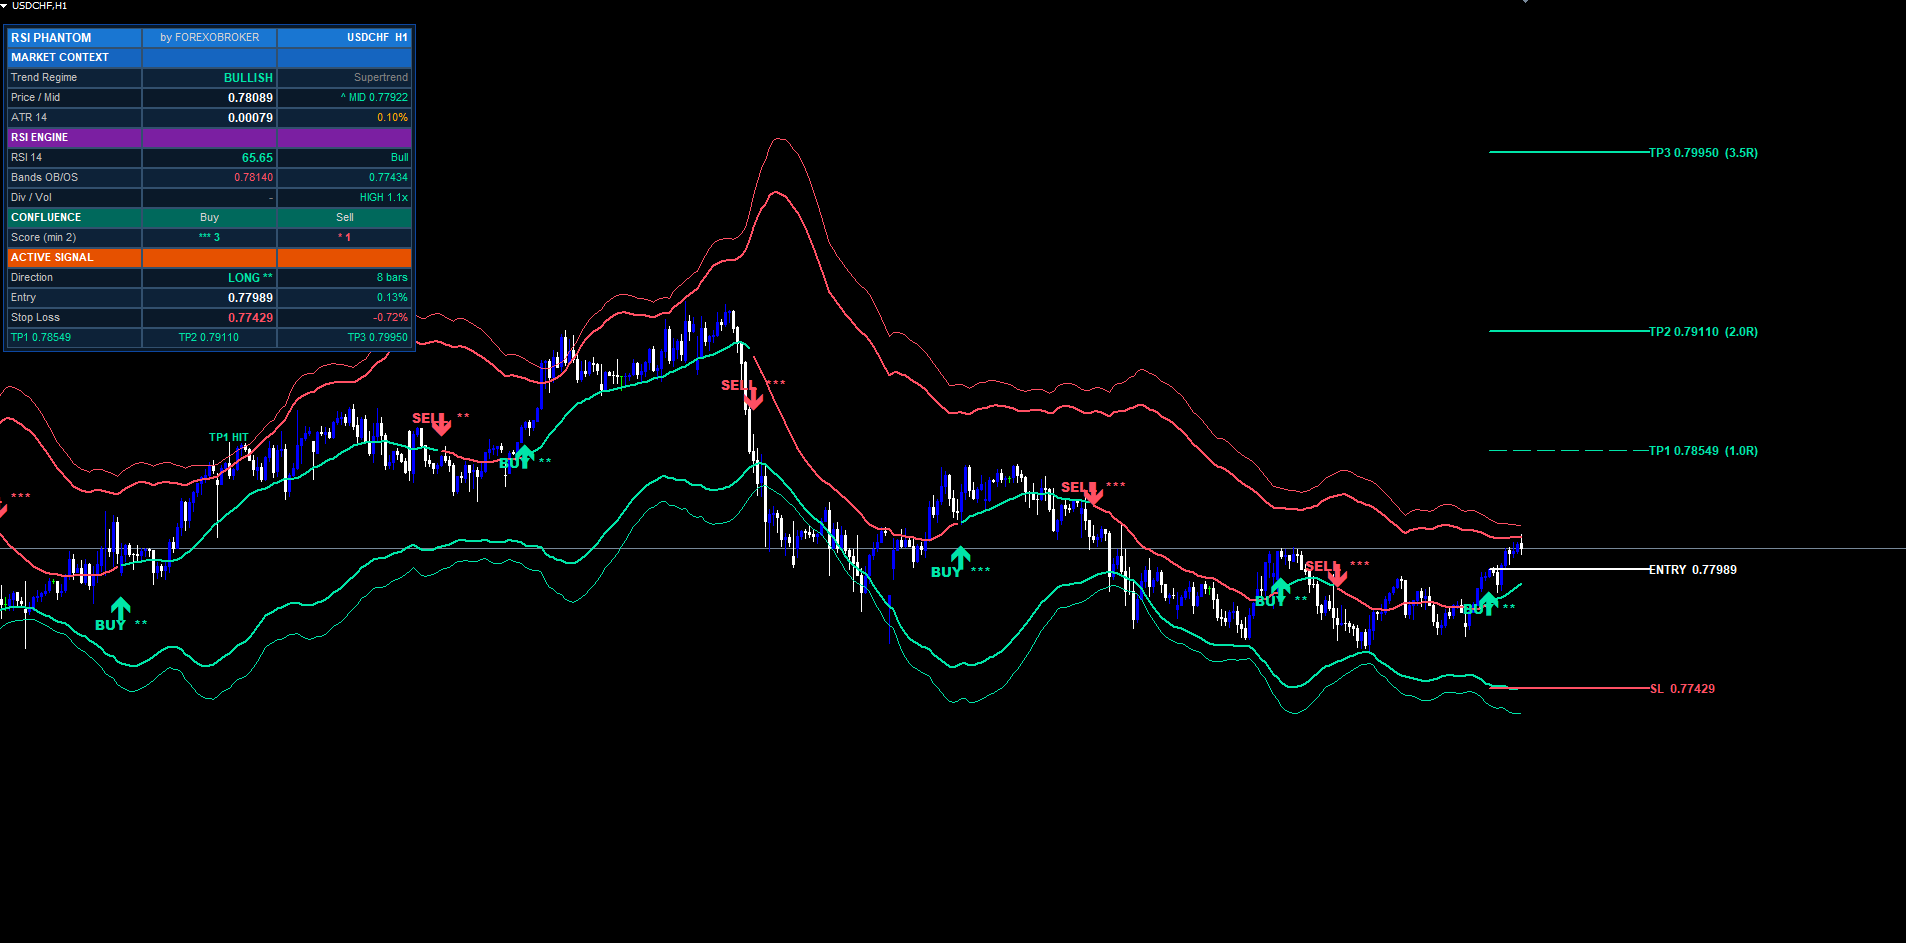
Reverse RSI Phantom solves this in the most direct way possible: it inverts the RSI formula. Given the previous bar's up-move and down-move averages, it computes the exact price at which RSI would equal 70 (overbought), 30 (oversold), and 50 (midline) on the next bar — and then plots those prices as live bands directly on the candles. The result is an RSI you can read at a glance, in the same visual space as price action.
On top of that price-level engine, the indicator stacks five confluence layers, a state-machine Supertrend trend filter, a pivot-based RSI divergence detector, three SL computation modes, three configurable take-profit targets, and a multi-section dashboard. Everything is non-repainting and built for production use on the MQL5.com Market. This article walks through every component in detail.
Download the indicator:
- MetaTrader 5: Reverse RSI Phantom MT5
- MetaTrader 4: Reverse RSI Phantom MT4
TIP: Reverse RSI Phantom works on every symbol and every timeframe. Higher timeframes (H1+) produce fewer, stronger signals. Lower timeframes generate more setups; tune the minimum-confluence input to control signal frequency.
The Inverted-RSI Concept
The traditional RSI calculation works in three steps. First, it computes the smoothed average of recent up-closes and the smoothed average of recent down-closes (using Wilder's RMA smoothing). Second, it forms the ratio RS = AvgUp / AvgDown. Third, it maps that ratio into a 0–100 scale using the formula RSI = 100 - 100 / (1 + RS) . The output is an oscillator.
What if you ran that calculation in reverse? Given a target RSI value (say, 70), and given the previous bar's smoothed up and down averages, you can solve for the price change that would produce exactly that RSI value on the current bar. That price change, when added to the previous close, gives you the exact price level at which the RSI would equal 70 right now.
Apply this inversion to three target levels — 70 (overbought), 30 (oversold), and 50 (midline) — and you get three running price bands. The overbought band represents the price at which the market would be considered overstretched by RSI standards. The oversold band marks the symmetric level below. The midline is the price at which RSI = 50, which is conceptually the "equilibrium" point where up-pressure and down-pressure balance out.
These are not approximations. They are the exact inversions of Wilder's RSI formula, and as the market prints new candles each tick they update in real time, exactly the same way the standard RSI would update — except instead of seeing the number "72" you see the price line that corresponds to "70" running right above the candles. When price punches through the upper band, RSI has crossed 70. When price closes below the lower band, RSI has crossed 30. The information is the same, but the cognitive overhead of mapping between "oscillator number" and "chart location" disappears.
The bands also smooth visually. An optional 14-period EMA filter on the band values prevents single-tick jitter and produces clean lines that follow the underlying momentum trend. The midline is colored mint when the Supertrend regime is bullish and red when bearish, so the trend regime is encoded in the visualization itself.
The Math Behind the Inversion
Wilder's RSI uses Wilder's recursive moving average (RMA) to smooth up-changes and down-changes:
upR_new = (upR_prev * (len - 1) + upNow) / len dnR_new = (dnR_prev * (len - 1) + dnNow) / len RSI = 100 - 100 / (1 + upR_new / dnR_new)
where upNow = max(close - close_prev, 0) and dnNow = max(close_prev - close, 0) .
Reverse RSI Phantom's inverter (the f_price_for_rsi function) starts from a target RSI level L and solves for the price change c that would produce that level. The first step is to compute the implied RS ratio for the target level:
RS_target = L / (100 - L)
For L = 70, RS_target = 70/30 ≈ 2.333. For L = 30, RS_target = 30/70 ≈ 0.4286. For L = 50, RS_target = 1.
Next, we need to express the new RMA values in terms of the previous-bar RMA values plus the candidate change c . There are two cases. If c >= 0 (a price rise), then upNow = c and dnNow = 0 . The new averages become:
upR_new = (upR_prev * (len - 1) + c) / len dnR_new = (dnR_prev * (len - 1) + 0) / len = dnR_prev * (len - 1) / len
Setting upR_new / dnR_new = RS_target and solving for c :
c_pos = RS_target * (dnR_prev * (len - 1)) - upR_prev * (len - 1)
For the symmetric case where c < 0 (a price drop):
c_neg = dnR_prev * (len - 1) - upR_prev * (len - 1) / RS_target
The indicator picks whichever case produces a non-negative c_pos and uses the corresponding price change. The new price is simply:
price_for_RSI(L) = close_prev + c
This is the exact price that, if printed at the current bar's close, would produce RSI = L. No iteration, no approximation, no numerical search — a closed-form solution. Run it for L = 70, L = 30, and L = 50, and you have your three bands.
The inversion is computed every bar using the previous bar's confirmed RMA averages. Because previous-bar values are immutable once the bar closes, the bands themselves are immutable as well. They never repaint, never recalculate, never shift. The line you see on bar N at chart load is exactly the line that was there during the bar-N close.
There is one important consequence to keep in mind: the bands are forecasts of where RSI levels would be if the next bar moves there. The current bar's RSI does not have to actually reach 70 for price to touch the upper band — touching the band means RSI is in the process of reaching 70 on this bar's close. This is exactly what we want: an actionable, forward-looking visualization of the overbought/oversold zone.
Supertrend Trend Filter on the Midline
Running Supertrend on raw price is one of the most popular trend filters in retail trading, but it suffers from a well-known problem: price is noisy, and Supertrend's reliance on ATR-bands plus a state-machine produces frequent regime flips on choppy markets. The same logic applied to a smoother input produces far cleaner results.
Reverse RSI Phantom applies Supertrend not to price but to the RSI=50 midline. Because the midline is a momentum-based construct derived from RMA-smoothed up/down averages, it is significantly smoother than raw price while still tracking trend direction accurately. Running Supertrend on this signal produces a regime classifier that flips infrequently and meaningfully.
The implementation uses a custom ATR calculated from the midline's own highest/lowest range over a 15-bar window (configurable). The Supertrend factor is 0.4 by default — tighter than typical price-Supertrend setups because the midline is already smoothed. The state machine has two states: bullish (direction = -1, color = mint, midline rendered on the chart in mint) and bearish (direction = +1, color = red, midline rendered in red).
A trend shift event fires when the state machine transitions from one direction to the other. Trend shifts are one of the three primary trigger sources for the confluence engine — when Supertrend flips from bearish to bullish on a confirmed bar close, a bullish trigger is registered and the confluence scoring begins. The same applies symmetrically for bearish flips.
The trend regime also feeds into the optional trend gate input. When the trend gate is enabled (default), buy signals are only allowed in bullish regime and sell signals only in bearish regime — even if all five confluence layers pass. This prevents counter-trend signals from firing in established directional moves, which is the single biggest source of losing setups in mechanical RSI systems.
For traders who want to fade strength rather than follow it, the trend gate can be disabled. In that case, buy signals will fire on bullish triggers regardless of regime, and the trader takes on the responsibility of filtering counter-trend setups manually.
The Five-Layer Confluence Engine
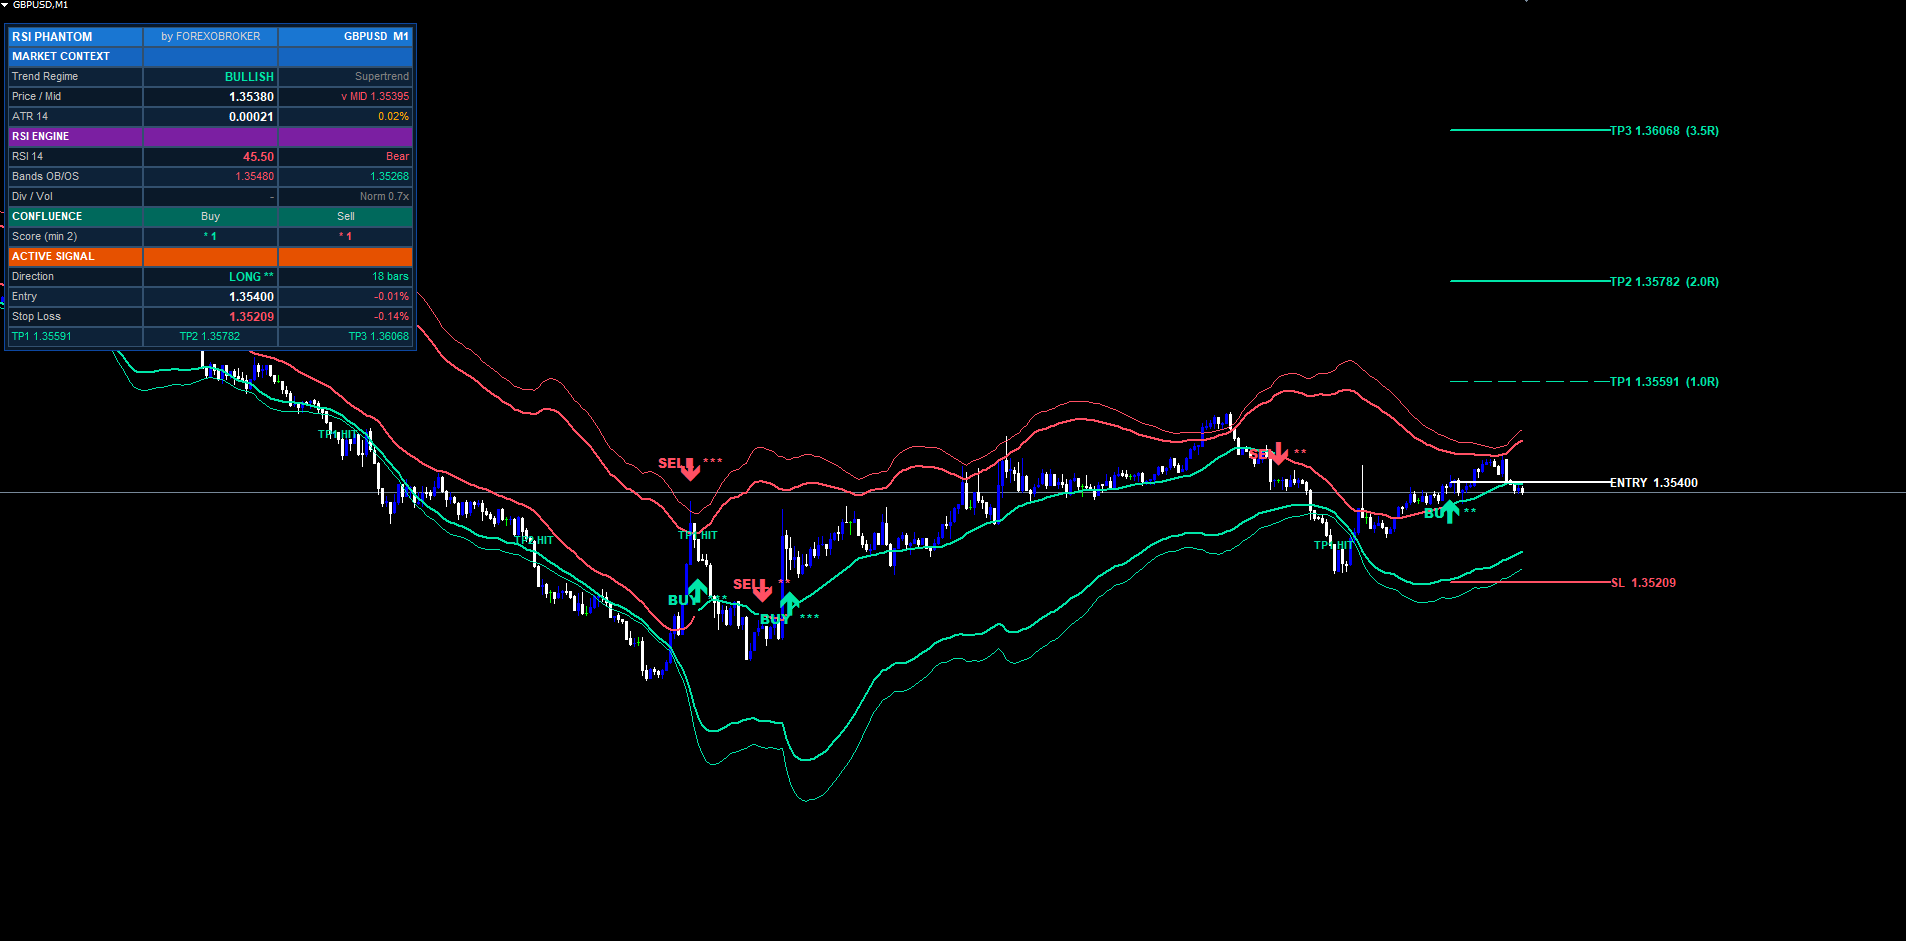
A raw trigger — Supertrend trend shift, close cross over/under a band, or RSI divergence — is necessary but not sufficient to draw a signal. The confluence engine scores every trigger against five independent layers, and only triggers that pass the minimum-confluence threshold are rendered as BUY or SELL labels.
The five layers, with default behavior:
-
Trend Regime. Bullish signals get +1 when Supertrend regime is bullish. Bearish signals get +1 when regime is bearish. If neutral or opposite, no point.
-
RSI Confirmation. Bullish signals get +1 when RSI crosses up through the oversold level (default 30) or is above 50. Bearish signals get +1 when RSI crosses down through the overbought level (default 70) or is below 50. This input can be disabled, in which case the layer awards a free point.
-
Band Retest. Bullish signals get +1 when the low of any of the last 8 bars touched the lower (oversold) band. Bearish signals get +1 when the high of any of the last 8 bars touched the upper band. The point is to require the market to have actually visited the extreme zone before reversing. This input can be disabled.
-
Divergence. Bullish signals get +1 when a regular bullish RSI divergence is active on this bar. Bearish signals get +1 when regular bearish divergence is active. Divergence is computed using pivot detection on the RSI line (covered in the next section).
-
Volume Burst. Both directions get +1 when the current bar's tick volume is at least 1.0× the 20-bar volume SMA. The default threshold means "volume is at least average." Tighten or relax the gate by toggling the input on/off. When disabled, the layer awards a free point.
The total score ranges from 0 to 5. The minimum-confluence input (default 2) sets the threshold at which the indicator commits to drawing the signal. A score of 2 means "at least two filters agree" — a balanced setting for swing trading. A score of 4 means "almost everything aligns" — a strict setting for scalping where false positives are expensive. A score of 5 means "every filter agrees" — extremely rare, typically a few times per month on H1 majors.
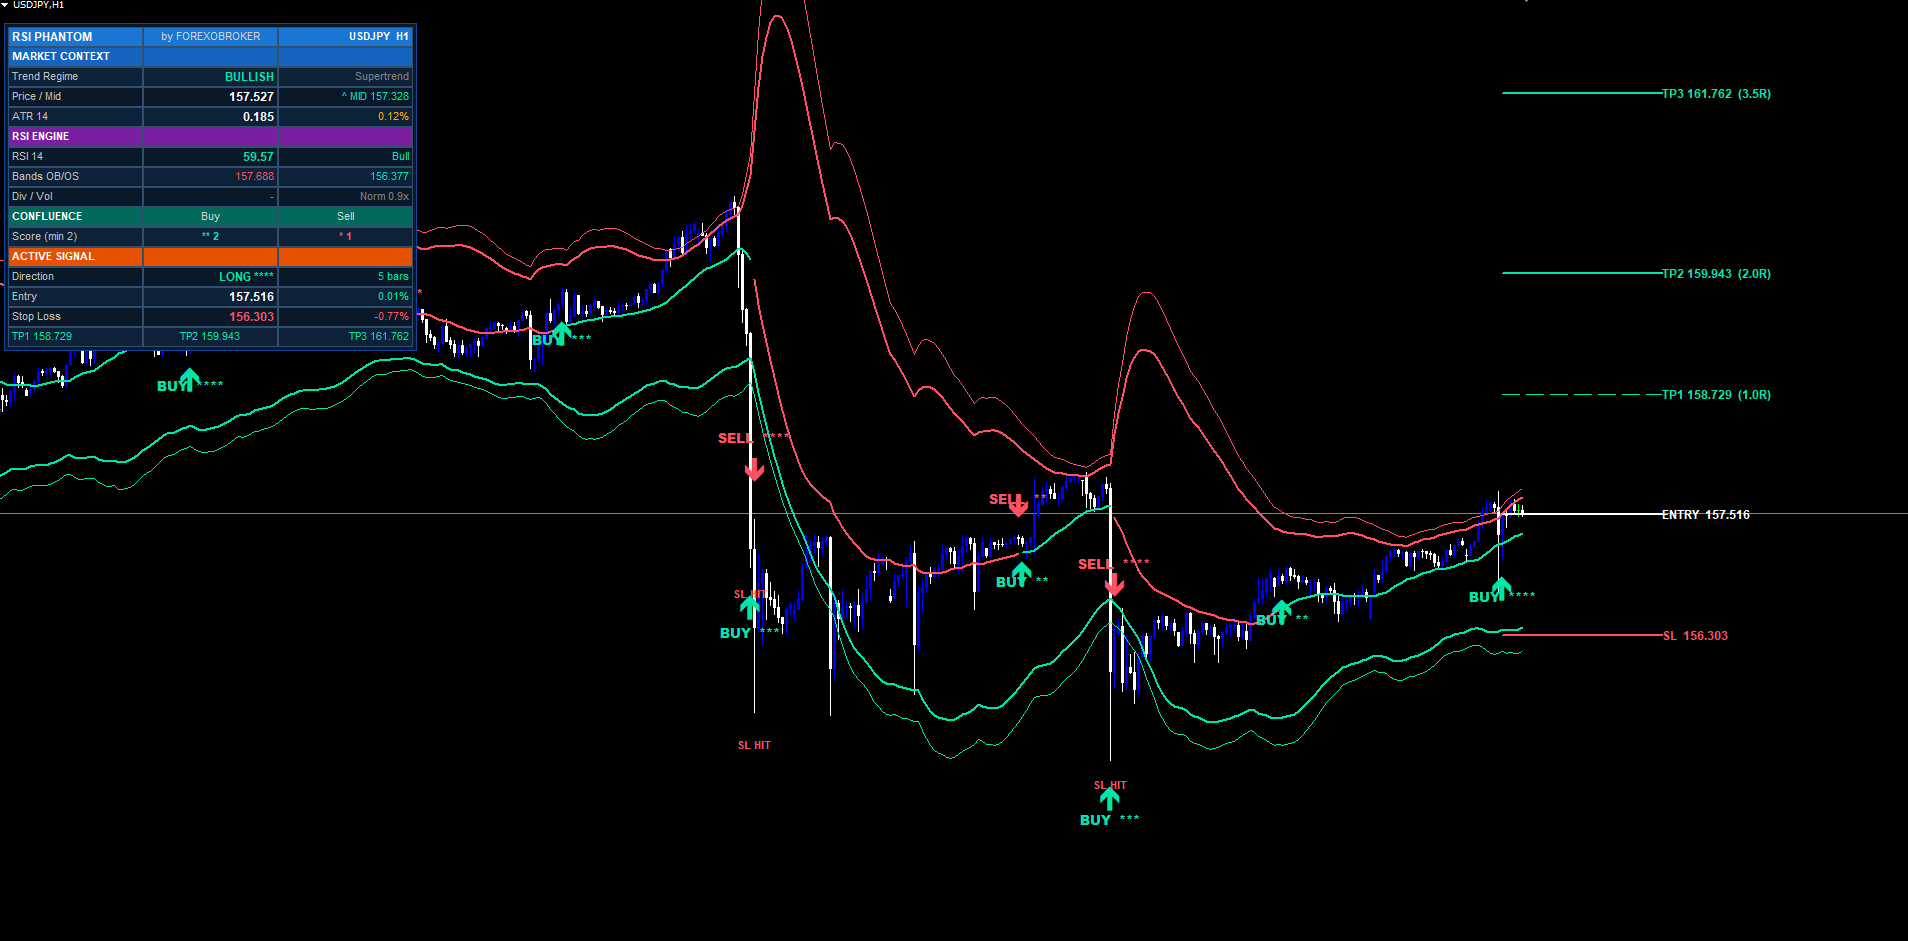
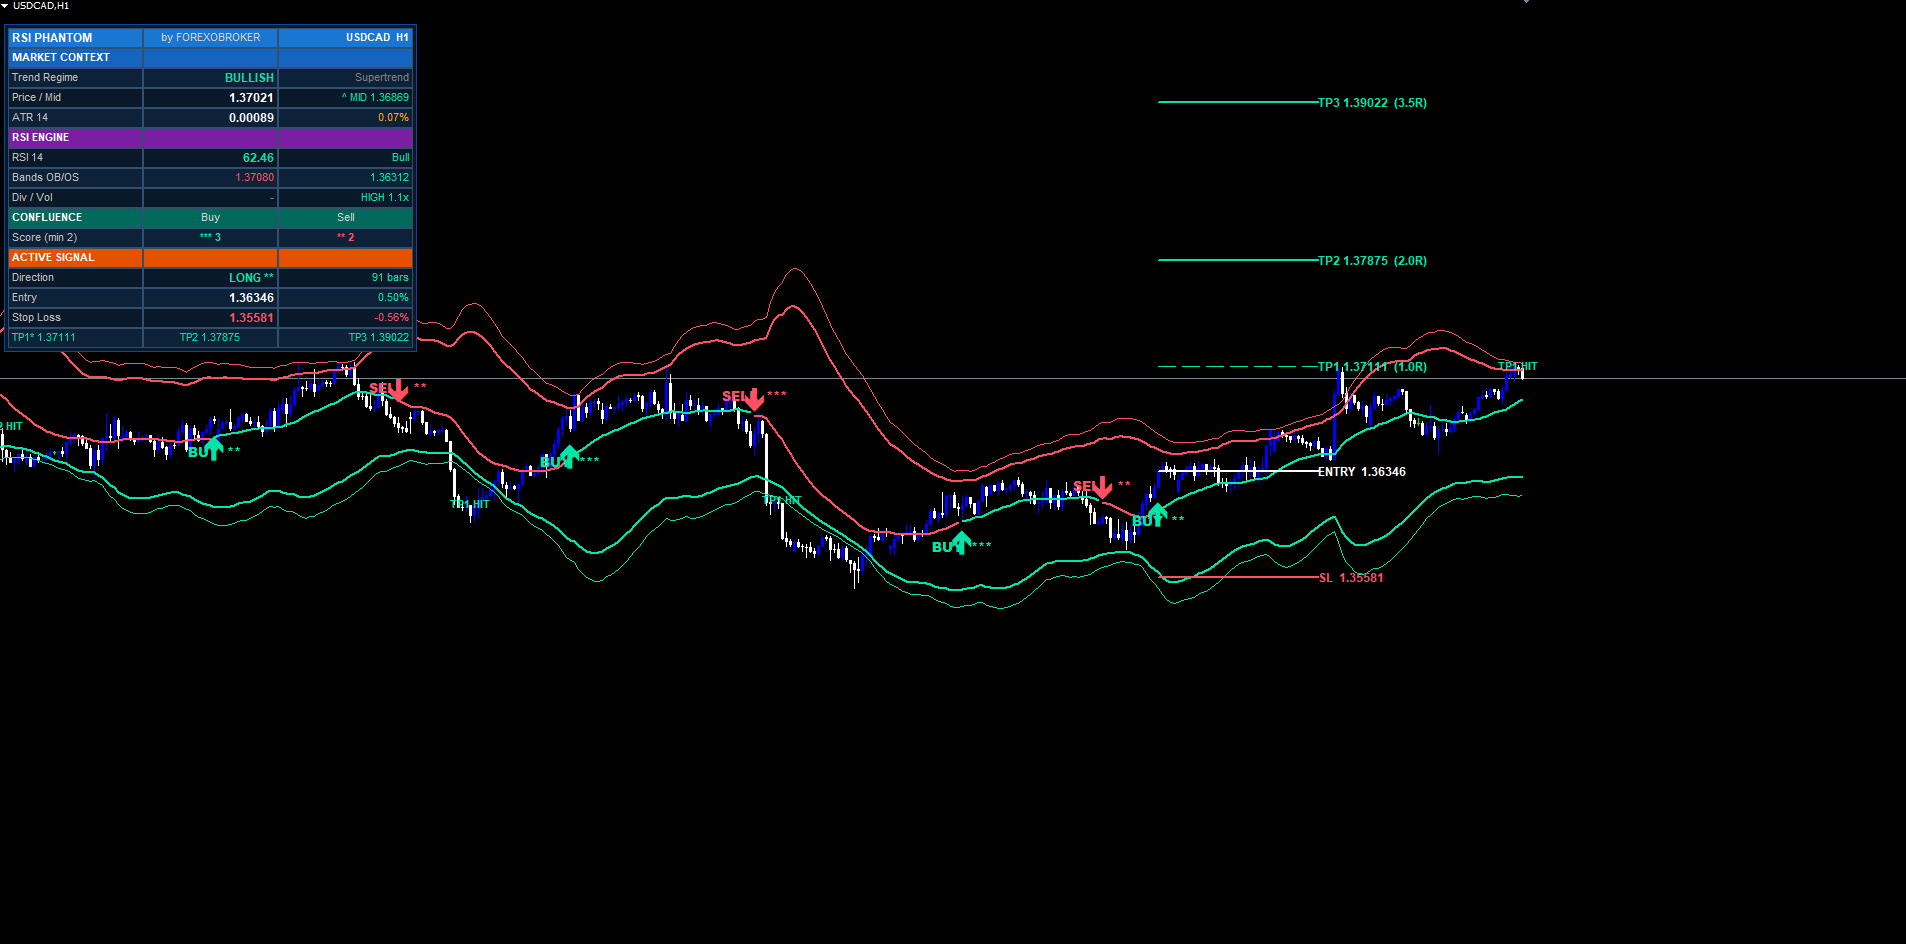
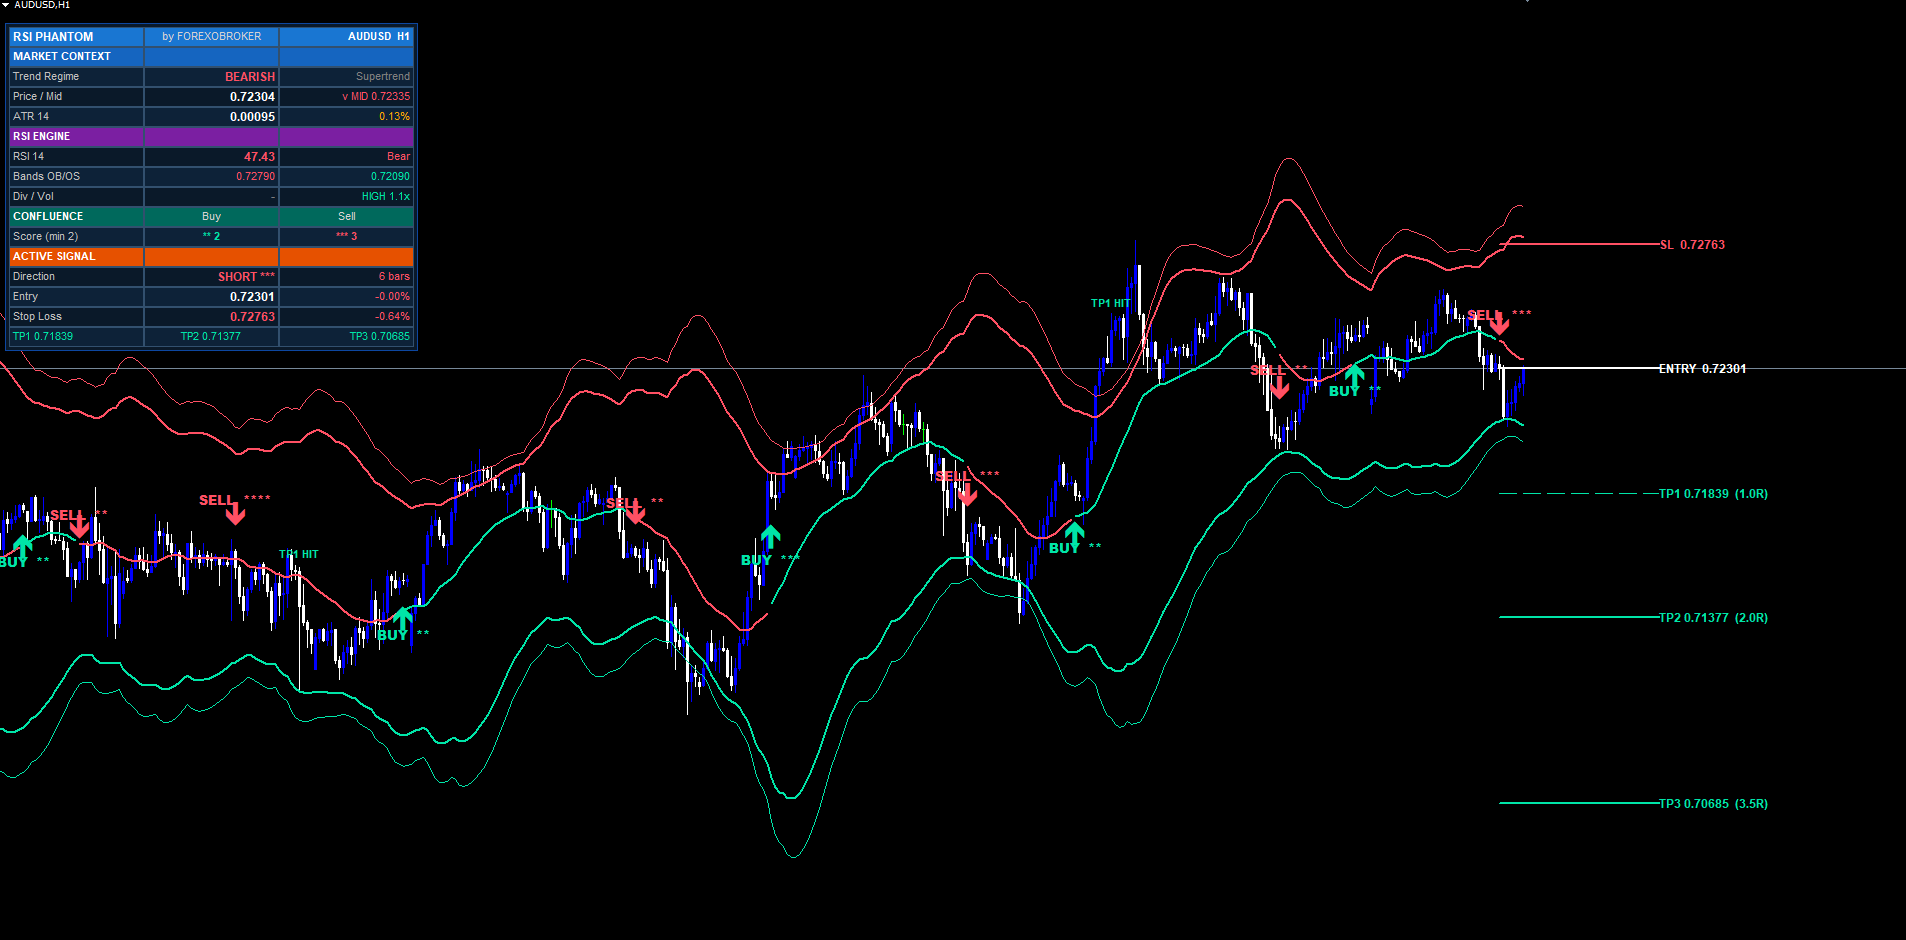
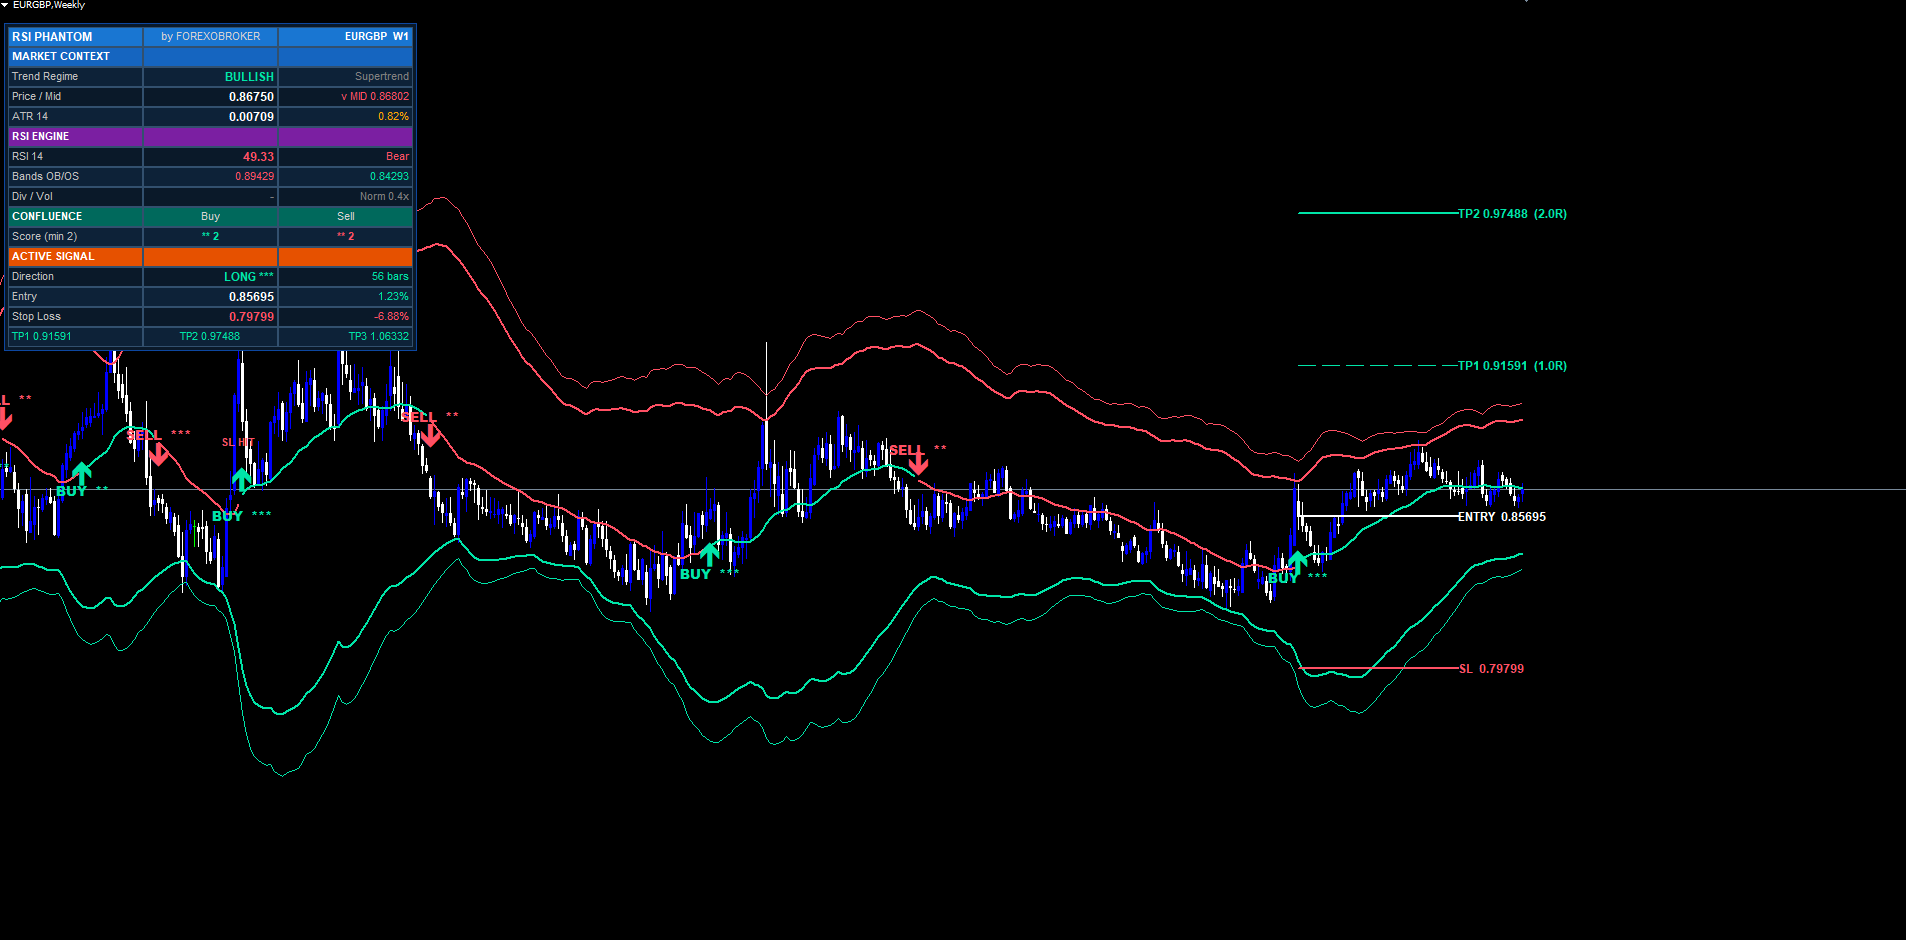
Each signal label on the chart is suffixed with star indicators showing the score: BUY **** for a 4-of-5 setup, SELL *** for a 3-of-5 setup, and so on. Hover the signal label and a tooltip shows the entry price, SL, all three TPs, and the precise confluence count.
The same scoring is shown live on the dashboard in real time so you can watch confluence build as bars print, even before a signal triggers. Often you will see a 3-of-5 score build to 4-of-5 in the last 30 seconds of a bar, then trigger the signal at close.
RSI Divergence Detector
The divergence module implements classic regular divergence — the most reliable form for reversal trading. Hidden divergence (the continuation variant) is intentionally not implemented because it produces noisier signals on the timeframes most retail traders work on.
The detection works as follows. On every bar, the indicator computes the RSI value (separately from the price-level engine, using the standard 0–100 oscillator). It then runs pivot detection on the RSI line, looking for pivot lows and pivot highs with a configurable left-side lookback (default 5 bars) and a fixed 1-bar right-side lookback. The right-side lookback of 1 means a pivot is confirmed one bar after it forms — this is the fastest confirmation possible without repainting.
For bullish divergence: a pivot low is confirmed on the RSI line, the indicator then walks backwards to find the previous pivot low (between 5 and 60 bars ago by default), compares the two pivots, and confirms divergence if (a) the current RSI pivot is higher than the previous one, AND (b) the corresponding price low is lower than the previous one. In other words: price made a lower low, but RSI made a higher low. The classic bullish reversal pattern.
The bearish case is symmetric: price prints a higher high while RSI prints a lower high. The detector marks confirmed divergences with triangle characters on the chart at the pivot bar (offset back by 1 to land at the actual pivot position).
Confirmed divergences feed into the confluence engine as the fourth scoring layer. They also have their own dedicated alert types (Bullish Divergence Detected, Bearish Divergence Detected) for traders who want pure divergence alerts independent of the full signal pipeline.
A practical note: divergence works best on H1 and higher timeframes. On M5 and below, RSI pivots form too frequently to produce meaningful divergence — most of what looks like divergence on M1 is just noise. If you trade scalping setups, consider disabling the divergence-counts-toward-confluence input and rely on the other four layers instead.
ATR-Based Stop Loss — Three Modes
When a signal fires, the indicator must place a stop loss before computing take-profit targets. Reverse RSI Phantom offers three SL computation modes selectable from the inputs dropdown.
Mode 1 — ATR + Band (default). Compute two candidate stop prices: a pure-ATR stop at entry minus ATR × multiplier, and a band-anchored stop at the oversold band price minus 0.25 × ATR (for buys; symmetric for sells). Pick the tighter of the two — that is, for buys, the higher of the two prices (closer to entry), giving the smaller risk. This mode produces the most aggressive risk-reward while still respecting market structure (the band).
Mode 2 — Pure ATR. Simply entry minus (ATR × multiplier) for buys, or plus for sells. The simplest mode and the most predictable in volatility terms. SL distance is always exactly ATR × multiplier pips/points away from entry.
Mode 3 — Recent Swing. Walk backwards 10 bars from entry, find the lowest low (for buys) or highest high (for sells), and place the SL just past it (with a 0.25 × ATR cushion). This mode hugs market structure most tightly and tends to produce wider stops on high-volatility bars but tighter stops in low-volatility sideways markets.
The ATR length and multiplier are both configurable. Defaults are 14-period ATR with a 1.5× multiplier, which produces SL distances comparable to most popular swing-trading setups.
Once the SL price is known, the indicator computes the trade's risk as risk = max(|entry - SL|, point × 10) . The minimum is enforced to prevent degenerate cases where the SL ends up almost on top of entry (which can happen briefly on extreme volatility spikes). This risk value is the unit used for all three take-profit calculations in the next section.
Three Take-Profit Levels at R-Multiples
Once the SL is placed, the three take-profit targets are computed as risk-reward multiples of the SL distance:
TP1 = entry + risk × InpRRTP1 (default 1.R) TP2 = entry + risk × InpRRTP2 (default 2.R) TP3 = entry + risk × InpRRTP3 (default 3.R)
For buys, the targets are above entry. For sells, the formula is symmetric and targets are below entry. Each multiple is configurable. The defaults of 1R / 2R / 3.5R are calibrated to give traders a partial-take-profit ladder: TP1 at 1R covers half the risk and lets you move the stop to breakeven; TP2 at 2R is the workhorse target where the bulk of profit is captured; TP3 at 3.5R is the runner that catches the rare extended moves.
Each target is drawn on the chart as a horizontal trend line (no ray) extending forward from the signal bar by InpExtendBars bars (default 40). Each line has a price label on the right edge showing the exact price and the R-multiple in parentheses, like TP2 1.07845 (2.0R) . The SL line is dashed red, TP1 is dashed mint with thinner width, TP2 is dashed mint with full width, and TP3 is dotted mint — visual differentiation so you can read the chart at a glance.
The indicator also tracks live hit detection. After a signal opens, on every subsequent bar the indicator checks whether high (for buys) or low (for sells) crossed each target price. When a target is hit, a small TP1 HIT / TP2 HIT / TP3 HIT label is dropped on the bar, the dashboard updates the corresponding row with a checkmark, and an optional alert fires. The same applies to SL hits, which close the trade in the indicator's internal accounting and clean up the level lines.
A trade is considered closed when either SL is hit or TP3 is hit (whichever happens first). The performance counters in the dashboard track wins/losses based on this rule, with a refinement: if TP1 was hit before SL is hit, the trade counts as a win (because the trader could have moved stop to breakeven). This matches how most discretionary risk-management systems actually work.
On-Chart Visuals — BUY/SELL Labels
When a signal triggers, two on-chart elements are drawn at the signal bar: an arrow and a text label.
The arrow is a Wingdings character (up arrow code 233 for buys, down arrow code 234 for sells) placed below the bar's low (for buys) or above the bar's high (for sells), offset by 0.6 × ATR. The arrow color matches the trade direction — mint for buys, red for sells. Arrow size is fixed for visual consistency across timeframes.
The text label is placed further away from the candle (offset 1.4 × ATR) and reads BUY **** or SELL *** , with the star count matching the confluence score. Text is bold for readability and uses ASCII characters only (no Unicode glyphs) for compatibility with every MetaTrader font and locale.
The arrow label also carries a tooltip. Hover the signal and a popup shows the full trade specification: entry price, SL price, all three TP prices, and the confluence score broken down by which of the five layers passed. The tooltip is one of the most underrated features of the indicator — it makes post-hoc trade journaling trivial because everything you need to log is right there.
Signal labels and arrows are drawn at signal time and never modified afterward. They are not deleted when the trade closes (unlike the SL/TP lines, which are removed at trade close to keep the chart uncluttered). This means historical signals stay permanently visible on the chart, letting you scroll back and review every trade the system would have taken.
Trend shift triangles (small) are drawn at every Supertrend regime change, even when no full signal triggers — these give a visual cue of momentum shifts that did not score high enough for a full signal. Divergence triangles (smaller) mark every confirmed regular divergence pivot, regardless of whether the divergence fed into a full signal.
Multi-Section Dashboard
The dashboard is a pixel-anchored widget rendered using OBJ_RECTANGLE_LABEL backgrounds and OBJ_LABEL text. It uses the chart's coordinate system so it stays anchored to a fixed corner regardless of scroll, zoom, or symbol change.
The dashboard is organized into five sections (16 rows total):
Row 0 — Header. Brand title on the left, "by FOREXOBROKER" centered, and the current symbol + timeframe on the right.
Market Context section (rows 1–4). Trend regime (BULLISH / BEARISH / NEUTRAL) with color matching the regime. Price-vs-Mid showing current close and whether it is above (^) or below (v) the midline. ATR value with ATR as a percentage of current price (useful for cross-symbol volatility comparison).
RSI Engine section (rows 5–8). RSI value with descriptive state (OB / OS / Bull / Bear). OB and OS band price values displayed in their respective colors. Divergence flag (BULL / BEAR / -) with the last 8-bar volume burst status and the volume ratio (current / SMA20).
Confluence section (rows 9–10). Live buy score and live sell score, both with star renderings, computed in real time on every tick so you can watch confluence build. The score row also shows the minimum-required threshold in parentheses next to the label.
Active Signal section (rows 11–15). Direction (LONG / SHORT / WAITING) with stars showing the score of the active trade. Entry price with live percentage P&L from entry. SL price with percentage distance from entry. TP1, TP2, TP3 prices on a single row (one cell each), each with a * suffix when that target has been hit.
The dashboard supports six corner positions (TR / TL / BR / BL / MR / ML) plus X and Y pixel offsets so you can nudge it to exactly where it fits best on your chart. Column width is configurable (default 135 pixels) and font size scales from 6 to 24. Everything is laid out so the dashboard reads cleanly at any size.
The dashboard redraws on every tick via OnTimer in the MT5 build and on every OnCalculate call in the MT4 build, plus on every CHARTEVENT_CHART_CHANGE so it re-anchors correctly when you resize the terminal window.
Full Alert Package
Reverse RSI Phantom ships with 13 distinct alert types delivered via three channels: MetaTrader pop-up dialogs, push notifications to the mobile app, and email. Each channel can be enabled or disabled independently via inputs.
Alert types:
- BUY signal fired
- SELL signal fired
- Any signal (combined BUY or SELL)
- Bullish trend shift (Supertrend flipped to bullish)
- Bearish trend shift (Supertrend flipped to bearish)
- Bullish divergence detected
- Bearish divergence detected
- Price entered upper band (close crossed above OB band)
- Price entered lower band (close crossed below OS band)
- TP1 hit
- TP2 hit
- TP3 hit
- SL hit
Each alert message includes the indicator name, the symbol, the timeframe period, and the relevant price level. For signal alerts, the message also includes entry, SL, TP1/TP2/TP3 prices, and the confluence score. Example:
Reverse RSI Phantom: BUY on EURUSD H1 @ 1.07842 | SL 1.07520 | TP1 1.08164 | TP2 1.08486 | TP3 1.08967 | Score 4/5
Alerts use ASCII text only — no Unicode glyphs that might render as question marks on certain platforms. The alert system is gated by a non-repaint silence flag during the initial historical replay so attaching the indicator to a chart does not flood your terminal with hundreds of historical alerts. Only fresh signals fired on new bars after attachment will alert.
Per-bar deduplication is built in: the same bar cannot trigger the same alert twice, even if the indicator recomputes signals on subsequent ticks before bar close.
Non-Repaint Guarantee
Every signal, every level line, every dashboard value is computed from confirmed, closed-bar data only. Signals at bar N never change after bar N+1 opens. The historical replay drawn at indicator load is identical to the signals that fired in real time.
The non-repaint guarantee is achieved through three architectural choices:
- All signal detection happens at shift >= 1 (closed bars), never at shift 0 (the actively forming bar).
- The Supertrend state machine uses previous-bar persistence — once a bar closes, its Supertrend direction is immutable.
- The pivot detector uses a 1-bar right-side lookback, meaning a pivot at bar N is confirmed at bar N+1's open and never revisited.
Per-bar deduplication via object-name lookup prevents the same signal from being drawn twice if the indicator recomputes the bar (which can happen on first-tick-of-bar). The dedup check looks for the existence of the signal arrow object at the bar's timestamp; if it exists, no new signal is drawn.
This non-repaint behavior is what makes the indicator viable for systematic backtesting and live deployment alongside expert advisors. Forward-test results match historical replay results.
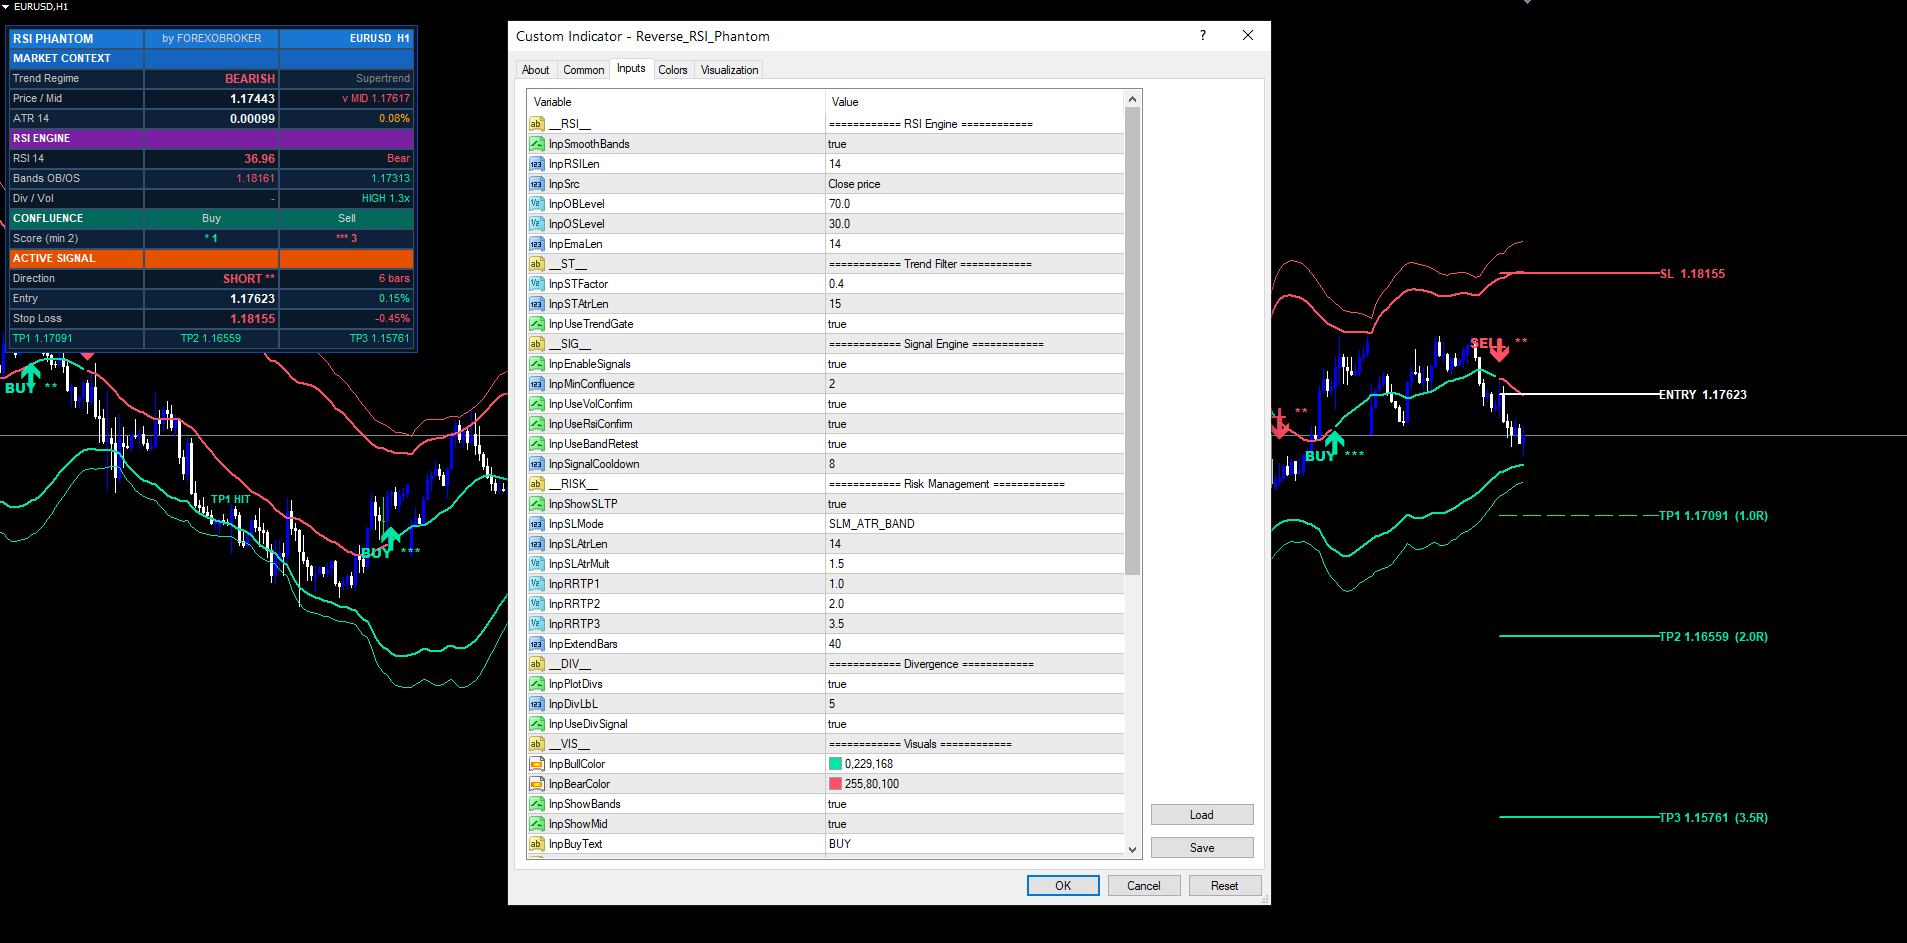
Input Parameter Reference
The indicator exposes roughly 35 inputs grouped into nine sections. Default values are tuned for swing trading on H1 majors but every value is adjustable.
RSI Engine — InpSmoothBands (true), InpRSILen (14), InpSrc (close), InpOBLevel (70), InpOSLevel (30), InpEmaLen (14).
Trend Filter — InpSTFactor (0.4), InpSTAtrLen (15), InpUseTrendGate (true).
Signal Engine — InpEnableSignals (true), InpMinConfluence (2), InpUseVolConfirm (true), InpUseRsiConfirm (true), InpUseBandRetest (true), InpSignalCooldown (8).
Risk Management — InpShowSLTP (true), InpSLMode (ATR + Band), InpSLAtrLen (14), InpSLAtrMult (1.5), InpRRTP1 (1.0), InpRRTP2 (2.0), InpRRTP3 (3.5), InpExtendBars (40).
Divergence — InpPlotDivs (true), InpDivLbL (5), InpUseDivSignal (true).
Visuals — InpBullColor (mint), InpBearColor (red), InpShowBands (true), InpShowMid (true), InpBuyText ("BUY"), InpSellText ("SELL").
Dashboard — InpShowDash (true), InpDashPos (Top Right), InpDashFontSize (8), InpDashMargin (10), InpDashOffsetX (0), InpDashOffsetY (20), InpDashColumnWidth (135).
Alerts — InpAlertPopup (true), InpAlertPush (false), InpAlertEmail (false), InpAlertBuySell (true), InpAlertTPSL (true), InpAlertTrendShift (false), InpAlertDivergence (false), InpAlertBandEnter (false).
Misc — InpObjPrefix ("RRP_"), InpMaxBars (3000).
Every input has range validation in OnInit. Values outside the allowed range cause the indicator to fail initialization with INIT_PARAMETERS_INCORRECT , preventing accidental misuse.
For a complete description of each input including recommended values for different markets and timeframes, see the user manual.
Closing
Reverse RSI Phantom is a complete reversal-and-continuation trading system built around one core insight: that the most important RSI levels — overbought, oversold, and the equilibrium midline — belong on price, not in a separate oscillator window. By inverting the RSI equation, the indicator computes those levels as exact price values and plots them directly on the chart. On top of that engine sits a complete confluence scoring system, automatic risk management with SL and three TP targets, a non-repainting signal pipeline, and a multi-section dashboard.
Download the indicator:
- MetaTrader 5: Reverse RSI Phantom MT5
- MetaTrader 4: Reverse RSI Phantom MT4
CONTACT & SUPPORT
- Email: info@forexobroker.com
- Questions: Use the Comments section on the product page or send a private message
- Bug Reports: Please include your broker name, account type, and a screenshot
-
✅ All MQL Tools: https://www.mql5.com/en/users/forexobroker/ ✅
--------------------------------------------------------------------------------------------------------------
🏦 **Broker I use**: https://icmarkets.com/?camp=55869
🏦 **Broker For EU Traders I use 1**: https://www.ictrading.com?camp=91414
🏦 **Broker I use 2**: https://one.exnessonelink.com/boarding/sign-up/a/c_thuv62ocfq
💻 **VPS**: https://chocoping.com/processing/aff.php?aff=738
💼 **Companies I use for getting funded**:
Fundednext: https://fundednext.com/?fpr=kestutis39
The5ers: https://www.the5ers.com/?afmc=16kl
FTMO: https://trader.ftmo.com/?affiliates=nRAyOhmFRnEnFdOpdLeh
Risk Disclaimer
Trading foreign exchange and CFDs on margin carries a high level of risk and may not be suitable for all investors. You may sustain a loss exceeding your initial investment. Trend Quorum is a technical analysis tool and does not guarantee profitable trades. Past performance is not indicative of future results. The authors accept no liability for any loss arising from use of the indicator. By using Trend Quorum you acknowledge sole responsibility for your trading decisions.


