

Introduction
The Reverse RSI Phantom indicator is a non-repainting reversal-and-continuation system for MetaTrader 4 and MetaTrader 5 that plots overbought, oversold, and midline RSI levels as actual price bands on your main chart. On top of that price-level engine it adds a five-layer confluence scoring system, a Supertrend trend filter applied to the RSI midline, regular RSI divergence detection, ATR-based stop loss with three computation modes, three take-profit targets at configurable risk-reward multiples, a multi-section dashboard, and a thirteen-event alert package.
This manual walks you through installation, attachment, every input group, reading the chart and dashboard, configuring alerts, three preset strategy templates, and troubleshooting. If you would like a deeper theoretical understanding of how the price-level inversion math works.
Download the indicator:
- MetaTrader 5: Reverse RSI Phantom MT5
- MetaTrader 4: Reverse RSI Phantom MT4
TIP: This indicator is designed for traders who want a structured, rules-based RSI-driven trading system. It works on any symbol and any timeframe available in MetaTrader.
Installation Guide
Reverse RSI Phantom is distributed through the MQL5.com Market. Installation is automatic.
Step 1 — Purchase and Auto-Install
- Purchase the indicator from the MQL5 Market product page
- The indicator installs automatically into your MetaTrader terminal
- Open MetaTrader and press Ctrl+N to open the Navigator panel
- Expand Indicators > Market
- Find Reverse RSI Phantom in the list
Step 2 — Attach to a Chart
- Drag the indicator from the Navigator onto any chart
- The input dialog opens
- Review or adjust the inputs (defaults are tuned for H1 swing trading on majors)
- Click OK to attach
IMPORTANT: Do not manually copy files to the data folder. The MQL5 Market handles all file placement and updates automatically.
If you do not see the indicator in your Navigator after purchase, restart MetaTrader. If it still does not appear, check View > Toolbox > Journal for any error messages and verify your MQL5.com account is logged in via Tools > Options > Community.
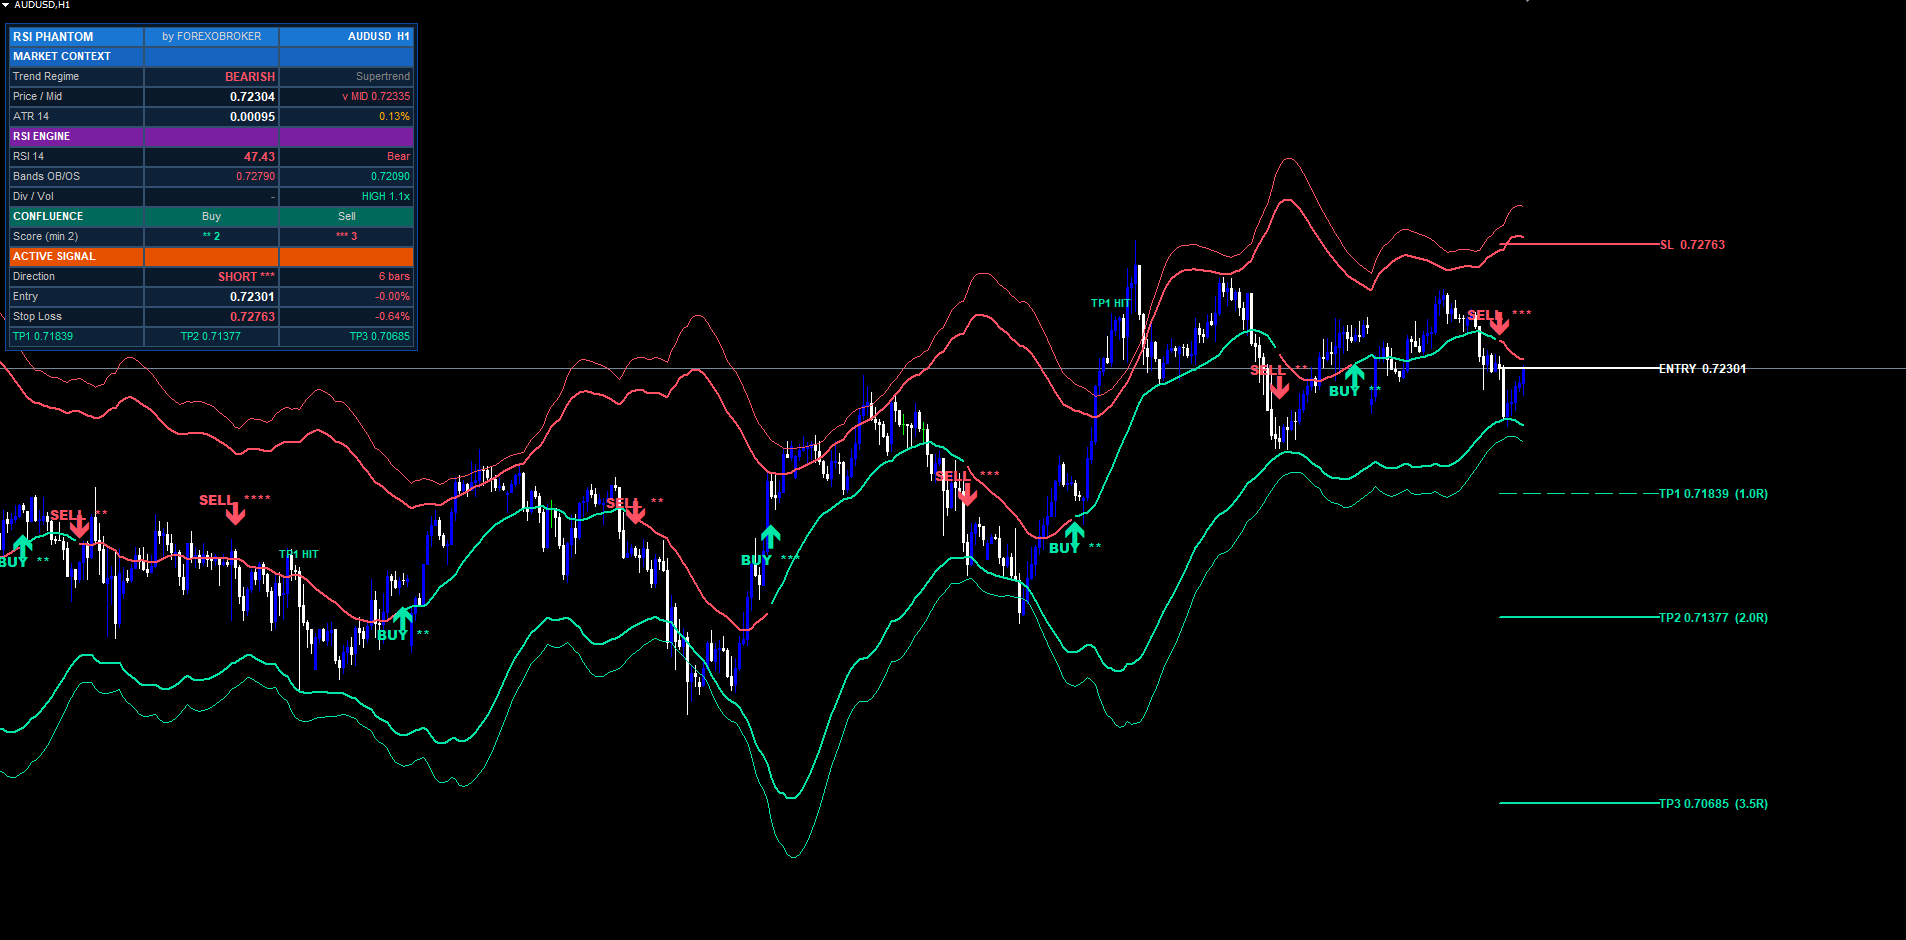
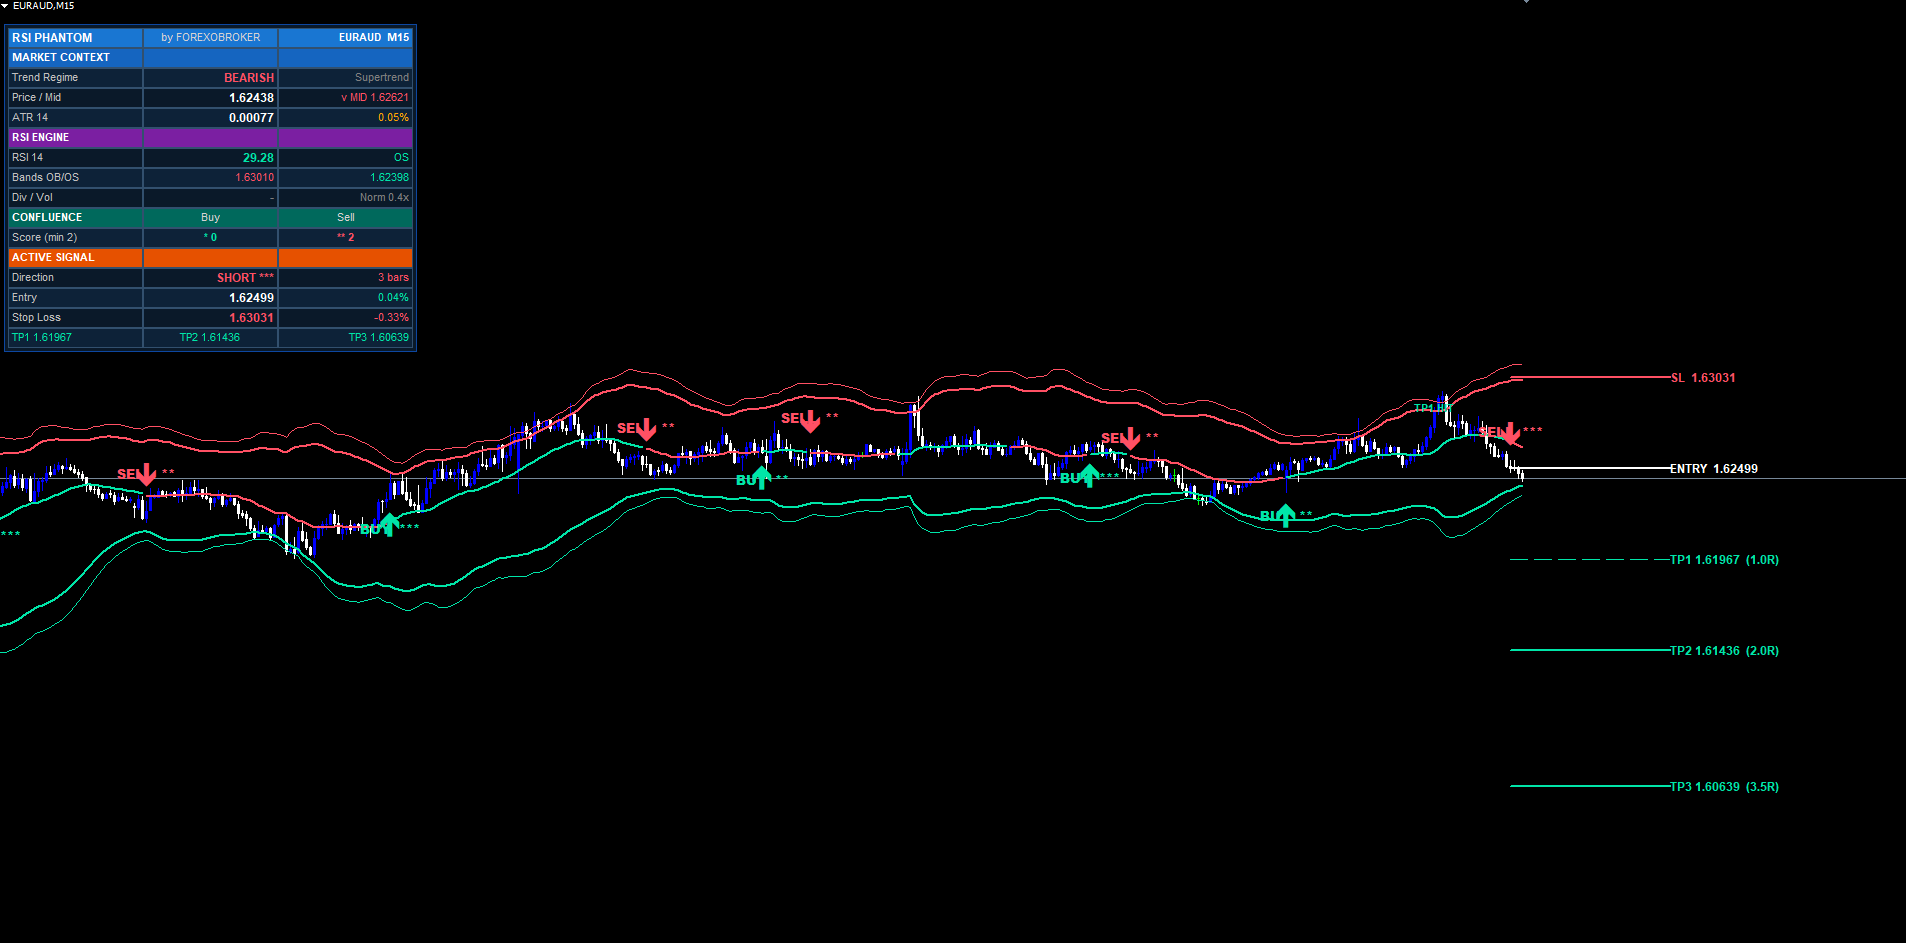
First Impression — What You See on the Chart
Once attached with default inputs, the indicator immediately draws several elements:
- Two upper bands (mint colored): the inner is the OB price level (price at which RSI = 70); the outer is a 25% extension above it for context
- Two lower bands (red colored): the inner is the OS price level (RSI = 30); the outer is a 25% extension below
- A colored midline running through the chart: mint when Supertrend regime is bullish, red when bearish
- Historical BUY/SELL labels at every confirmed signal in the visible history, each with star indicators showing the confluence score
- Trend shift triangles at every Supertrend direction change
- Divergence triangles at every confirmed regular RSI divergence pivot
- Dashboard in the top-right corner showing live state across five sections
If a trade is currently active (i.e., the last signal has not yet hit SL or TP3), the dashboard will also show the entry, SL, TP1, TP2, and TP3 prices, and four horizontal lines will be drawn on the chart at those prices with right-side price labels.
If the chart looks too cluttered, scroll the inputs to the Visuals group and toggle off the bands ( InpShowBands ), the midline ( InpShowMid ), or the dashboard ( InpShowDash ) individually.
Reading the Signal Labels
A signal label combines two elements:
- A Wingdings arrow placed below the bar low (for BUY) or above the bar high (for SELL), colored mint for buys and red for sells
- A bold text label further from the candle showing BUY **** or SELL *** with the star count matching the confluence score (0–5 stars)
Hover the signal label and a tooltip appears showing the full trade specification: entry price, SL, all three TP prices, and the confluence breakdown.
Star count interpretation:
- * — 1 of 5 layers passed (only trend or only one filter)
- ** — 2 of 5 (the default minimum threshold)
- *** — 3 of 5 (a strong setup)
- **** — 4 of 5 (very strong)
- ***** — 5 of 5 (extremely rare — every filter aligned)
Higher star counts indicate higher historical signal quality, but they also fire less frequently. The optimal star count for your trading style is something you find through walk-forward testing.
Input Parameter Groups
The input panel is organized into nine sections.
RSI Engine
Controls the inverted-RSI calculation:
- InpSmoothBands (default true) — apply a 14-period EMA to the bands to dampen jitter
- InpRSILen (14) — the RSI period (Wilder's RMA length)
- InpSrc (close) — applied price for RSI input
- InpOBLevel (70) — RSI level corresponding to the upper price band
- InpOSLevel (30) — RSI level corresponding to the lower price band
- InpEmaLen (14) — EMA smoothing length applied to the bands
Trend Filter
Controls the Supertrend applied to the midline:
- InpSTFactor (0.4) — ATR multiplier for the Supertrend bands. Lower values produce more flips; higher values flip less often
- InpSTAtrLen (15) — ATR period for the Supertrend
- InpUseTrendGate (true) — when enabled, signals only fire in matching regime (bullish for buys, bearish for sells)
Signal Engine
The confluence engine and cooldown:
- InpEnableSignals (true) — master on/off switch for signal generation
- InpMinConfluence (2) — minimum confluence score required to draw a signal (1–5)
- InpUseVolConfirm (true) — require volume burst as a confluence layer
- InpUseRsiConfirm (true) — require RSI crossover/under as a confluence layer
- InpUseBandRetest (true) — require recent band touch as a confluence layer
- InpSignalCooldown (8) — minimum bars between same-direction signals
Risk Management
SL/TP configuration:
- InpShowSLTP (true) — draw SL and TP lines on chart
- InpSLMode (ATR + Band) — SL computation: ATR + Band, Pure ATR, or Recent Swing
- InpSLAtrLen (14) — ATR period used for SL distance
- InpSLAtrMult (1.5) — ATR multiplier for the stop-loss distance
- InpRRTP1 , InpRRTP2 , InpRRTP3 (1.0, 2.0, 3.5) — risk-reward multiples for the three TP targets
- InpExtendBars (40) — how many bars forward to draw the SL/TP lines
Divergence
- InpPlotDivs (true) — draw divergence triangles on chart
- InpDivLbL (5) — left-side pivot lookback for divergence detection
- InpUseDivSignal (true) — divergence counts as a confluence layer
Visuals
- InpBullColor / InpBearColor — colors for bullish and bearish elements
- InpShowBands (true) — draw the four band lines
- InpShowMid (true) — draw the colored midline
- InpBuyText ("BUY") / InpSellText ("SELL") — text shown in signal labels
Dashboard
- InpShowDash (true) — show the dashboard widget
- InpDashPos (Top Right) — corner anchor: TR, TL, BR, BL, MR, ML
- InpDashFontSize (8) — base font size
- InpDashMargin (10) — pixel distance from the chart edge
- InpDashOffsetX (0) — additional horizontal nudge (+ right, - left)
- InpDashOffsetY (20) — additional vertical nudge (+ down, - up)
- InpDashColumnWidth (135) — pixel width per column
Alerts
Three channels and seven event categories:
- InpAlertPopup (true) — show MetaTrader popup dialog
- InpAlertPush (false) — send push notification to mobile app
- InpAlertEmail (false) — send email
- InpAlertBuySell (true) — fire on BUY/SELL signals
- InpAlertTPSL (true) — fire on TP1/TP2/TP3/SL hits
- InpAlertTrendShift (false) — fire on Supertrend regime flips
- InpAlertDivergence (false) — fire on confirmed divergences
- InpAlertBandEnter (false) — fire when price crosses OB or OS bands
Misc
- InpObjPrefix ( RRP_ ) — prefix for all created chart objects
- InpMaxBars (3000) — maximum history bars to process
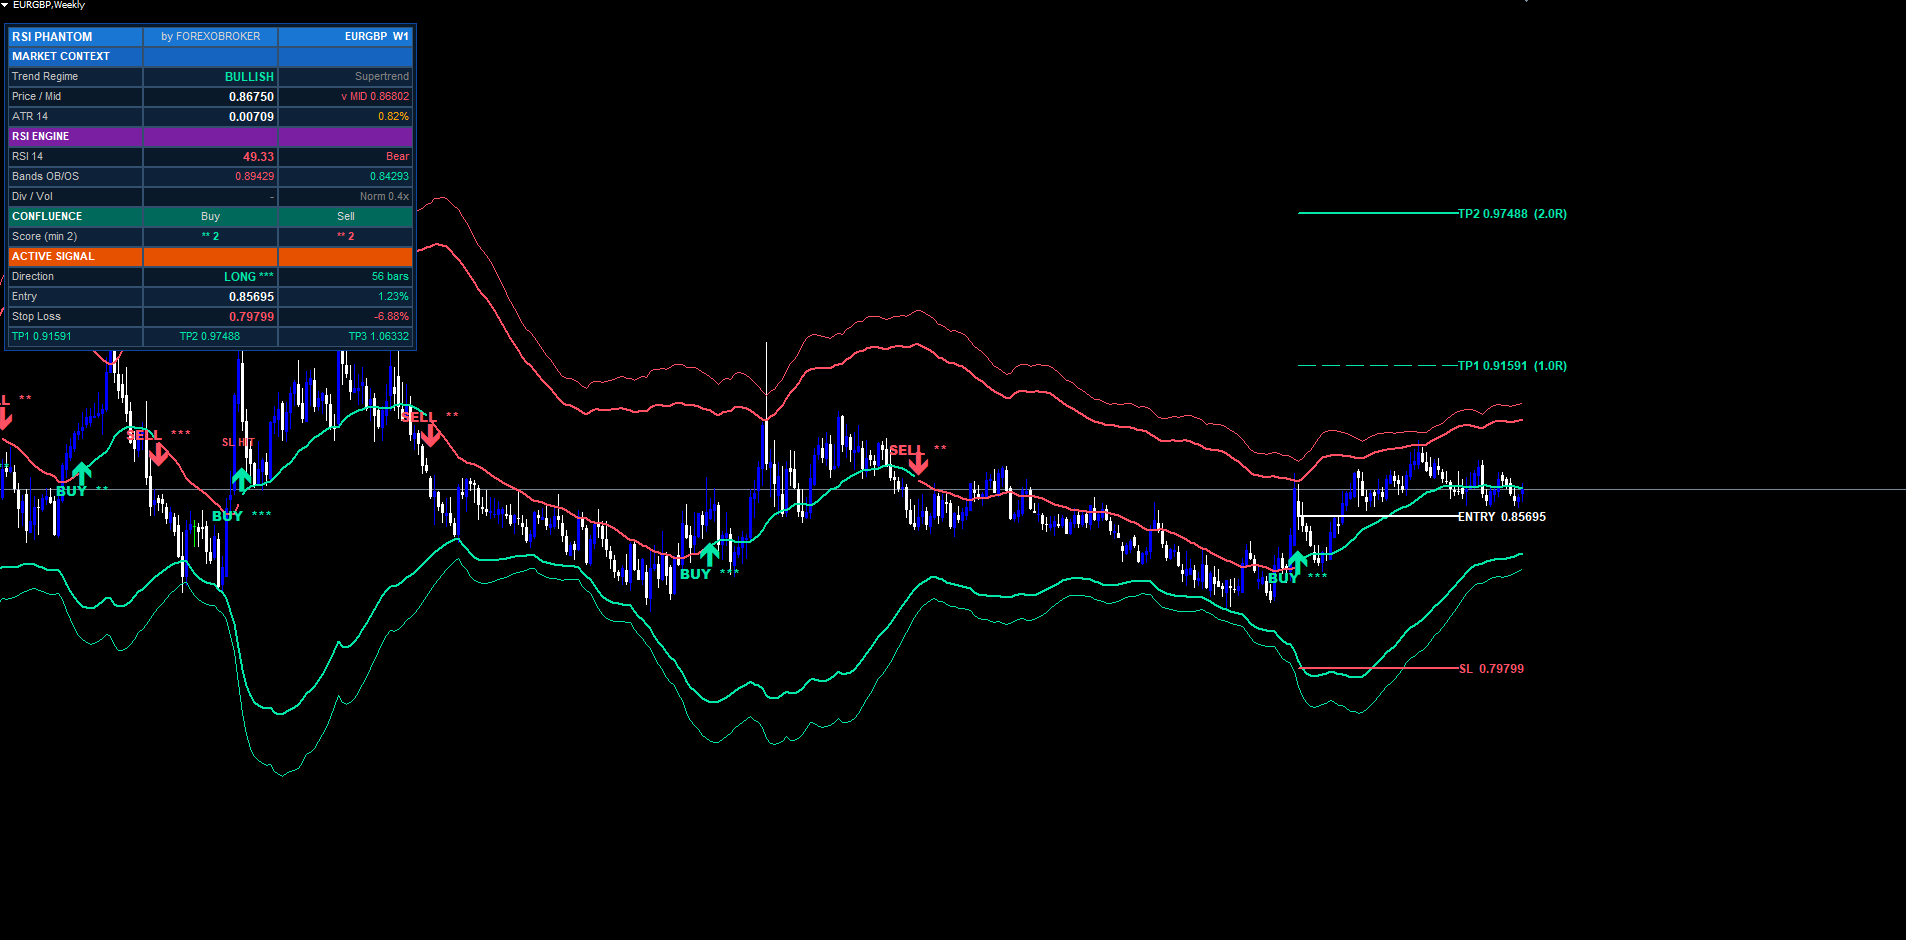
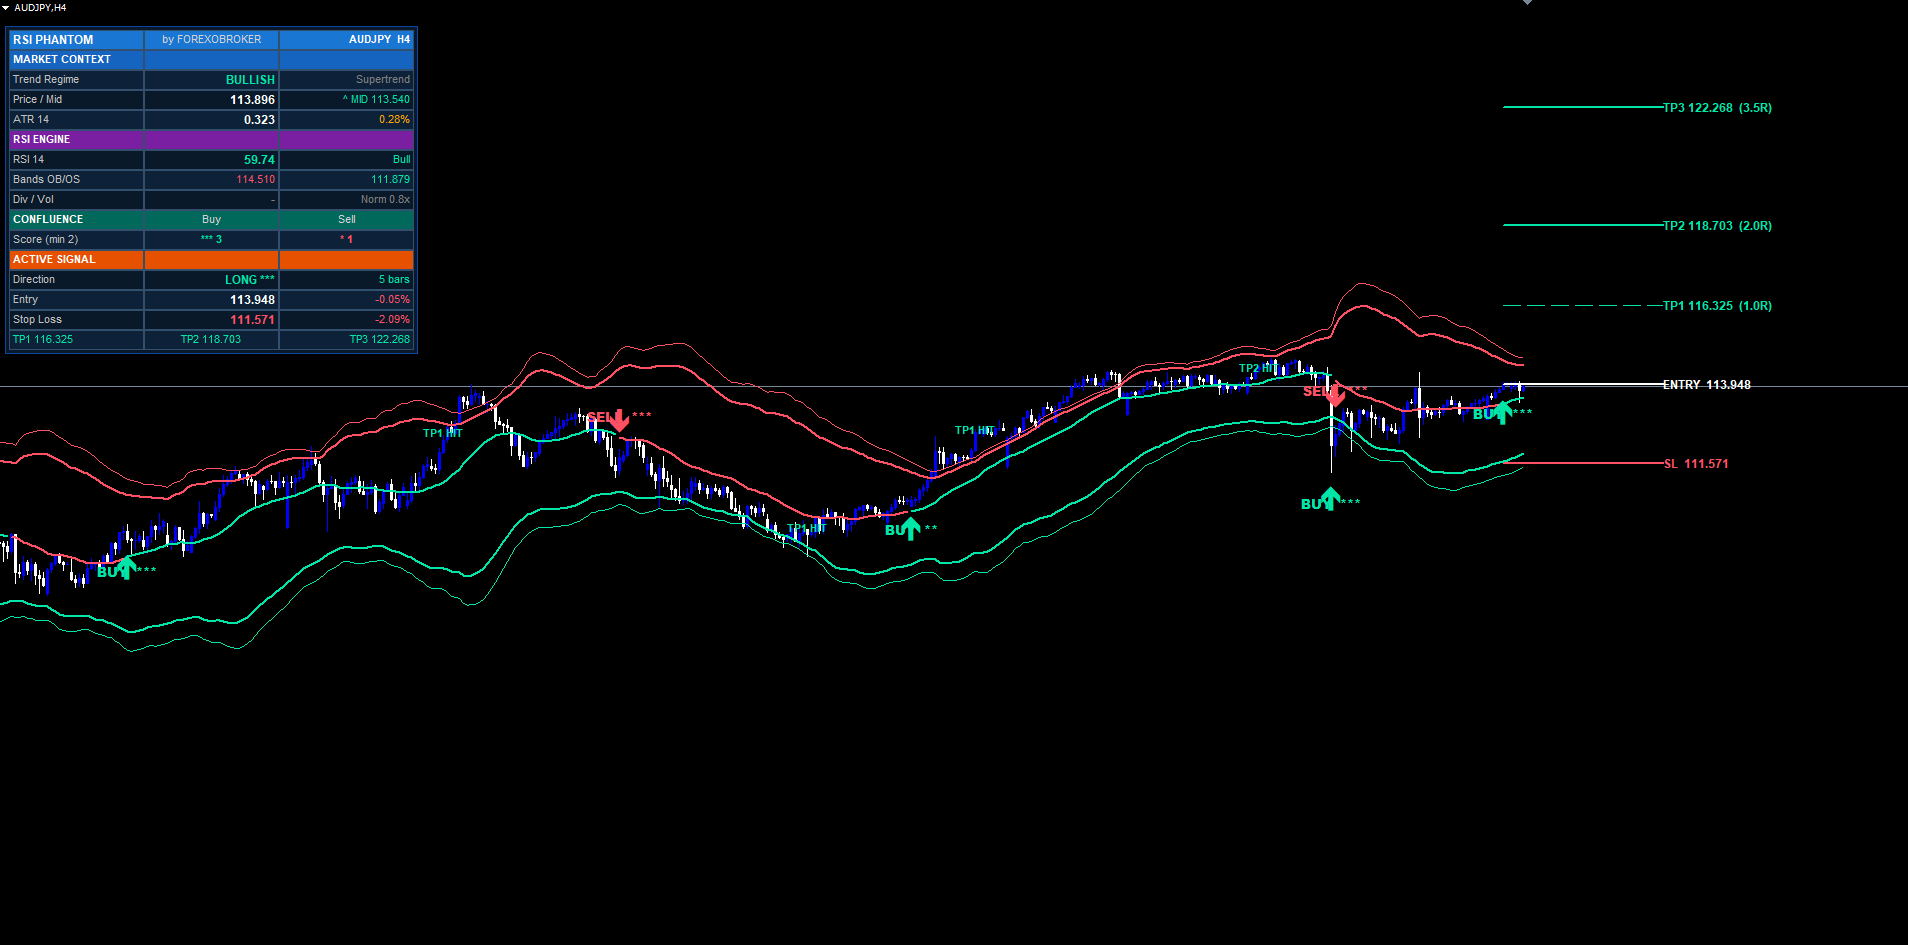
Understanding SL and TP Levels
When a signal fires, five horizontal lines are drawn on the chart from the signal bar extending forward by InpExtendBars bars:
- Entry line — solid white, 2px width
- SL line — dashed red, 2px width
- TP1 line — dashed mint, 1px width
- TP2 line — dashed mint, 2px width
- TP3 line — dotted mint, 2px width
Each line has a right-side text label showing the exact price and (for TP lines) the R-multiple in parentheses, like TP2 1.07845 (2.0R) .
When the price reaches a TP level, a small TP1 HIT / TP2 HIT / TP3 HIT label is dropped on the bar where it happened. The dashboard updates the matching row with a * suffix to mark the hit. If the price hits SL before any TP, an SL HIT label is dropped and the trade is closed in the indicator's accounting.
A trade is considered fully closed when either SL is hit or TP3 is hit. At that point, the entry, SL, TP1, TP2, TP3 lines and their right-side labels are removed from the chart to keep the view uncluttered. The signal arrow itself stays permanently visible.
The internal performance counter applies one refinement: if TP1 was hit before SL, the closed trade counts as a win (because a discretionary trader would have moved stop to breakeven after TP1). If SL hits before any TP, the trade counts as a loss. If TP3 hits without SL ever firing, the trade counts as a win.
Reading the Dashboard
The dashboard has 16 rows organized into five sections.
Header (row 0) — RSI PHANTOM brand title, by FOREXOBROKER subtitle, current symbol and timeframe.
Market Context (rows 1–4) — Section header "MARKET CONTEXT", then:
- Trend Regime — BULLISH / BEARISH / NEUTRAL (colored)
- Price / Mid — current close, with ^ MID or v MID indicating position relative to the midline
- ATR — value plus percentage of price (useful for cross-symbol volatility comparison)
RSI Engine (rows 5–8) — Section header "RSI ENGINE", then:
- RSI value with descriptive state (OB / OS / Bull / Bear)
- OB band price (red) and OS band price (mint) on a single row
- Divergence flag (BULL / BEAR / -) plus volume burst status (HIGH / Norm) and ratio
Confluence (rows 9–10) — Section header "CONFLUENCE", then:
- Live buy score (mint) and live sell score (red) updated on every tick, with star renderings, plus the minimum-required threshold shown in the row label
Active Signal (rows 11–15) — Section header "ACTIVE SIGNAL", then:
- Direction — LONG / SHORT / WAITING with stars and bars-ago
- Entry — entry price with live percentage P&L
- Stop Loss — SL price with percentage distance from entry
- TP1 / TP2 / TP3 on a single row (one cell each), each suffixed with * if hit
The dashboard updates on every tick. The Confluence section is particularly useful for anticipating signals — you can watch the score build as bars print and know when a signal is approaching.
To reposition the dashboard, change InpDashPos to one of the six corner options, then use InpDashOffsetX and InpDashOffsetY for pixel-level nudging. Default InpDashOffsetY = 20 keeps it below the top toolbar area on most chart layouts.
Configuring Alerts
Reverse RSI Phantom can deliver alerts via three independent channels:
Popup Alerts
The simplest channel. When enabled ( InpAlertPopup = true ), every triggered event produces a MetaTrader popup dialog with the full alert message. Popups are best for active sessions when you are at your computer.
Push Notifications to the MetaTrader Mobile App
For traders who want alerts on their phone:
- Install the MetaTrader mobile app on your phone (iOS or Android)
- Open the app and go to Settings > Chat and Messages
- Note your MetaQuotes ID (a number like 12345678 )
- In the desktop MetaTrader, go to Tools > Options > Notifications
- Tick Enable Push Notifications and paste your MetaQuotes ID
- In the indicator inputs, set InpAlertPush = true
The push channel delivers the same message text as popups, directly to your phone's lock screen.
Email Alerts
- In MetaTrader, go to Tools > Options > Email
- Tick Enable and configure your SMTP server, sender, recipient, and login credentials
- Click Test to confirm delivery
- In the indicator inputs, set InpAlertEmail = true
Email alerts are slower than popups and push (typically 5–30 seconds of latency due to SMTP) but are useful for archival and for integration with downstream automation (e.g., parsing alert emails into a trade journal).
Event Categories
Within those three channels, seven event categories can be toggled individually:
- InpAlertBuySell — BUY and SELL signal alerts (the main event)
- InpAlertTPSL — TP1, TP2, TP3, and SL hit alerts (for trade management)
- InpAlertTrendShift — Supertrend regime changes
- InpAlertDivergence — confirmed bullish/bearish divergences
- InpAlertBandEnter — price crossed above OB band or below OS band
A typical setup for an active trader: BuySell + TPSL enabled, others disabled. A typical setup for an analytical observer: everything enabled, email channel only.
Alerts are silenced during the initial historical replay when the indicator attaches. Only fresh signals from new bars after attachment will alert.
Preset Strategies
These three configurations are starting points. Tune from there based on your symbol and timeframe.
Scalping (M1 / M5 majors)
InpRSILen = 7 InpEmaLen = 7 InpSTFactor = 0.3 InpSTAtrLen = 10 InpMinConfluence = 3 InpSignalCooldown = 4 InpSLAtrMult = 1.2 InpRRTP1 / TP2 / TP3 = 0.8 / 1.5 / 2.5 InpUseDivSignal = false
Tighter parameters across the board for fast markets. Divergence is disabled because pivots form too frequently on M1/M5 to be reliable. Cooldown is 4 bars to allow more setups but still prevent same-bar duplicates.
Swing Trading (H1 / H4 majors — default)
(All defaults work well — H1 majors are the design target.)
InpMinConfluence   = 2
The default configuration is calibrated for H1 majors. Increase InpMinConfluence to 3 if you prefer fewer, stronger signals.
Conservative (H4 / D1 — fewer, stronger setups)
InpRSILen = 21 InpEmaLen = 21 InpSTFactor = 0.6 InpSTAtrLen = 21 InpMinConfluence = 4 InpSignalCooldown = 12 InpSLAtrMult = 2.0 InpRRTP1 / TP2 / TP3 = 1.0 / 2.5 / 4.5
Longer averages, stricter confluence (4 of 5 required), wider stops to absorb H4/D1 volatility, and a runner TP at 4.5R for the rare extended trends.
Troubleshooting
Indicator shows in Navigator but does not attach to chart. Check the Journal tab in the Toolbox (Ctrl+T) for any error messages. The most common cause is invalid input values — every input has range validation. Check that values like InpRSILen , InpSTAtrLen , InpSLAtrLen are within their permitted ranges (typically 2–500).
Bands and midline do not appear. The indicator needs at least InpRSILen + InpEmaLen + 60 bars of history before bands can render. On a fresh chart with limited history, scroll back to load more bars or switch to a higher timeframe to confirm the indicator is working.
Dashboard is in the wrong position. Adjust InpDashPos to choose a corner, then nudge with InpDashOffsetX and InpDashOffsetY . The default InpDashOffsetY = 20 pushes the dashboard below the symbol/timeframe toolbar area.
Too many signals on chart. Increase InpMinConfluence from 2 to 3 or 4. Each step up significantly thins the signal stream.
Too few signals on chart. Decrease InpMinConfluence to 1 or disable some of the confluence layers ( InpUseVolConfirm , InpUseRsiConfirm , InpUseBandRetest ). Note: each disabled layer awards a free point in scoring, so make sure your minimum-confluence value still reflects your real strictness.
Alerts fire during initial attachment. This should never happen on the latest version. If it does, verify the indicator version under the indicator properties dialog. If the version is older than the current Market release, remove and re-add the indicator from the Navigator.
SL/TP lines disappear unexpectedly. The lines are intentionally removed when the trade closes (SL hit or TP3 hit). The signal arrow stays. To verify whether a trade closed, check the dashboard's Active Signal section — if it shows "WAITING", the trade has closed.
Different signals on MT4 vs MT5. The two builds should produce identical signals at identical bar timestamps. If you see a discrepancy, verify both builds are on the same symbol with identical inputs and that both have synced their history (right-click chart > Refresh).
Download the indicator:
- MetaTrader 5: Reverse RSI Phantom MT5
- MetaTrader 4: Reverse RSI Phantom MT4
CONTACT & SUPPORT
- Email: info@forexobroker.com
- Questions: Use the Comments section on the product page or send a private message
- Bug Reports: Please include your broker name, account type, and a screenshot
-
✅ All MQL Tools: https://www.mql5.com/en/users/forexobroker/ ✅
--------------------------------------------------------------------------------------------------------------
🏦 **Broker I use**: https://icmarkets.com/?camp=55869
🏦 **Broker For EU Traders I use 1**: https://www.ictrading.com?camp=91414
🏦 **Broker I use 2**: https://one.exnessonelink.com/boarding/sign-up/a/c_thuv62ocfq
💻 **VPS**: https://chocoping.com/processing/aff.php?aff=738
💼 **Companies I use for getting funded**:
Fundednext: https://fundednext.com/?fpr=kestutis39
The5ers: https://www.the5ers.com/?afmc=16kl
FTMO: https://trader.ftmo.com/?affiliates=nRAyOhmFRnEnFdOpdLeh
Risk Disclaimer
Trading foreign exchange and CFDs on margin carries a high level of risk and may not be suitable for all investors. You may sustain a loss exceeding your initial investment. Trend Quorum is a technical analysis tool and does not guarantee profitable trades. Past performance is not indicative of future results. The authors accept no liability for any loss arising from use of the indicator. By using Trend Quorum you acknowledge sole responsibility for your trading decisions.


