
Vault Depth Indicator: Pulse-Driven Adaptive Bands with Exhaustion Levels and Retest Detection for MT4 and MT5

Introduction
Most trend-following indicators tell you what direction the market is moving in. They draw a moving average, color the candles, or paint an arrow when one indicator crosses another. What they rarely tell you is how much conviction there is behind the move, when that conviction is starting to fade, and where price is likely to react on the way back. These three pieces of information are usually left to discretionary chart reading, which is slow, inconsistent, and difficult to teach.
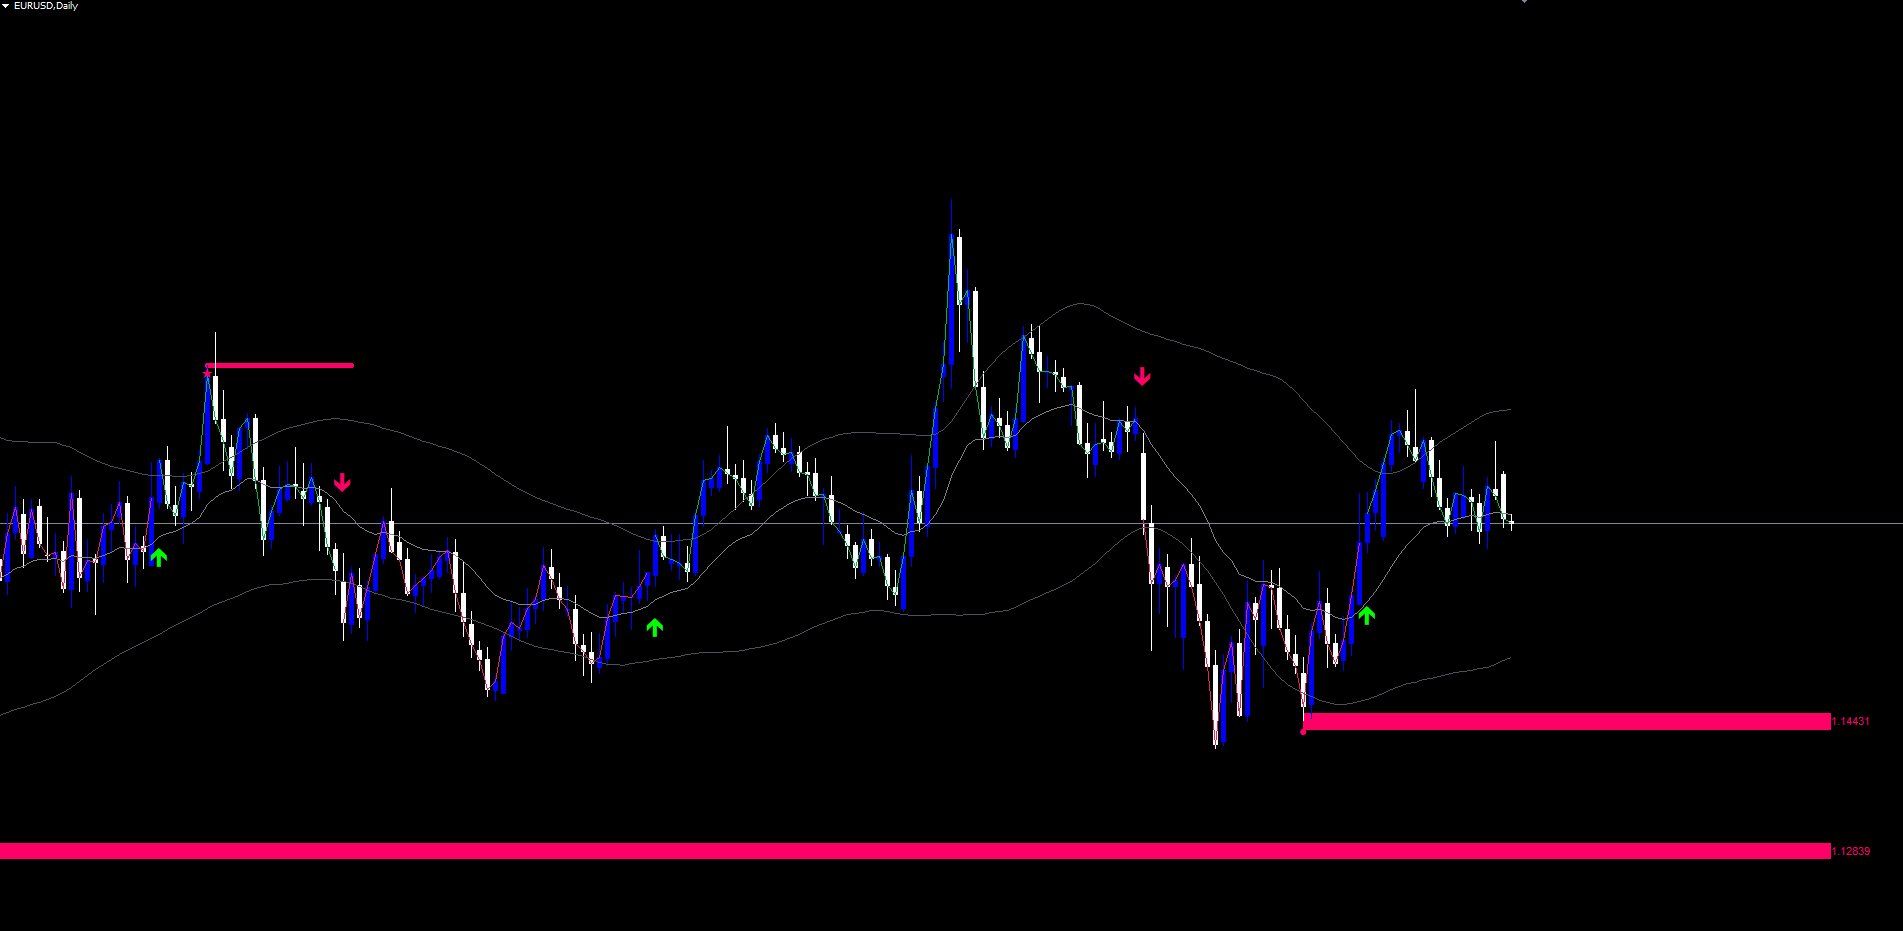
Vault Depth Indicator was built to expose all three. It tracks every bar against a "pulse engine" that increments only when a candle closes in the upper or lower 30% of its range with directional intent, and decays smoothly when conviction does not appear. The pulse score modulates the width of an adaptive band channel built from Mean Absolute Deviation around an EMA basis -- bands tighten when conviction is high and widen when the market is uncertain. When the pulse exhausts after a sustained run, the indicator plants an "exhaustion level" at the price peak where conviction was strongest. These levels then live on the chart as zones that price can later retest, with cooldown-gated retest detection that fires once per qualified touch.
The indicator is available for both MetaTrader 4 and MetaTrader 5.
Download the indicator:
- MetaTrader 5: Vault Depth MT5
- MetaTrader 4: Vault Depth MT4
The non-repainting architecture ensures that every level planted, every trend flip arrow, and every retest signal is permanent once the bar closes. The signal cross logic uses RAW upper and lower bands -- never the smoothed plot lines -- so signal timing is deterministic and reproducible. Five distinct alert events cover trend flips, exhaustion plants, and bullish/bearish retests, each delivered through any combination of popup, sound, push, and email channels.
This article explains the technical concepts behind pulse-tracking, adaptive Mean Absolute Deviation bands, and exhaustion-based level discovery, then walks through each parameter and visual element in turn.
What the Pulse Engine Measures
A "conviction bar" in Vault Depth is a candle that closes near the extreme of its own range and travels in that direction. By default, the threshold is 30%: a bullish conviction bar closes in the upper 30% of its high-low range AND closes higher than it opened. A bearish conviction bar mirrors this -- closing in the lower 30% AND closing below the open. Bars that close mid-range, regardless of direction, do not register as conviction.
This definition matters because it filters out the most common source of noise in price-action analysis: bars where buyers and sellers fought to a draw. A bar with a wide range that closes near the middle conveys very little directional information, regardless of whether it printed slightly green or slightly red. By contrast, a bar that closes in the top 10% of its range with a positive body tells you that buyers controlled price into the close -- the most actionable moment of the bar's life.
When a bullish conviction bar prints, the indicator's bullPulse counter increments by 1, capped at the configured maximum (default: 8). When a bullish conviction bar does not print, the counter decays by a multiplier (default: 0.85, meaning the counter retains 85% of its value each non-conviction bar). The same independent logic runs for bearPulse . The counter is therefore neither a raw count nor a fixed-window average -- it accumulates evidence quickly when conviction appears and forgets it gracefully when conviction stops.
Saturation is calculated as max(bullPulse, bearPulse) / pulseCap . A saturation reading of 1.0 means one direction has hit the cap; 0.5 means it is halfway there; 0 means the engine is idle. The dominant direction is whichever counter is currently higher.
The reason this matters more than a fixed RSI or stochastic reading is that the pulse engine does not measure overbought or oversold conditions -- it measures participation. A market can be overbought on RSI and still have rising pulse if buyers continue to drive closes near highs. Conversely, a market can be neutrally priced on RSI and have falling pulse if buyers stop closing strongly. Pulse captures the engagement level of the dominant side, not the price's distance from a midpoint.
Mean Absolute Deviation and Why It Beats Standard Deviation
The adaptive bands are constructed using Mean Absolute Deviation (MAD), not Standard Deviation. The difference is more than academic.
Standard Deviation squares each deviation from the mean before averaging, then takes the square root. This squaring step amplifies the influence of large outliers. A single news-driven spike candle can inflate the standard deviation reading for the next 20 bars even though it does not represent typical market behaviour. Bollinger Bands, the most famous standard-deviation-based bands, are well known to "balloon" after volatility shocks and stay balloon-shaped for a multiple of the lookback period.
Mean Absolute Deviation simply averages the absolute differences between each price and the mean. There is no squaring, so each bar contributes proportionally to its actual deviation, not its squared deviation. This produces bands that respond to typical market behaviour rather than worst-case behaviour, and that recover faster after a volatility spike.
In Vault Depth, the MAD is computed over the configured MAD Length (default: 17 bars) on close prices around their own SMA. This MAD value is then multiplied by an adaptive band coefficient bandMult to produce the band offsets above and below the basis EMA.
The basis itself is an Exponential Moving Average of close prices over Trend Length bars (default: 21). The EMA is intentionally faster than the typical 50 or 200 used as trend filters, because the bands themselves provide most of the trend structure -- the basis just centers the channel.
The result is a channel that wraps tightly around price during trends and widens during chop, all without the squared-error amplification that distorts Bollinger-based systems.
Adaptive Band Width: Tight When Saturated, Wide When Exhausted
The band coefficient is calculated as:
bandMult = bandMax - (bandMax - bandMin) * saturation
Where saturation runs from 0 to 1, bandMin defaults to 1.4, and bandMax defaults to 2.2.
When the pulse is fully saturated (saturation = 1.0), bandMult becomes 1.4 -- the bands are at their tightest. This is the indicator's interpretation of "trend with high conviction": when buyers (or sellers) are consistently driving closes near the bar extremes, the system tightens the channel, signalling that price is unlikely to mean-revert significantly because the dominant side is too engaged.
When the pulse is exhausted (saturation = 0), bandMult becomes 2.2 -- the bands are at their widest. This represents "uncertain or exhausted market": neither side is showing conviction, so the channel widens to give price more room to oscillate without triggering signals.
The signal logic then becomes more meaningful. A close above the upper band when bands are tight (saturation high) means buyers have broken out despite the channel being narrow -- a strong directional event. A close above the upper band when bands are wide means price has merely returned to a normal envelope after expansion -- a weaker signal. The system does not treat these the same.
This adaptive width is what allows the indicator to use a simple band-cross trigger for trend flips without producing the stream of false signals that fixed-width band systems generate during chop.
Non-Repainting Signal Logic
Trend flip signals use the RAW upper and lower bands, not the optionally-smoothed display lines. This is a critical design choice. The smoothed lines (default: 20-period EMA smoothing on the band values) are aesthetic only -- they make the chart easier to read, but their lag would corrupt signal timing if used for the cross detection.
A long signal ( switchUp ) fires when the previous bar's close was at or below the previous bar's RAW upper band, AND the current bar's close is above the current bar's RAW upper band, AND the previous signal state was short (-1) or neutral (0). The mirror condition fires a short signal ( switchDown ).
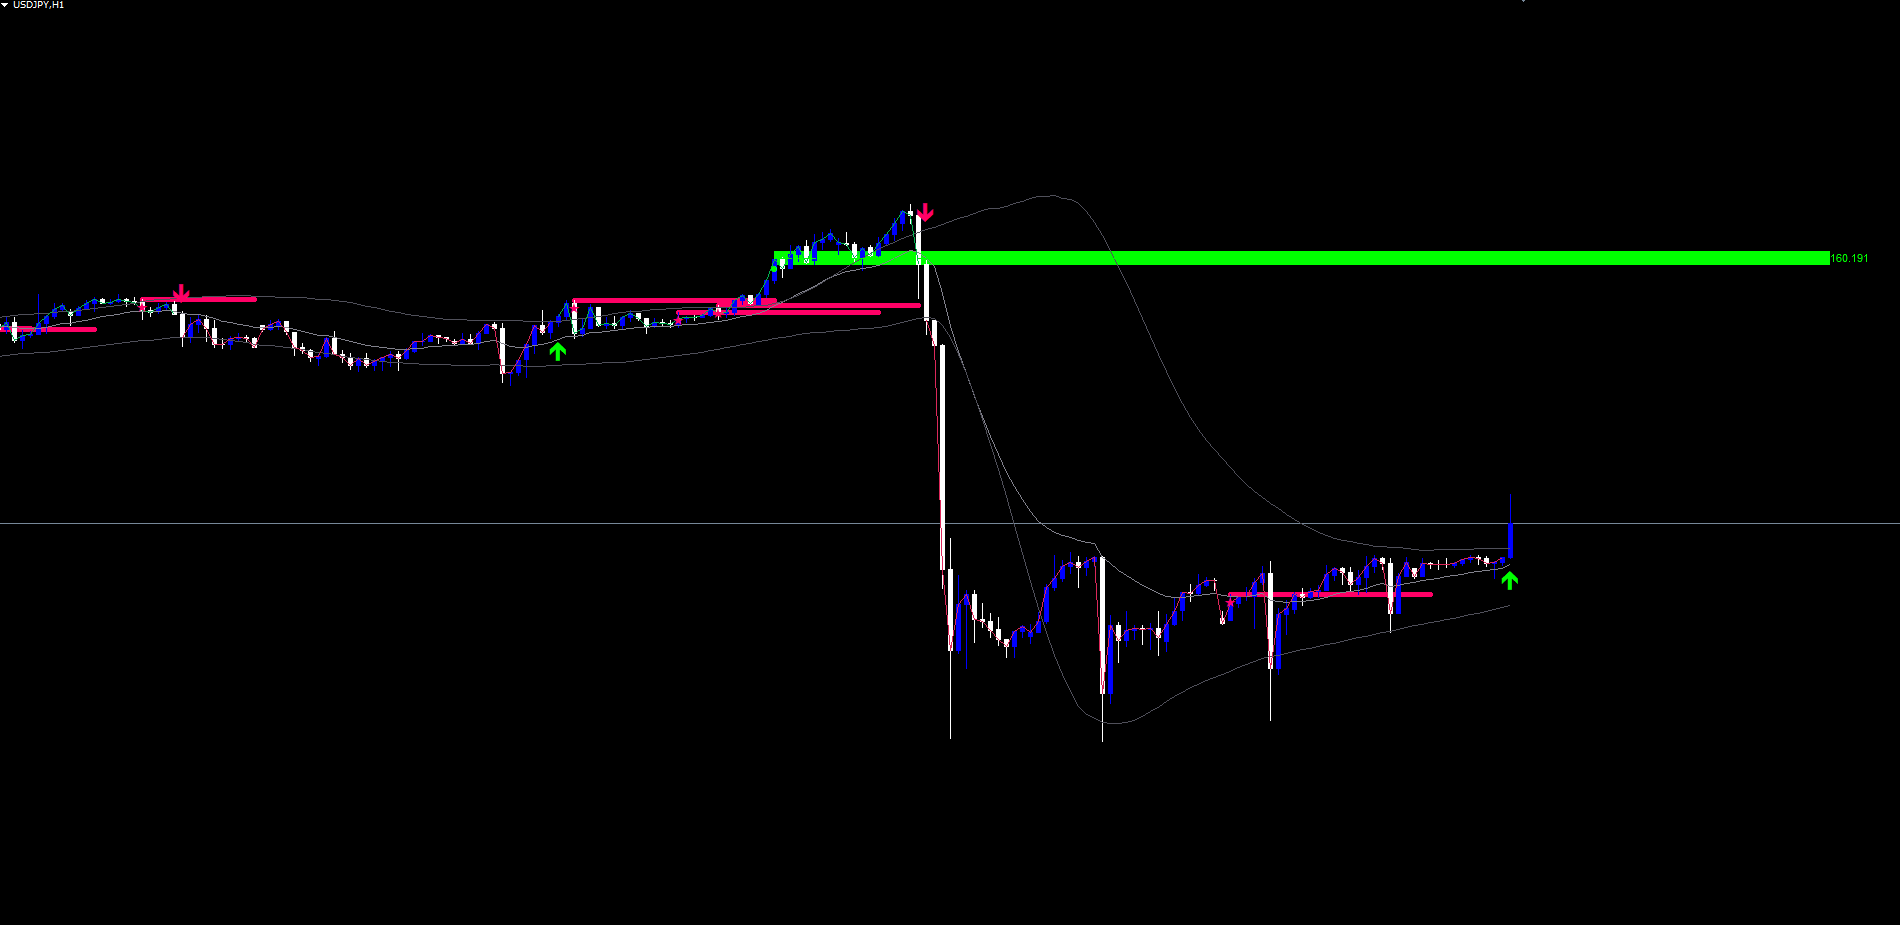
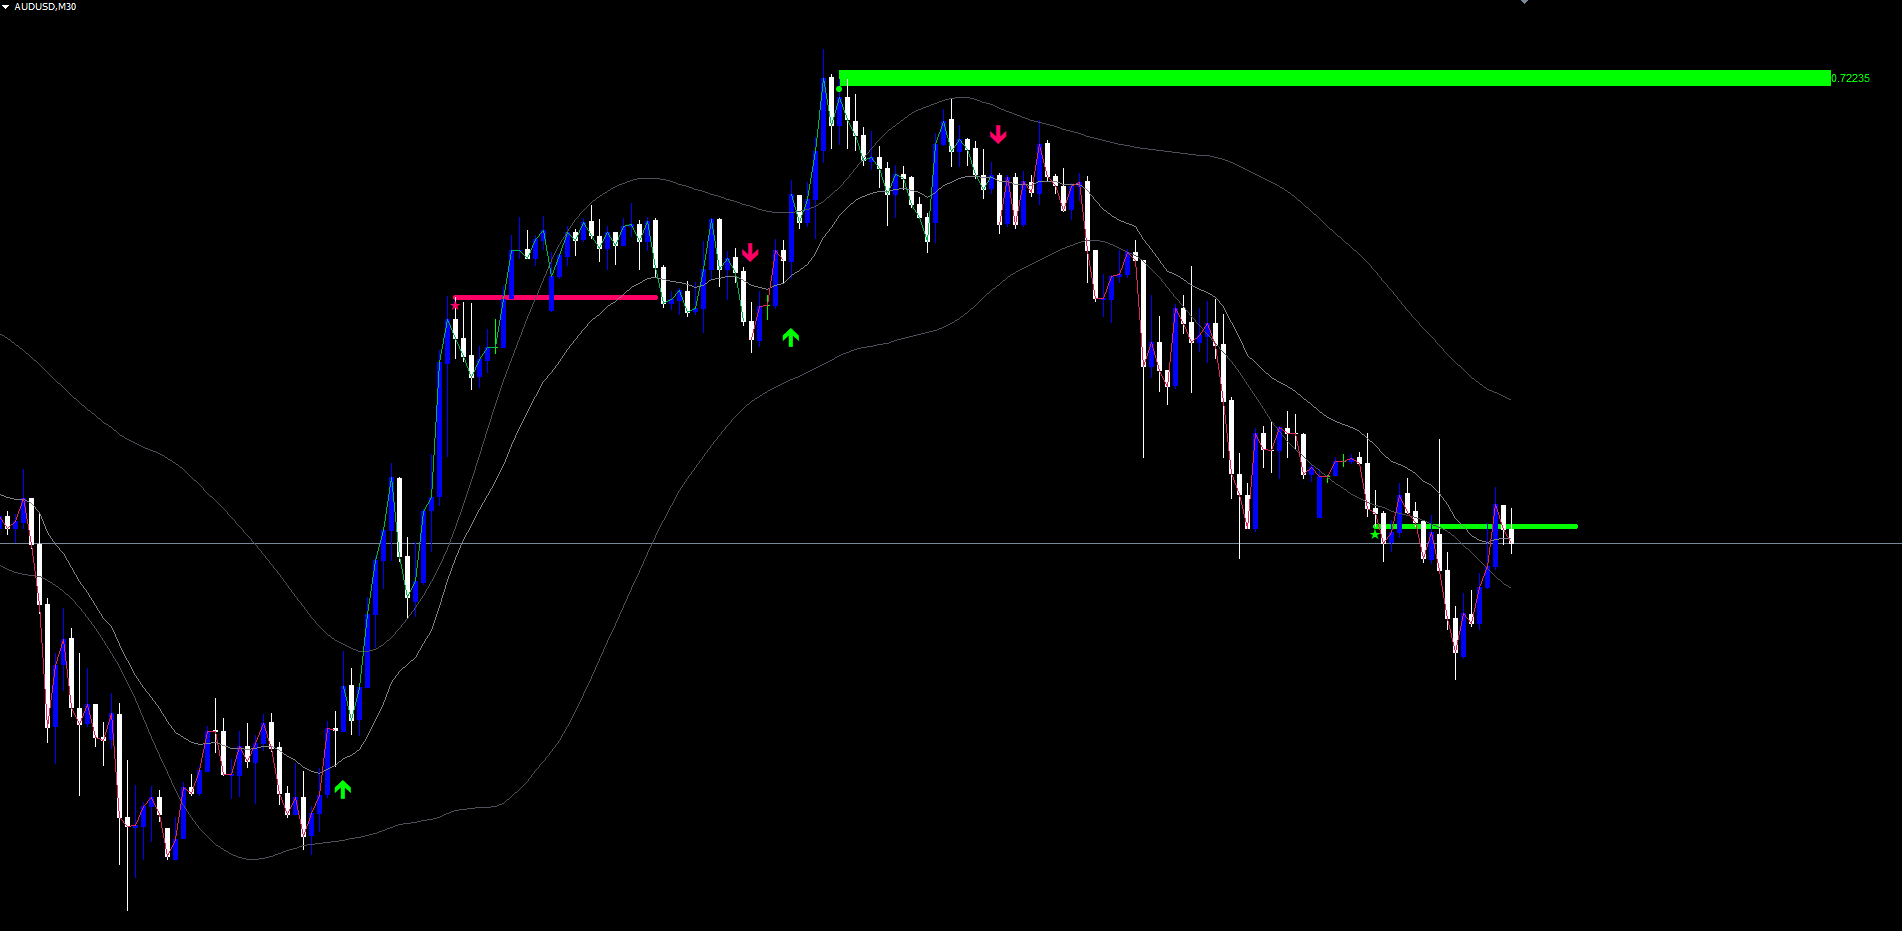
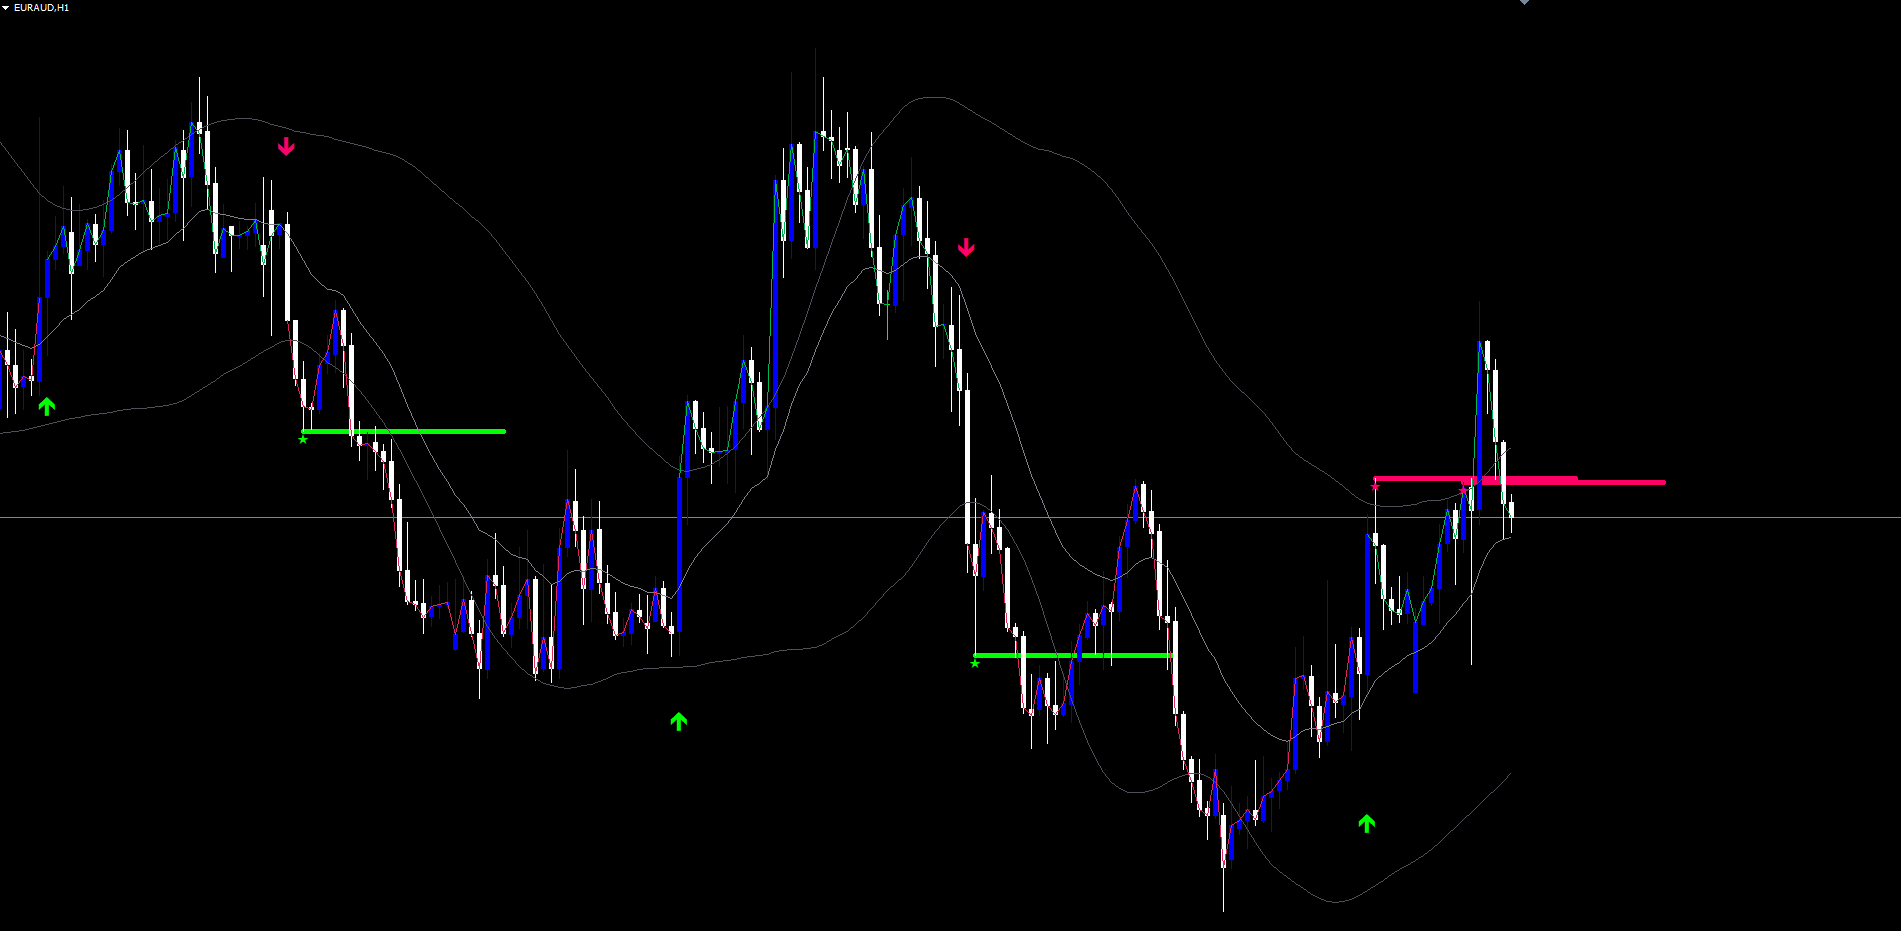
Once a signal fires, an arrow is plotted at the bar where the cross occurred -- below the bar low for buys (Wingdings code 233) and above the bar high for sells (Wingdings code 234). The arrow is permanent. It does not move. It does not vanish.
This non-repainting integrity has a cost: signals appear at the close of the breakout bar, not at the moment the cross occurs intra-bar. A trader who sees the arrow on the just-closed bar acts on information that was confirmed at that close. This one-bar latency is the price of deterministic signals -- a price serious traders universally accept over indicators that look perfect in hindsight but shift live.
The Smoothing Length parameter (default: 20) controls how visually smooth the upper and lower band display lines are. Four smoothing methods are available: Simple Moving Average (SMA), Exponential Moving Average (EMA), Hull Moving Average (HMA), and Arnaud Legoux Moving Average (ALMA). HMA gives the lowest visual lag; ALMA gives the smoothest visual flow; EMA balances the two; SMA is the simplest. None of these affect signal timing.
Exhaustion Levels: How Pulse Collapse Plants a Zone
This is the indicator's most distinctive feature. While the pulse is rising, the indicator tracks the highest saturation reached during the current pulse cycle, along with the price (high for bull peaks, low for bear peaks), the bar time, and the dominant direction at the peak. These four values are persistently stored as satPeak , satPeakPrice , satPeakBarTime , and satPeakDir .
When saturation falls below satPeak * dropThresh AND satPeak was above 0.5, the pulse is considered "exhausted". The default Exhaustion Drop is 0.4, meaning saturation must fall to less than 40% of its recent peak before the engine acknowledges that conviction has truly faded.
When exhaustion fires, the indicator plants a zone:
- A rectangle is drawn centered on the peak price, with vertical thickness equal to ATR multiplied by Zone Thickness (default: 0.25). The rectangle starts at the bar where the peak occurred and extends 40 bars to the right.
- A dashed mid-line is drawn through the exact peak price across the same time range.
- A text label appears at the right edge of the rectangle showing the precise peak price.
- A diamond marker (Wingdings code 159) is placed on the peak bar -- below the price for bull peaks (since the peak high is what was tagged), above the price for bear peaks.
The zone is drawn in the bull or bear color depending on which direction had control at the peak. After plantation, the satPeak state resets to zero so the engine can begin tracking the next cycle from scratch.
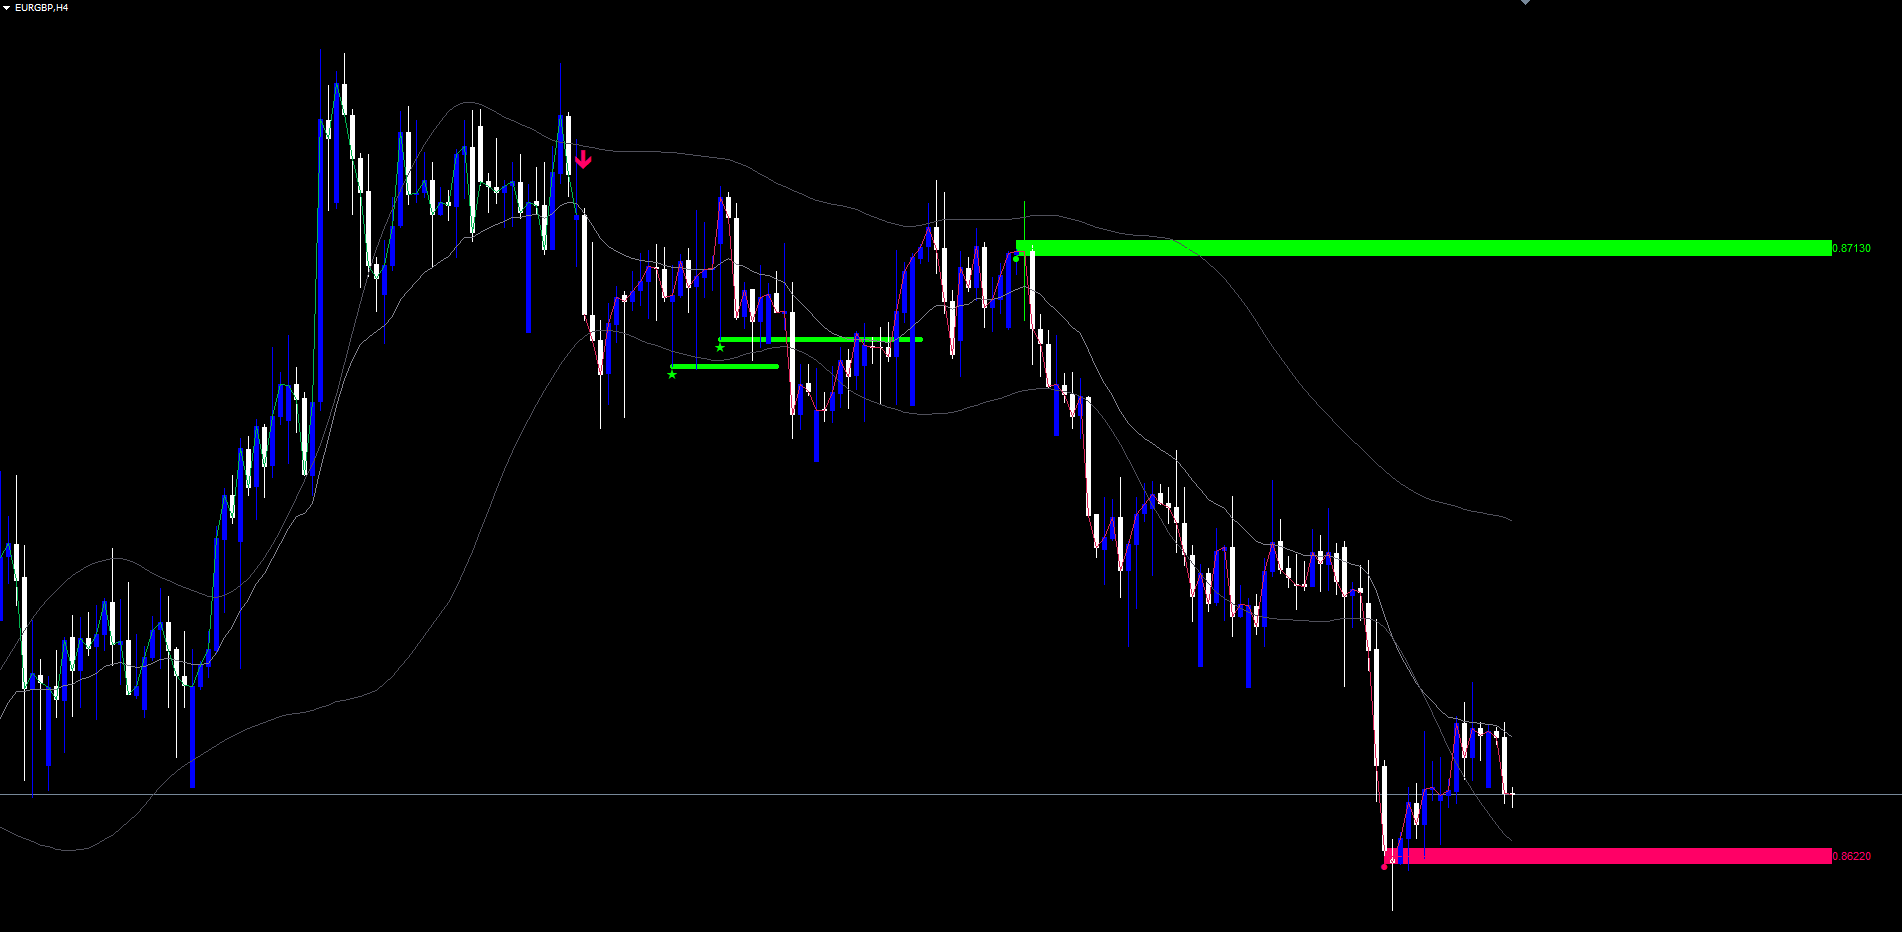
The interpretation: this zone marks the price level at which the dominant side reached its strongest conviction during a move. When price returns to this level, it is returning to a structural extreme -- the price where buyers (or sellers) were last fully engaged. These zones tend to act as significant support and resistance because they represent prices that the market itself flagged as important through participation, not arbitrary chart points.
Level Lifecycle: Extension, Break, and Retest
Every bar, every active level is checked for two events:
Break: A level is broken when the current close exceeds the zone in the direction opposite to its origin, with a configurable ATR-scaled buffer (default: 0.25 * ATR). For a bull-peak level (planted at a high-water mark of bullish conviction), a break fires when close goes above the zone's upper edge plus the buffer. For a bear-peak level (planted at a low-water mark of bearish conviction), a break fires when close goes below the zone's lower edge minus the buffer. When a level is broken, all four of its objects (rectangle, mid-line, label, diamond) are removed from the chart and the level is marked dead.
Extend: While a level is alive, its right edge is extended forward each tick to bar time + 40 bar widths, keeping the zone visible into the future.
Retest: A retest fires when the current bar's high-low range touches inside the zone (high >= zone bottom AND low <= zone top), AND the cooldown has elapsed (default: 8 bars since the last retest on this level), AND the bar is at least 2 bars after the level's origin. The direction of the retest signal depends on the level's origin and the current close:
- A bull-peak level (zone above price) fires a bear retest signal when close < the level's peak price -- price has returned to test the bull-conviction zone from below and is being rejected.
- A bear-peak level (zone below price) fires a bull retest signal when close > the level's peak price -- price has returned to test the bear-conviction zone from above and is being rejected.
When a retest fires, a horizontal line is drawn at the bar's high (for bear retests) or low (for bull retests), spanning 25 bars to the right, in the relevant direction's color. A small sparkle marker (Wingdings code 171) is placed at the same anchor. The level's lastRetestBarTime is updated to enforce the cooldown.
The maximum number of active levels is capped (default: 8). When a new exhaustion fires while at the cap, the oldest alive level is removed to make room.
The Five Alert Events
Vault Depth fires alerts on five distinct event types, each independently togglable:
- Trend Flip LONG -- switchUp event when bands are crossed bullishly.
- Trend Flip SHORT -- switchDown event when bands are crossed bearishly.
- Exhaustion Level Planted -- a new zone is drawn at a saturation peak.
- Bullish Retest -- price retests a bear-peak zone and is rejected upward.
- Bearish Retest -- price retests a bull-peak zone and is rejected downward.
Each alert is dispatched through up to four delivery channels:
| Channel | Default | Parameter |
|---|---|---|
| Popup (on-screen dialog) | Enabled | InpAlertPopup = true |
| Sound (alert.wav by default) | Disabled | InpAlertSound = false |
| Push notification (mobile) | Disabled | InpAlertPush = false |
| Disabled | InpAlertEmail = false |
All alerts are guarded by a per-bar dedupe: if the same event fires multiple times within the same bar (e.g., a volatile bar that crosses and recrosses), only the first instance triggers a notification. Push and email notifications are automatically suppressed during Strategy Tester runs to prevent spam during backtests.
The five event toggles let you tailor alert volume to your trading style. A swing trader may enable only the Exhaustion and Retest alerts, ignoring the more frequent trend flips. A scalper may enable only the trend flip alerts. A pure level-tracker may enable Exhaustion alone.
Practical Trading Workflow
Understanding each component is one thing. Applying them in sequence produces consistent results.
Step 1: Add the indicator to a chart. Open any chart in MetaTrader 4 or MetaTrader 5. Locate Vault Depth Indicator in Navigator > Indicators > Market. Drag onto the chart. Default settings are tuned for Forex on H1-H4. Lower timeframes may benefit from increasing Pulse Cap and Trend Length to reduce noise.
Step 2: Read the band channel. The basis line provides the reference. The upper and lower bands form an envelope that tightens during conviction-driven trends and widens during chop. When the channel is visibly narrow on the chart, expect higher signal quality from any cross. When it is visibly wide, expect false signals -- consider waiting for additional confluence such as a recent exhaustion zone retest.
Step 3: Wait for a trend flip. A flip-up arrow below a candle or a flip-down arrow above a candle marks a confirmed band cross. Enter on the open of the next bar at market, or wait for a pullback toward the basis if you prefer to scale in. Note the price level of the flip bar -- it becomes a meaningful breakout/breakdown reference.
Step 4: Track exhaustion zones. When a zone appears, it represents a structural extreme of the recent move. Treat it as significant support (bear-peak zone below price) or resistance (bull-peak zone above price). Zones that the market planted itself, based on its own participation, tend to be more meaningful than horizontal lines drawn by hand.
Step 5: Trade the retest. When price returns to a zone and the indicator fires a Bullish Retest or Bearish Retest signal (visible as a horizontal line plus sparkle marker at the rejection bar), this is the indicator's highest-conviction setup. The market has already provided structural evidence (the original exhaustion), allowed price to return, and shown a rejection on the touch. Take this in the direction of the retest signal -- bull retest = long, bear retest = short.
Step 6: Manage exits using the next level. If you are long after a bull retest, the next bull-peak zone above price (if any) becomes a natural target. The space between zones provides clean reward-to-risk math: stop slightly beyond the retest zone, target the next opposite zone, and hold through any flip arrows that occur in your favor.
Timeframe Considerations
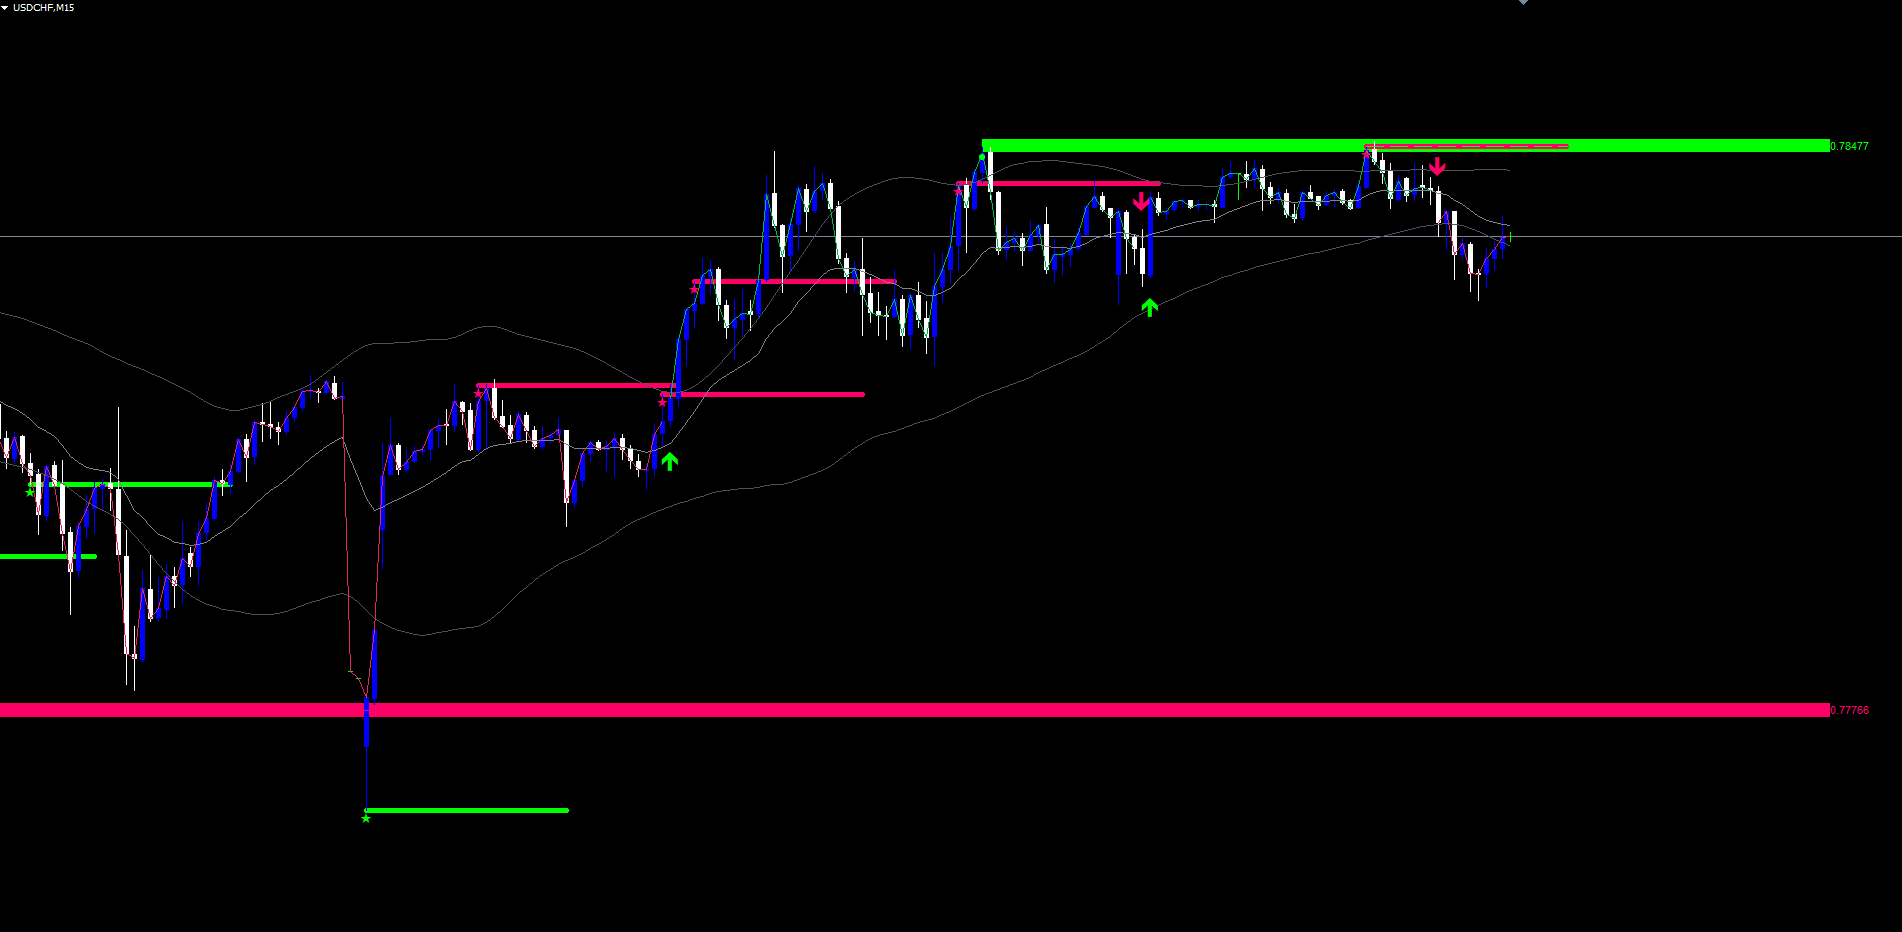
On lower timeframes (M5-M15), pulse cycles complete quickly and exhaustion zones proliferate. Reduce Max Levels to 4 or 5 to keep the chart readable. Lower timeframes also produce more frequent retests due to faster pulse turnover.
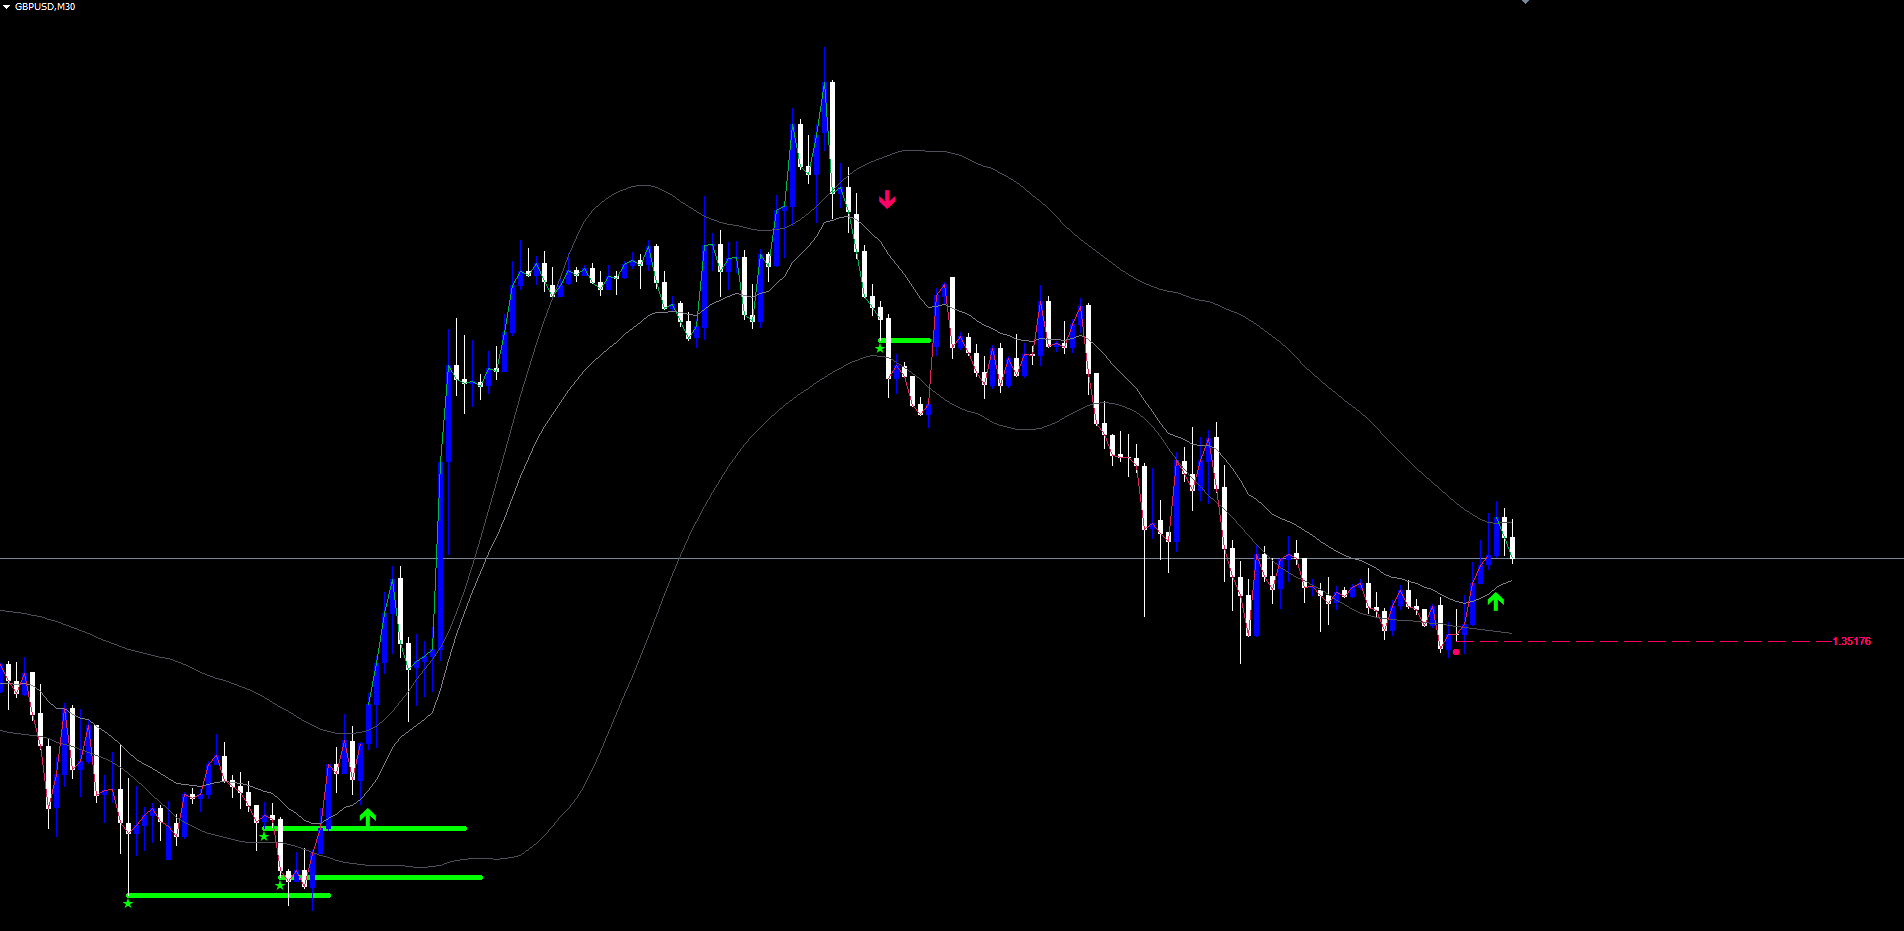
On medium timeframes (M30-H4), the indicator produces well-spaced signals. Each exhaustion zone tends to remain relevant for several days, and retests carry meaningful weight. This is the indicator's natural home for swing trading.
On higher timeframes (D1-W1), exhaustion zones become major structural levels that can hold for weeks or months. Each retest is a high-weight event. Consider increasing Max Levels to 12 or 15 to retain more historical zones, and increase Retest Cooldown to 15 or 20 to filter low-quality re-touches.
Parameter Reference
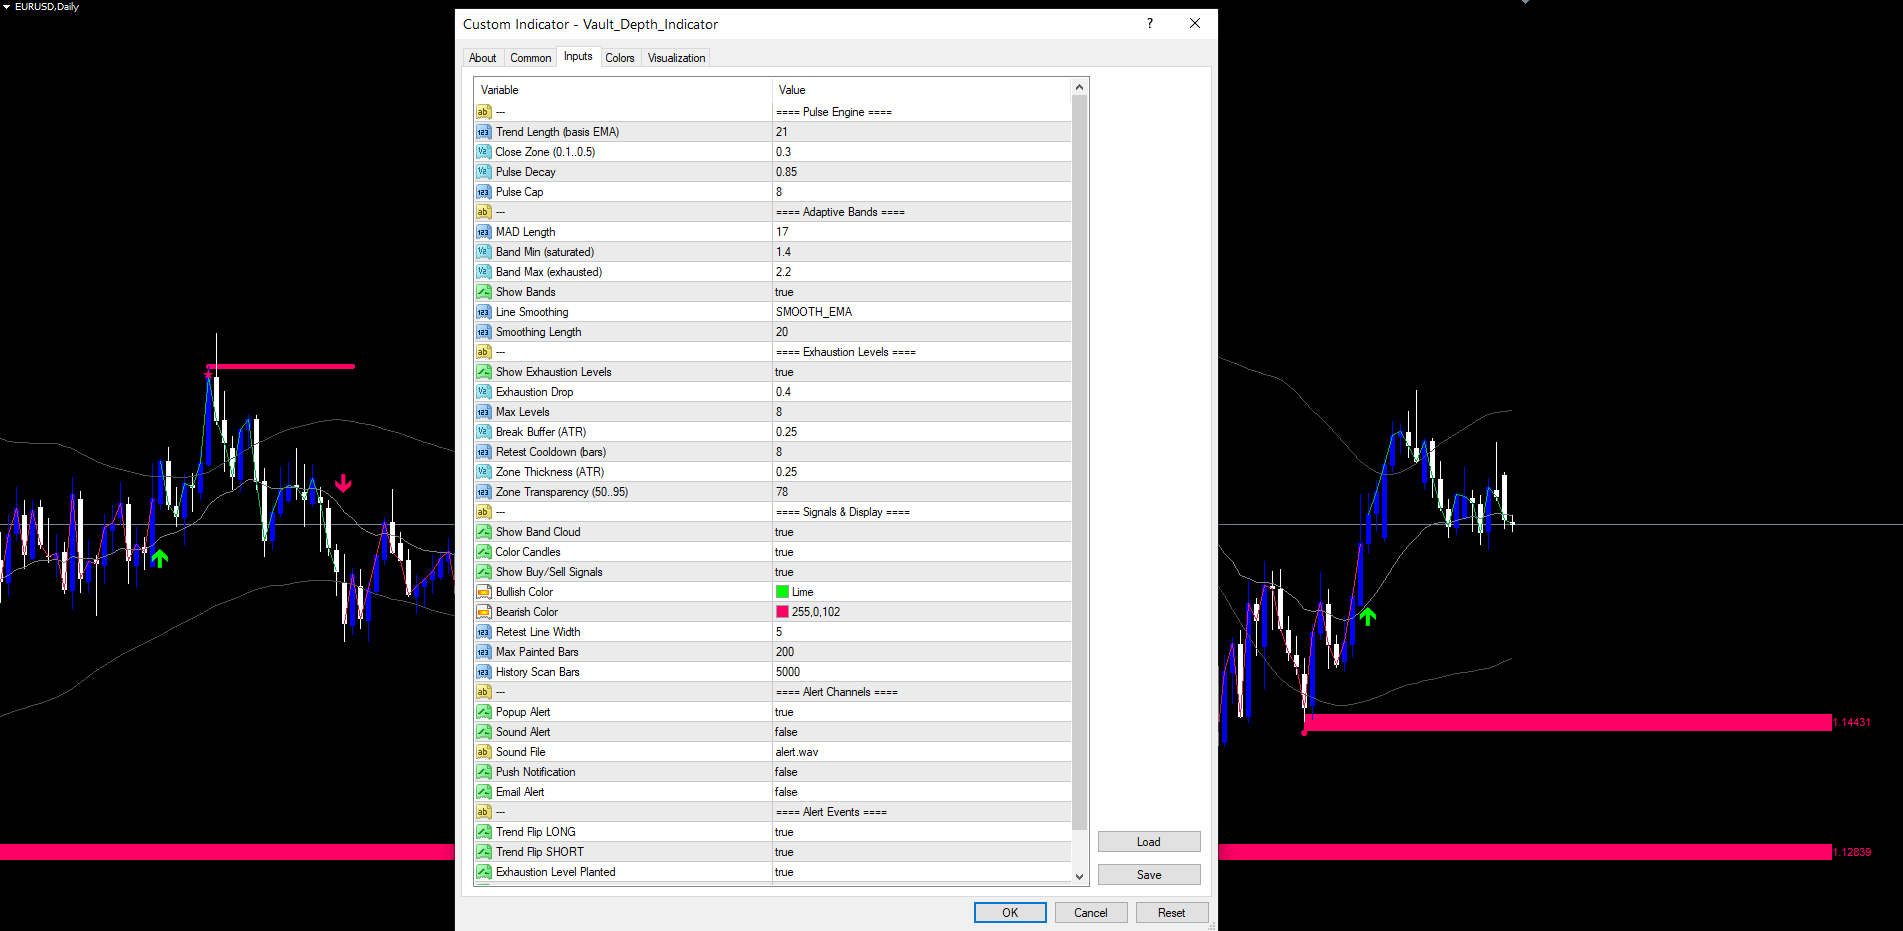
All input parameters are listed below, grouped by section. Default values match the source code exactly. Parameters can be modified through the indicator's Inputs tab when adding it to a chart, or by right-clicking the indicator and selecting Properties.
Pulse Engine
| Parameter | Default | Description |
|---|---|---|
| InpTrendLength | 21 | Period for the basis EMA |
| InpCloseZone | 0.3 | Fraction of bar range required for conviction (top/bottom 30%) |
| InpPulseDecay | 0.85 | Multiplier applied to pulse counter on non-conviction bars |
| InpPulseCap | 8 | Maximum pulse counter value |
Adaptive Bands
| Parameter | Default | Description |
|---|---|---|
| InpMadLength | 17 | Period for Mean Absolute Deviation calculation |
| InpBandMin | 1.4 | Band coefficient at full saturation (tight bands) |
| InpBandMax | 2.2 | Band coefficient at zero saturation (wide bands) |
| InpShowBands | true | Show upper and lower band lines |
| InpSmoothMode | EMA | Display smoothing for bands: SMA, EMA, HMA, or ALMA |
| InpSmoothLen | 20 | Period for display smoothing (signals always use raw bands) |
Exhaustion Levels
| Parameter | Default | Description |
|---|---|---|
| InpShowLevels | true | Plant and display exhaustion zones |
| InpDropThresh | 0.4 | Saturation must fall below peak * this fraction to trigger exhaustion |
| InpMaxLevels | 8 | Maximum number of alive levels (oldest dropped first) |
| InpBreakBuffer | 0.25 | ATR multiplier for level break confirmation buffer |
| InpRetestCooldown | 8 | Minimum bars between retests on the same level |
| InpZoneHeight | 0.25 | ATR multiplier for zone vertical thickness |
| InpZoneTransp | 78 | Visual transparency of zone fills (0-95) |
Signals and Display
| Parameter | Default | Description |
|---|---|---|
| InpShowSignals | true | Show trend flip arrows on chart |
| InpBullColor | C'0,255,0' | Color for bullish elements (arrows, bull-peak zones) |
| InpBearColor | C'255,0,102' | Color for bearish elements (arrows, bear-peak zones) |
| InpRetestLineWidth | 5 | Pixel width of horizontal retest lines |
| InpHistoryScanBars | 5000 | Bars to scan on first load to populate historical levels |
Alert Channels
| Parameter | Default | Description |
|---|---|---|
| InpAlertPopup | true | Show MetaTrader popup dialog |
| InpAlertSound | false | Play sound file |
| InpAlertSoundFile | alert.wav | Sound file name (must be in MT4/MT5 sounds folder) |
| InpAlertPush | false | Send push notification (requires MetaQuotes ID) |
| InpAlertEmail | false | Send email notification (requires SMTP config) |
Alert Events
| Parameter | Default | Description |
|---|---|---|
| InpEvtPulseLong | true | Fire alert on trend flip LONG |
| InpEvtPulseShort | true | Fire alert on trend flip SHORT |
| InpEvtExhaustion | true | Fire alert when an exhaustion level is planted |
| InpEvtBullRetest | true | Fire alert when a bullish retest is detected |
| InpEvtBearRetest | true | Fire alert when a bearish retest is detected |
Recommended Configuration Profiles
Conservative (fewer signals, higher quality): Set InpPulseCap = 12, InpDropThresh = 0.3, InpRetestCooldown = 15, InpBandMin = 1.6, InpBandMax = 2.6. This configuration requires longer conviction runs before zones are planted and reduces retest frequency.
Default (balanced): Use all default values. Suitable for most Forex pairs on H1 and H4 timeframes.
Aggressive (more signals, broader capture): Set InpPulseCap = 5, InpDropThresh = 0.5, InpRetestCooldown = 4, InpBandMin = 1.2, InpBandMax = 1.8. Produces more frequent zones and retests, useful on lower timeframes or during ranging markets.
Installation
Vault Depth Indicator is distributed through the MQL5.com Market and installs automatically after purchase.
- Purchase the indicator from the MQL5.com Market product page.
- The indicator downloads and installs automatically into MetaTrader.
- Open the Navigator panel (Ctrl+N) and expand the Indicators section.
- Find Vault Depth Indicator under Indicators > Market.
- Drag the indicator onto any chart.
- Adjust input parameters if needed, then click OK.
The indicator works on all timeframes and all instruments supported by your broker. No manual file copying is required.
The first load on a fresh chart triggers a history scan (default: 5000 bars) to retroactively detect exhaustion zones and replay the pulse engine state. This typically takes one to three seconds. After the initial scan completes, subsequent ticks process incrementally with no delay.
The indicator creates graphical objects with the prefix VDI_ and cleans them up automatically on removal. Multiple instances on the same chart use unique prefixes to avoid collisions.
Conclusion
Vault Depth Indicator replaces the discretionary judgment of "is the trend strong" and "where will price react" with a deterministic engine grounded in three measurable concepts: bar-by-bar conviction tracking via the pulse engine, volatility-adaptive bands using Mean Absolute Deviation, and structural level discovery through saturation peak collapse.
The pulse engine answers the conviction question by counting only bars where buyers or sellers actually drove price near the extremes -- not bars that merely closed positive or negative. The MAD-based bands respond to typical market behaviour rather than worst-case outliers, producing a channel that tightens with conviction and widens with exhaustion. The exhaustion-level system plants zones at the exact prices where conviction peaked, then watches for retests with cooldown gating to filter low-quality touches.
All visual elements are non-repainting. Trend flip arrows fire on confirmed bar close. Exhaustion zones plant on confirmed pulse collapse. Retest signals fire when price re-enters a zone and shows rejection. Five distinct alerts cover every event, with per-channel toggles for popup, sound, push, and email.
The indicator is suitable for Forex, Crypto, Stocks, Commodities, and Indices across all timeframes, with default parameters tuned for H1-H4 swing trading. The full parameter reference allows tuning from conservative high-quality setups through aggressive multi-signal configurations.
Whether used as a primary signal source or as confluence with other analysis methods, Vault Depth provides a structured framework for identifying the moments when market conviction reaches its peak, when it collapses, and where price is likely to react when it returns.
Download the indicator:
- MetaTrader 5: Vault Depth MT5
- MetaTrader 4: Vault Depth MT4
CONTACT & SUPPORT
- Email: info@forexobroker.com
- Questions: Use the Comments section on the product page or send a private message
- Bug Reports: Please include your broker name, account type, and a screenshot
-
✅ All MQL Tools: https://www.mql5.com/en/users/forexobroker/ ✅
--------------------------------------------------------------------------------------------------------------
🏦 **Broker I use**: https://icmarkets.com/?camp=55869
🏦 **Broker For EU Traders I use 1**: https://www.ictrading.com?camp=91414
🏦 **Broker I use 2**: https://one.exnessonelink.com/boarding/sign-up/a/c_thuv62ocfq
💻 **VPS**: https://chocoping.com/processing/aff.php?aff=738
💼 **Companies I use for getting funded**:
Fundednext: https://fundednext.com/?fpr=kestutis39
The5ers: https://www.the5ers.com/?afmc=16kl
FTMO: https://trader.ftmo.com/?affiliates=nRAyOhmFRnEnFdOpdLeh
Risk Disclaimer
Trading foreign exchange and CFDs on margin carries a high level of risk and may not be suitable for all investors. You may sustain a loss exceeding your initial investment. Trend Quorum is a technical analysis tool and does not guarantee profitable trades. Past performance is not indicative of future results. The authors accept no liability for any loss arising from use of the indicator. By using Trend Quorum you acknowledge sole responsibility for your trading decisions.


