
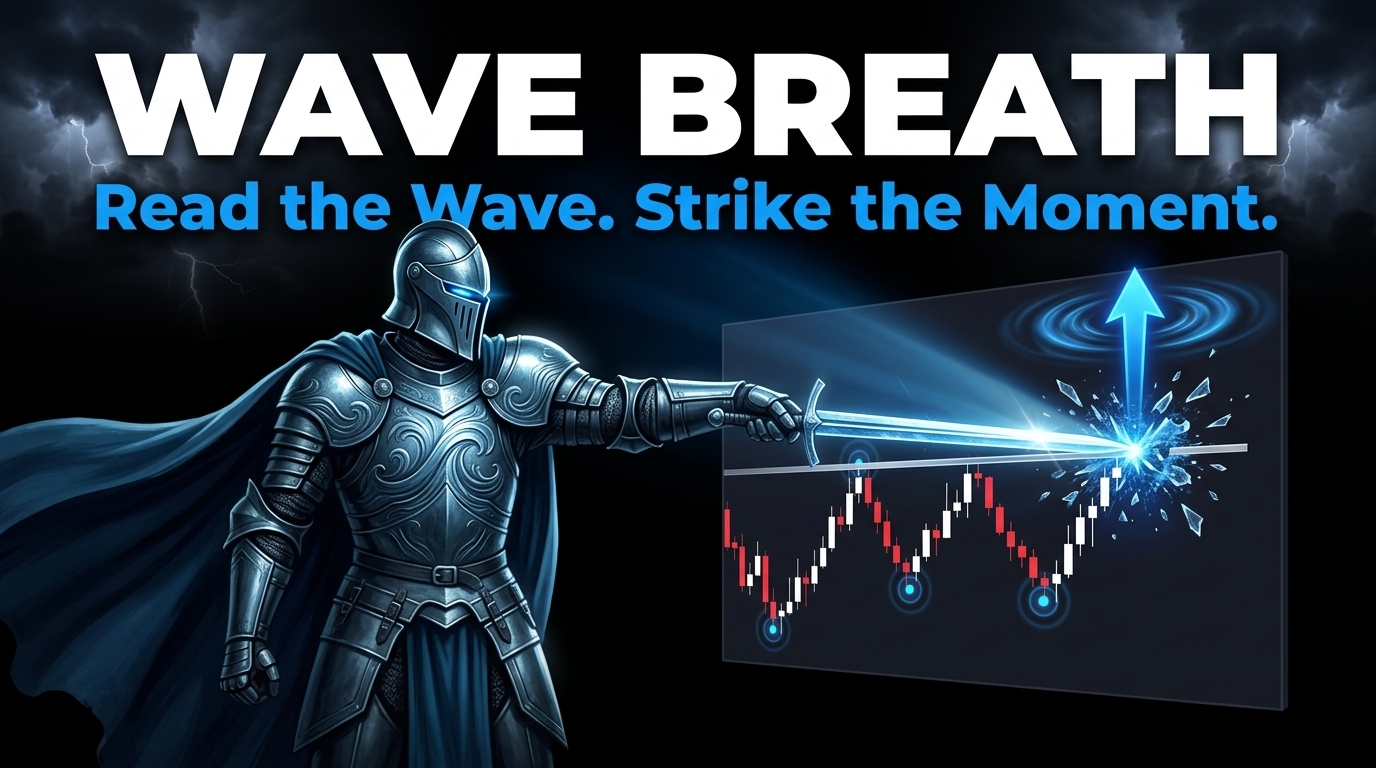
Wave Breath Indicator: Non-Repainting Adaptive Trend-Flow with Volatility Bands for MT4 and MT5

Introduction
Most trend indicators answer one of two questions: are we trending, or what is the current direction? Few answer both well, and even fewer hold up to live trading without repainting or jittering as each new tick arrives. Wave Breath Indicator was built specifically to do both reliably. It combines a smooth dual-EMA basis line on the typical price, volatility-scaled sensitivity bands that breathe with the market, and a stateful trend latch that only flips when price closes through the opposite band. The result is a clean, color-coded picture of the dominant flow that updates predictably bar by bar and never rewrites history.
The indicator is available for MetaTrader 4 and MetaTrader 5. Both builds share identical internal logic and produce visually identical output.
Download the indicator:
- MetaTrader 5: Wave Breath MT5
- MetaTrader 4: Wave Breath MT4
This article explains the underlying concept, walks through every component of the indicator, documents each input parameter, and shows how to apply Wave Breath Indicator in a practical trading workflow across forex, indices, commodities, and crypto.
The Adaptive Trend-Flow Concept
A standard moving average answers a simple question: where has price been on average for the last N bars? It cannot, on its own, tell you whether the market is trending or ranging, and a simple slope check is not robust enough to catch quick reversals or filter out noise.
Wave Breath Indicator builds a richer view by layering three concepts on top of an averaged basis line. First, it uses two exponential moving averages instead of one. The fast EMA reacts quickly to new prices; the slow EMA, with double the period, lags slightly. Averaging the two produces a basis that is responsive without being whiplashy. Second, it measures volatility on the same input series and smooths it. The smoothed volatility times a user sensitivity becomes the half-width of two bands placed symmetrically around the basis. The bands widen during volatile expansion and tighten during calm consolidation. Third, it converts the bands into a binary trend signal: while price is in an uptrend, the active level latches to the lower band; once price closes below the lower band, the trend flips to bearish and the level latches to the upper band. The trend stays bearish until price closes above the upper band, at which point it flips back.
This three-stage design (averaged basis, breathing bands, latched trend) gives the indicator its name. The bands inhale and exhale with volatility while the basis tracks the smoothed flow underneath. A latched trend only changes when price has decisively crossed to the opposite side, which filters out the kind of intra-bar noise that produces false signals on simpler systems.
Mathematical Foundation
The internal calculation is deterministic and reproduces exactly the same output every time it runs over the same data. The pipeline can be written as five formulas applied in order to every closed bar:
typical[i] = (high[i] + low[i] + close[i]) / 3 fastEMA[i] = EMA(typical, length) at bar i slowEMA[i] = EMA(typical, 2 * length) at bar i basis[i] = (fastEMA[i] + slowEMA[i]) / 2 vol[i] = stdev(typical, length) at bar i, population (divisor N) smoothVol[i] = EMA(vol, smoothLen) at bar i upper[i] = basis[i] + smoothVol[i] * sensitivity lower[i] = basis[i] - smoothVol[i] * sensitivity
The default values (length 10, smoothLen 14, sensitivity 2.0) were chosen to match the original adaptive trend-flow research from the open-source Pine Script community. They produce a balanced response on H1 and H4 charts of major forex pairs, indices, and crypto. Lower length values (around 6 to 8) make the basis more reactive and produce more frequent flips, which suits scalping on M5 and M15. Higher length values (around 14 to 20) produce a slower, smoother basis that swing traders may prefer on D1 and W1 charts.
The sensitivity multiplier directly controls band width. With sensitivity 2.0, a typical band sits roughly two standard deviations away from the basis, which is wide enough to absorb normal market noise but tight enough that genuine reversals trigger the flip. Reducing sensitivity to 1.5 produces tighter bands and more sensitive flips; raising it to 2.5 or 3.0 produces wider bands and a slower, more deliberate trend that demands stronger price moves to reverse.
Wave Breath Indicator computes the standard deviation in its biased form, dividing by N rather than N-1. This matches the conventions used in popular Pine Script and TradingView indicators so traders comparing across platforms see consistent values. The exponential moving average uses the standard recurrence with alpha equal to two divided by the period plus one, seeded with the source value on the very first bar; this is the same convention used by ta.ema in Pine Script v6.
The Stateful Trend State Machine
The most important part of the indicator is its trend state machine. Unlike a simple "is close above EMA" check, Wave Breath Indicator latches a trend value that only changes when price closes through the opposite sensitivity band. The pseudo-code below describes the exact logic applied to every confirmed bar in chronological order:
if no prior trend:
    trend = (close > basis) ? +1 : -1
    level = (trend == +1) ? lower : upper
else if trend == +1:
    if close < lower:
        trend = -1
        level = upper
    else:
        trend = +1
        level = lower
else if trend == -1:
    if close > upper:
        trend = +1
        level = lower
    else:
        trend = -1
        level = upper
This design has two desirable properties. First, the level line tracks the lower band closely during uptrends and the upper band closely during downtrends; visually, this gives traders a moving stop-loss reference that follows the structure of the trend. Second, a flip requires a close decisively beyond the opposite band, not merely a wick or a brief spike, which dramatically reduces false signals during choppy phases. A bar that pierces the lower band intra-bar but closes back inside the band does not flip the trend.
Once the bar closes, the new trend value is committed and never recomputed. This is the foundation of the indicator's non-repainting guarantee. Even though the indicator continuously recomputes the in-progress live bar (so the basis and level lines do not appear to flat-line at the chart edge), the underlying trend state for every closed bar is set in stone after that bar's first commit.
The first time the indicator attaches to a chart, it walks forward through all available history, applying this state machine bar by bar from the oldest valid bar to the most recent closed bar. Every historical trend flip is recorded so the chart shows L and S labels at every reversal, not just future ones. After the initial scan, only newly closed bars are processed.
Visual Components
The visual layer is intentionally information-dense but uncluttered. Each component answers a specific question at a glance:
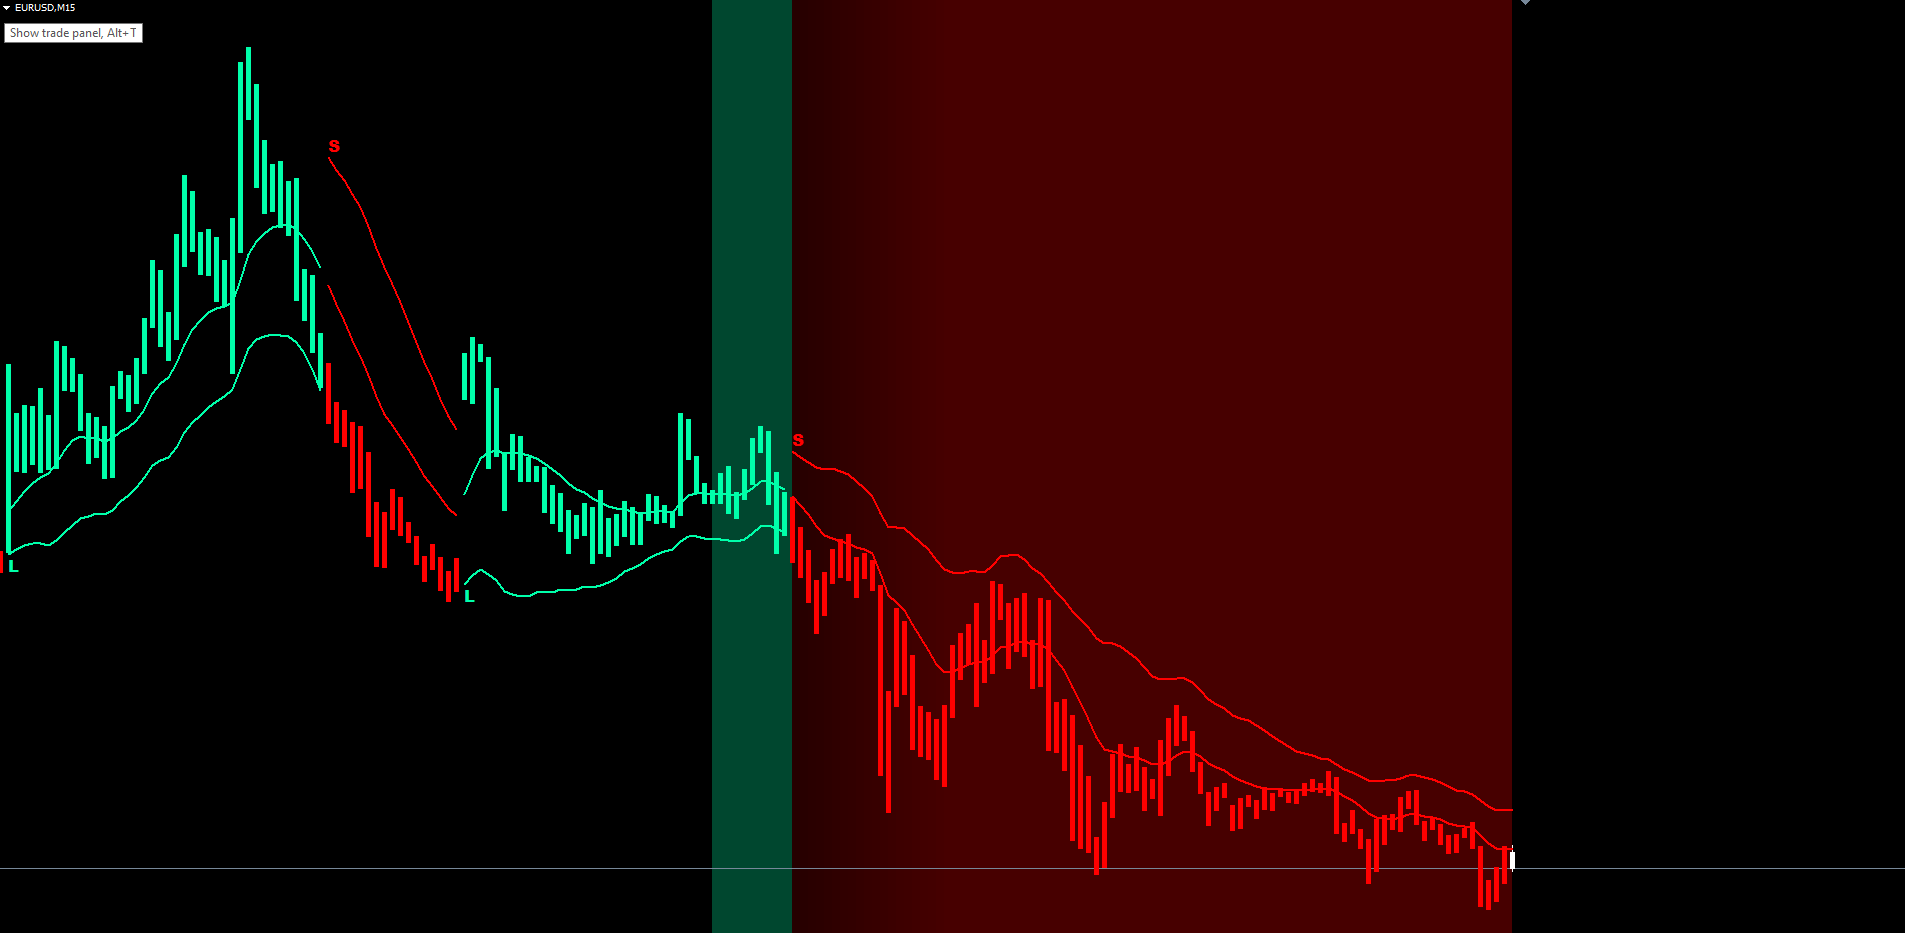
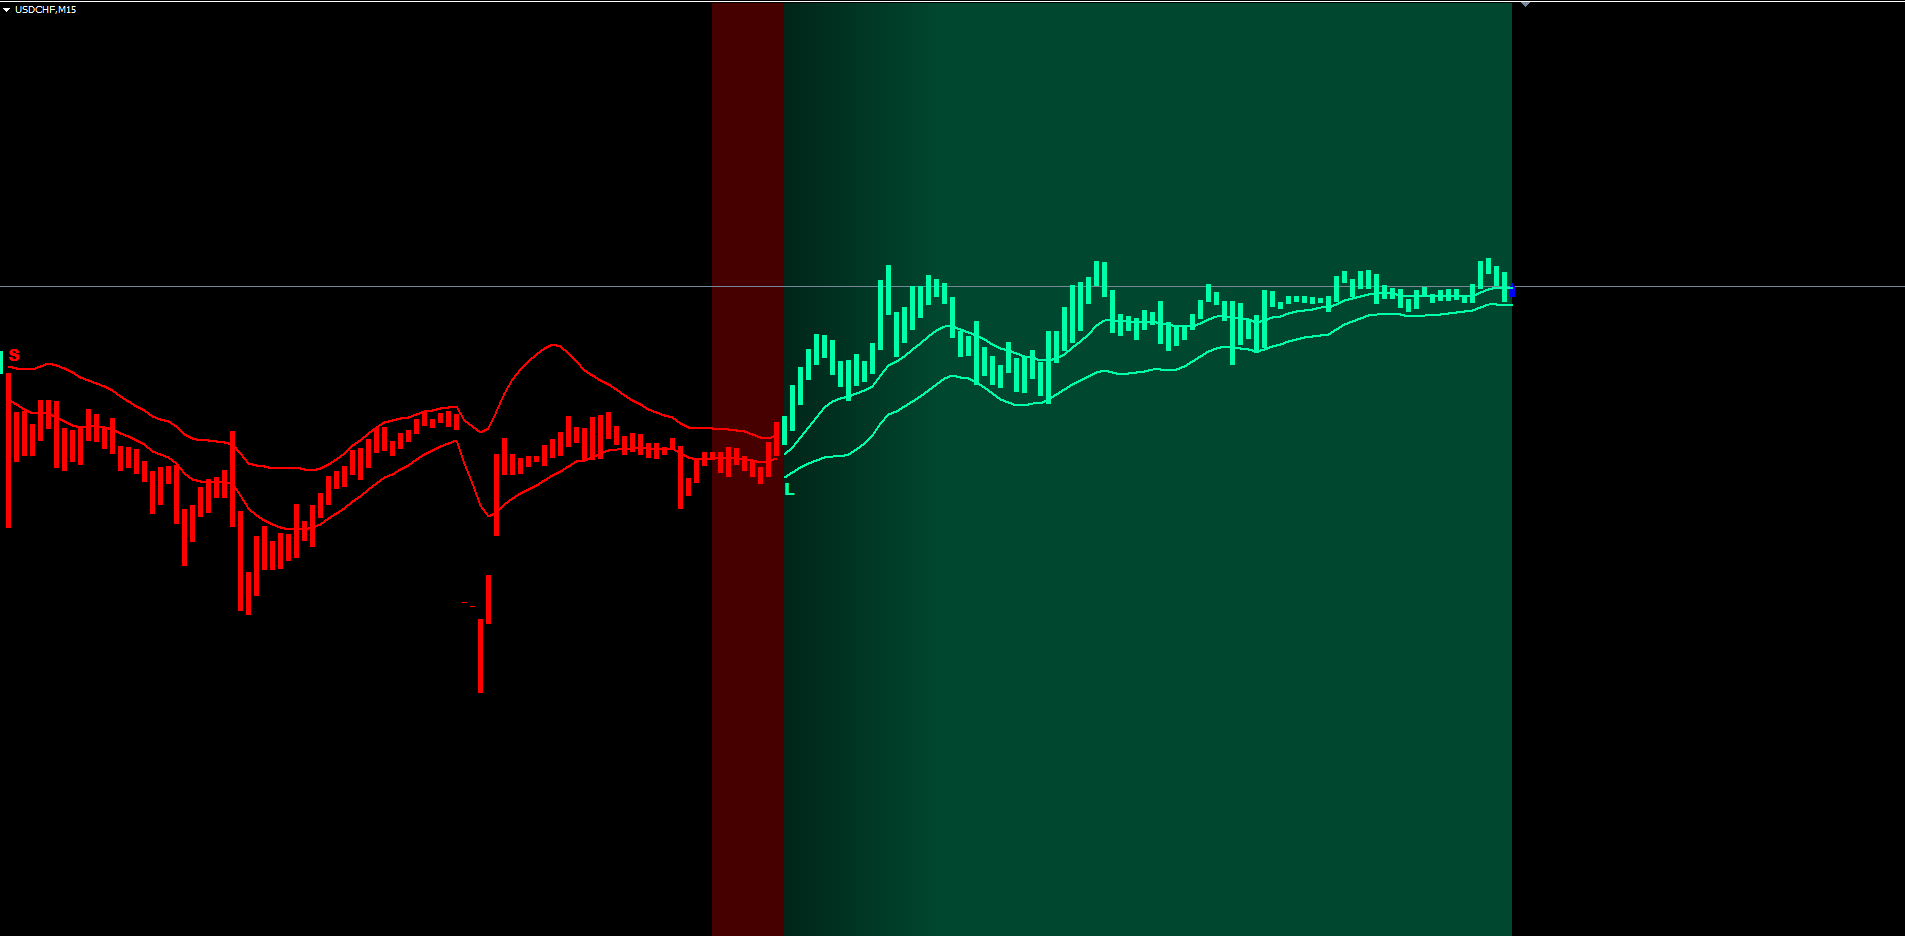
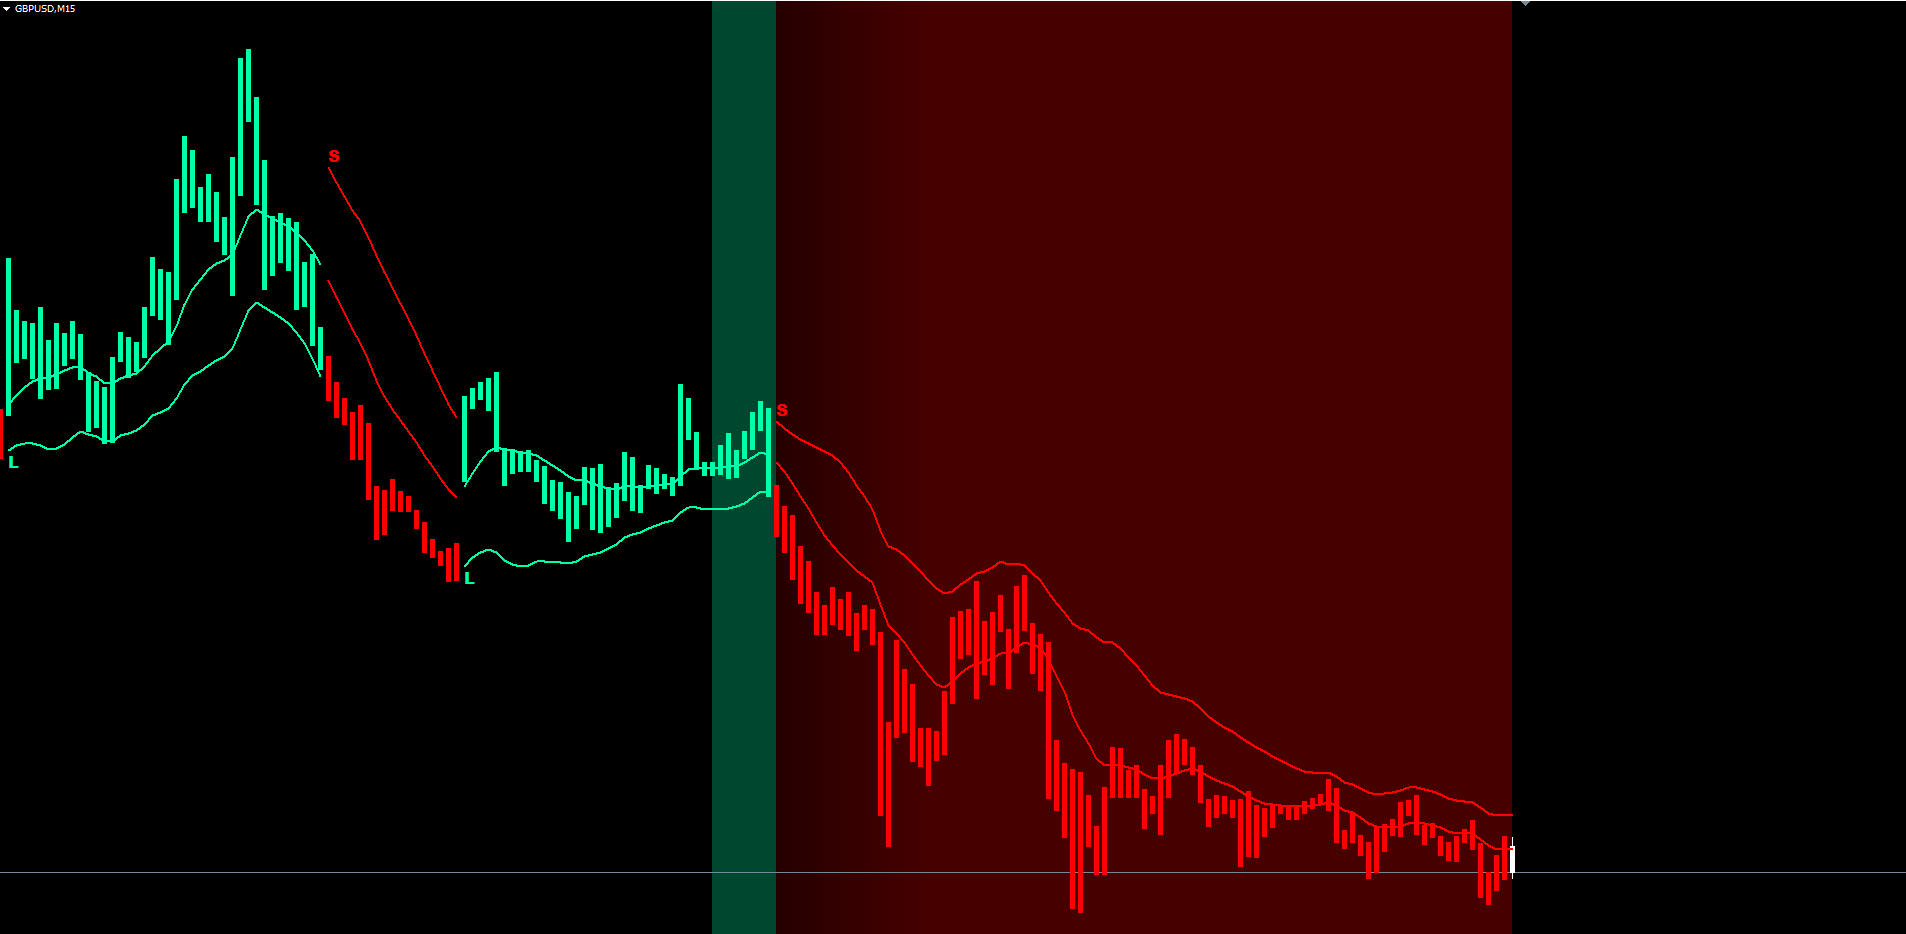
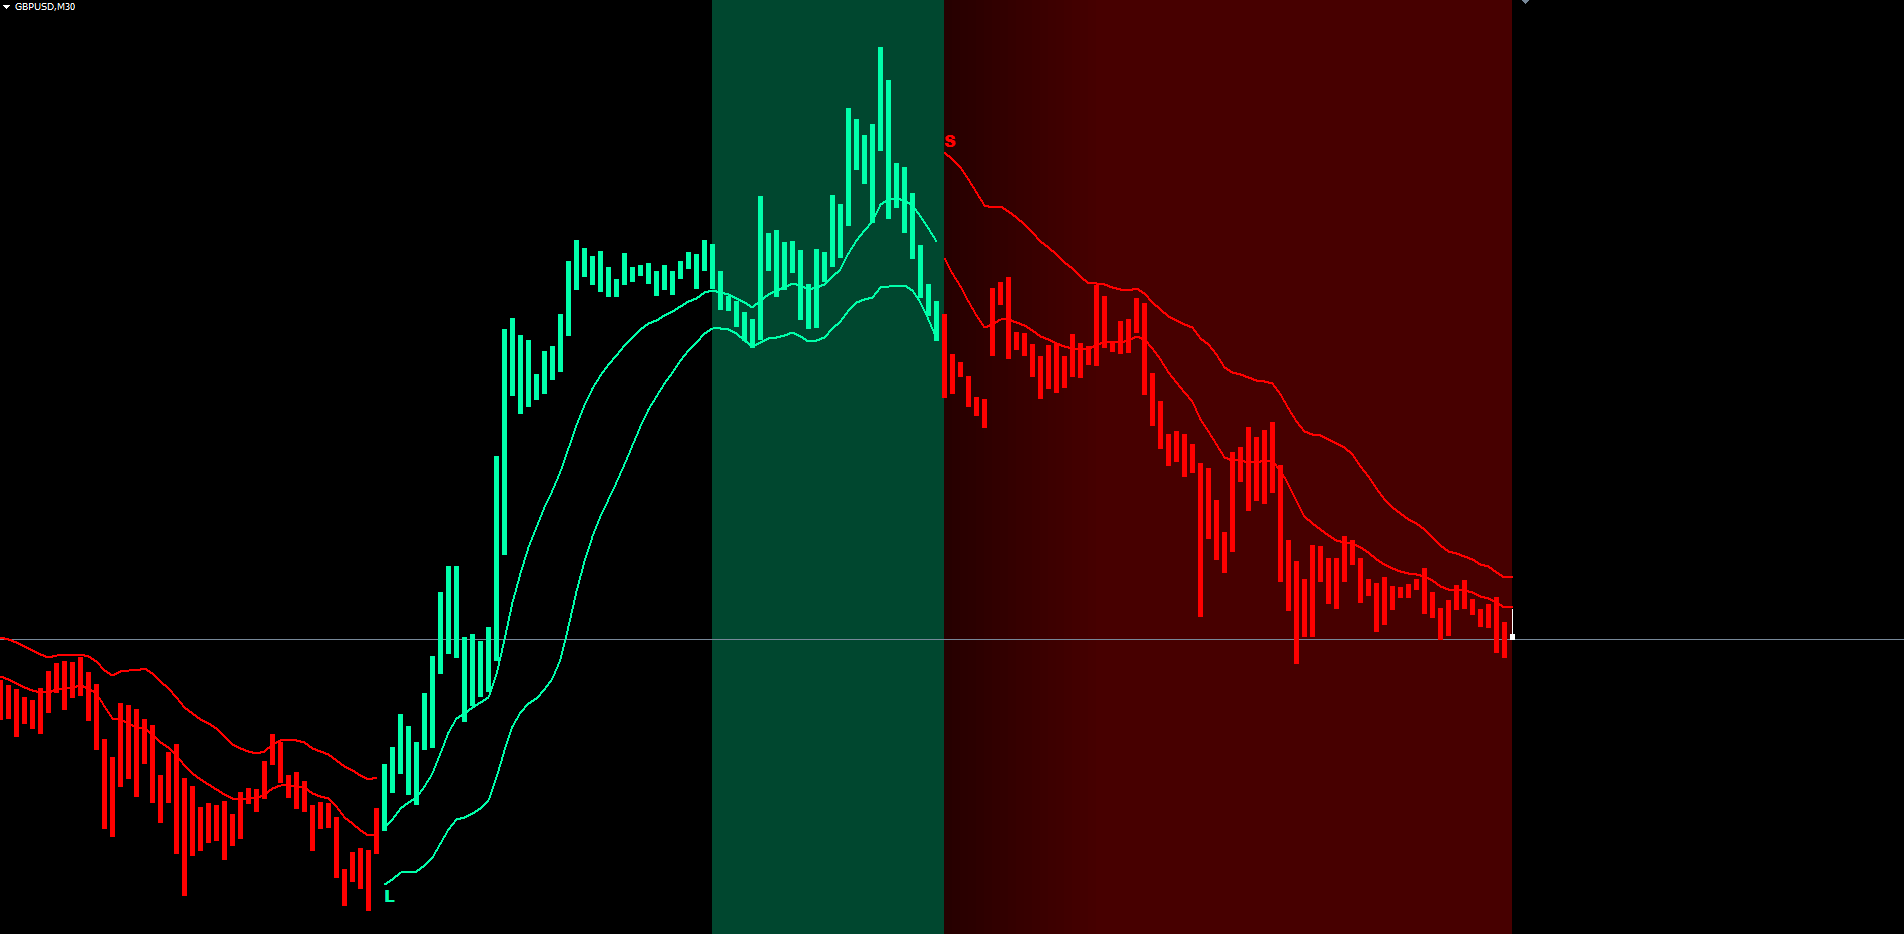
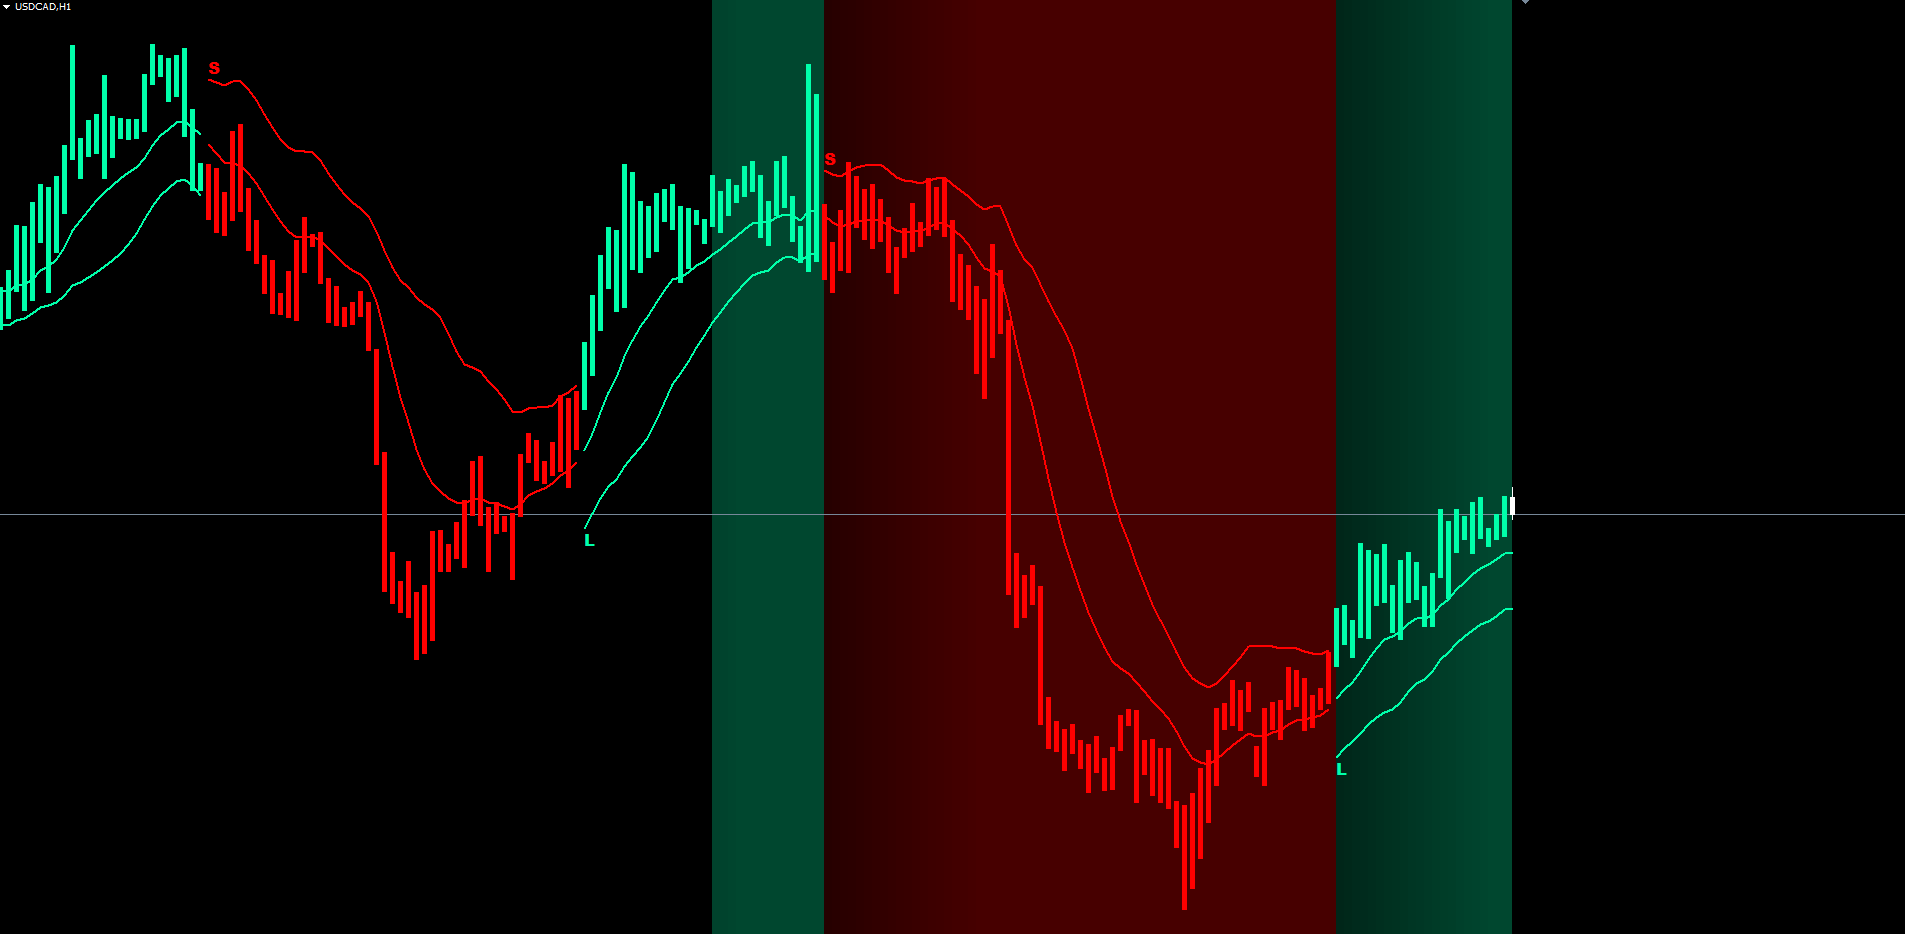
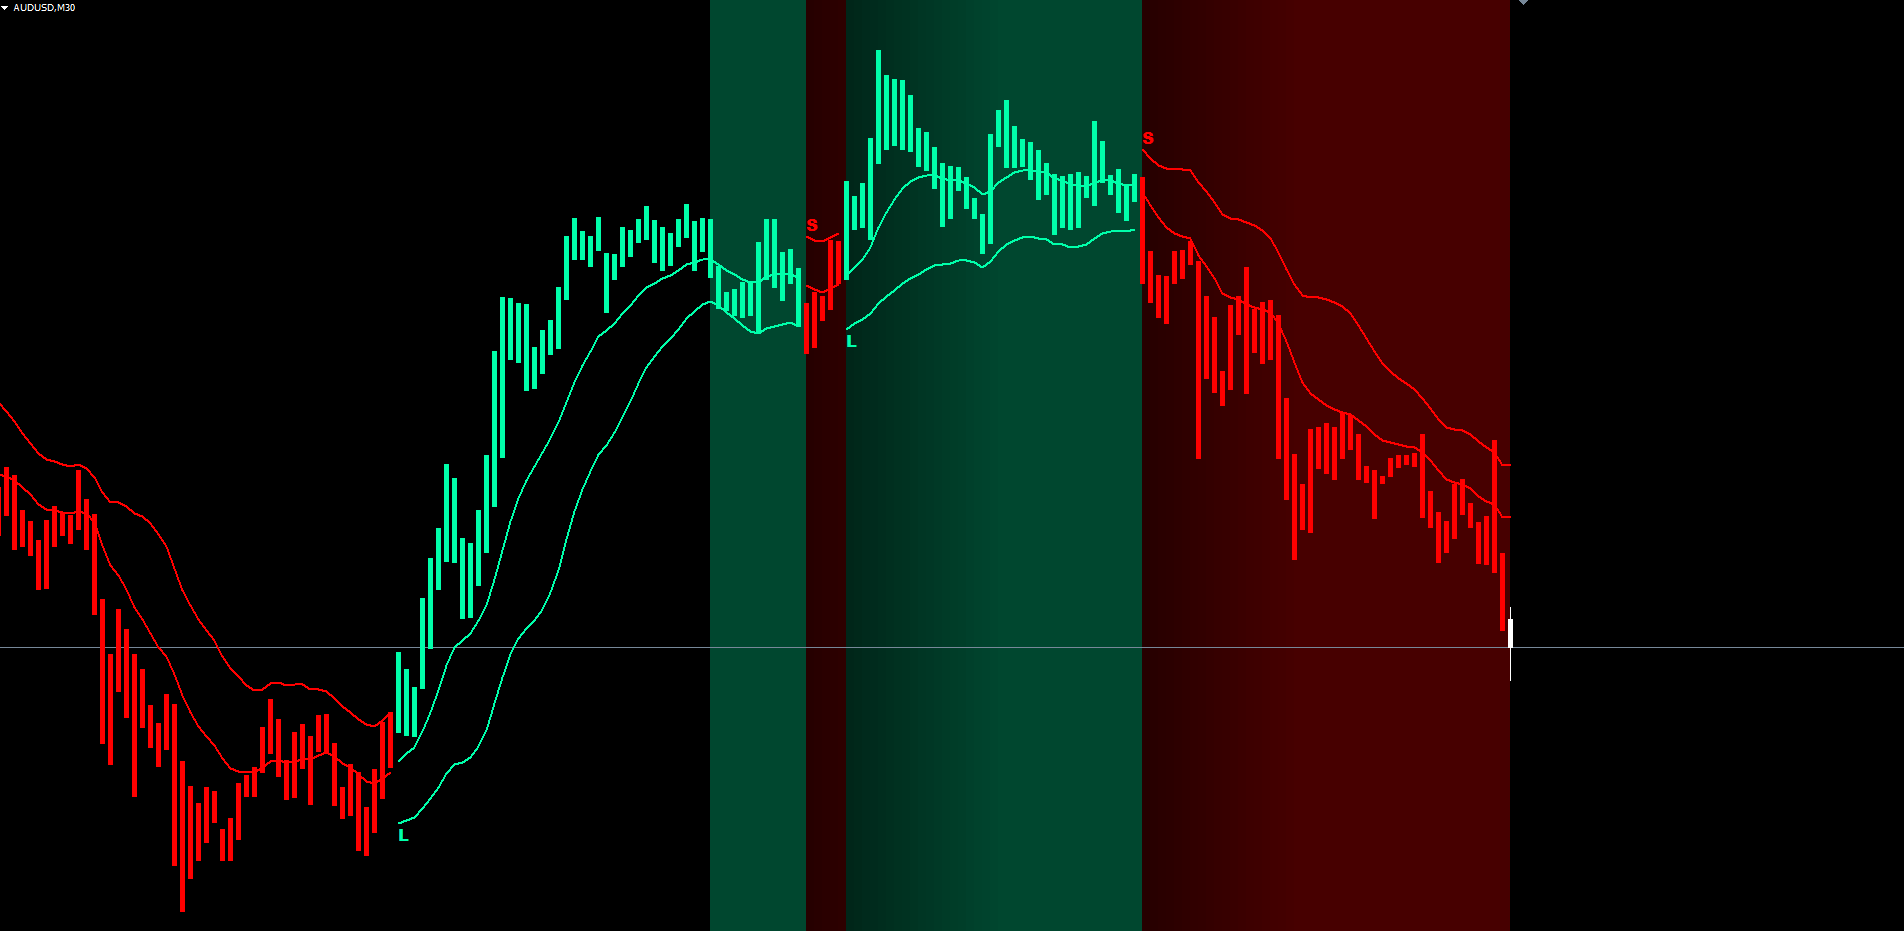
Basis line. The smooth, slowly curving line that runs through the middle of the cloud. Drawn in bull color during uptrends and bear color during downtrends. It represents the average flow of price after both the fast and slow EMAs have been combined and is the indicator's slowest-changing component.
Level line. Draws on the active sensitivity band: the lower band during uptrends, the upper band during downtrends. Drawn at the same width as the basis but offset toward the active band. The level line stair-steps as the band breathes and is the indicator's most actionable line; if price closes past it on the wrong side, the trend flips.
Cloud fill. A translucent fill drawn between basis and level using the DRAW_FILLING buffer style. The fill alternates between bull and bear colors automatically, depending on which buffer (basis or level) is on top, which corresponds directly to whether the trend is up or down. The cloud gives an immediate sense of how compressed or expanded the band structure is.
Paint bars. Every closed bar gets a colored vertical overlay matching the current trend, drawn via paired histogram buffers. In MT4 the overlay is rendered with two DRAW_HISTOGRAM buffers per color; in MT5 it uses DRAW_HISTOGRAM2. The visual effect is a thick colored line running through the bar, making the dominant trend obvious even on charts where the candle bodies are small.
Background gradient. Each bar gets a translucent rectangle drawn behind the candle, anchored from the chart top to the chart bottom. The opacity is computed from a per-bar intensity counter that starts at zero on every flip and ramps up by one per bar, capped at twenty. The opacity grows from 5 percent at intensity 1 to 20 percent at intensity 20, producing a calm tint on the first few bars of a new trend and a deep, saturated tint after twenty bars of sustained direction. The gradient gives traders an instant feel for trend persistence without having to count bars manually. The gradient is drawn on the most recent bars only (default 100), which respects the MT4 chart-object limit.
L and S text labels. Plain ASCII L (long) and S (short) characters in the trend color, placed at the level price on every confirmed trend flip. The labels are anchored to the bar's time and price, so they stay locked to the chart even as the user scrolls or zooms. ASCII characters are used (not Unicode mathematical italic) because ASCII renders correctly on every chart, every platform, and every font configuration.
The Alert System
Wave Breath Indicator ships with a complete alert package: four delivery channels, each independently toggleable, all triggered by the same event (a confirmed trend flip).
| Channel | Default | Parameter | Notes |
|---|---|---|---|
| Popup dialog | enabled | InpAlertPopup | MetaTrader's standard alert window |
| Mobile push | disabled | InpAlertPush | Requires MetaQuotes ID configured in Tools > Options > Notifications |
| disabled | InpAlertEmail | Requires SMTP configured in Tools > Options > Email | |
| Sound | disabled | InpAlertSound | Plays InpSoundLong on long flips, InpSoundShort on short flips |
A typical configuration for a desktop trader is to leave popup enabled and add either email or push for after-hours notifications. The indicator deduplicates alerts internally: each confirmed flip can fire its alerts at most once per bar timestamp, so volatile bars where price oscillates briefly will not generate spurious repeat alerts.
Alert messages include the symbol, the timeframe, the trade direction (LONG or SHORT), and the level price at the moment of the flip. A typical message looks like:
Wave Breath Indicator: LONG signal on EURUSD H1 @ 1.08542
This gives the trader enough context in a mobile push notification to identify the chart, the direction, and the relevant price level without needing to open MetaTrader immediately.
Non-Repainting Architecture
Repainting is one of the most damaging behaviors a trading indicator can exhibit. An indicator that quietly rewrites historical signals when new bars arrive looks perfect in screenshots and backtests but performs terribly in live trading because every signal in history was implicitly cherry-picked to the favorable price. Wave Breath Indicator was designed from the ground up to be strictly non-repainting.
The architecture has three pillars. First, the trend state machine processes only closed bars. The forming live bar mirrors the prior closed bar's plot values for visual continuity, but no state is committed for it; the underlying trend, level, and signal logic operate strictly on bars that have finalized. Second, every closed bar's trend value is committed exactly once. Once a bar is processed, its trend is not recomputed even if the indicator is reattached or the chart is reloaded. Third, signals fire on a strict bar-transition trigger: when a new bar appears at shift zero, the indicator checks the just-closed bar at shift one, compares its trend to the bar before it at shift two, and emits a signal only if the two differ.
A practical consequence is that each Wave Breath Indicator signal carries a one-bar settlement delay relative to the moment price first crosses the band. The indicator deliberately waits for the close to confirm the cross. For traders accustomed to repainting indicators, the first signals after switching to Wave Breath Indicator may feel slightly late, but those signals are guaranteed to be the same in real time as in backtest, with no surviving cherry-picked historical entries.
Practical Trading Workflow
The indicator's six visual components and four alert channels are most effective when used in a structured workflow. The sequence below is a recommended starting point that traders can adapt to their preferred style.
Step 1: Attach to a chart. Drag Wave Breath Indicator from Navigator > Indicators > Market onto any chart. Default parameters work on most major forex pairs, indices, commodities, and crypto on the M30, H1, and H4 timeframes. Allow the chart a moment to load history; the first attach scans all available bars to seed the trend state machine and emit historical labels.
Step 2: Identify the dominant trend. Read the basis line color, the cloud color, and the paint-bar color. All three should agree. The background gradient depth gives an immediate sense of trend persistence: a deep, saturated background means the current trend has held for at least twenty bars; a faint, almost transparent background means the trend just flipped and is still settling.
Step 3: Wait for a fresh L or S label. A new label marks the most recent confirmed flip. The label position shows the level price at the moment of the flip, which is a natural reference for stop-loss placement. Place the stop on the opposite side of the level (above for short trades, below for long trades) plus a small buffer that reflects current ATR and broker spread.
Step 4: Manage the trade with the level line. As the bars progress, the level line moves in the trend's favor: the lower band rises in uptrends and the upper band falls in downtrends. Many traders trail the stop along the level line, locking in profit as the trend extends.
Step 5: Exit on the opposite-color label. When the next opposite-color label appears, the indicator has detected a confirmed reversal. This is the natural exit signal for trend-following trades. Aggressive traders may exit earlier on a take-profit target, while patient traders may wait for the L or S label as the definitive close.
Step 6: Use alerts for set-and-forget monitoring. Enable mobile push or email alerts to be notified the moment a flip is confirmed on any of your watched charts. Combined with the non-repainting guarantee, this allows monitoring multiple instruments without sitting at the screen.
Timeframe Considerations
Wave Breath Indicator is timeframe-agnostic by design. The internal pipeline (typical price, EMA pair, smoothed volatility, sensitivity bands, trend latch) operates on whatever bars are present, so the indicator behaves consistently on M1, M5, M15, M30, H1, H4, D1, W1, and MN1.
On the lower timeframes (M1 to M15), trend flips are frequent and the level line moves quickly. Scalpers benefit from reducing the InpLength to 6 or 8 for an even faster basis. The background gradient saturates within a few minutes during sustained moves, giving a clear visual cue that a trend has staying power.
On medium timeframes (M30, H1, H4), the default parameters produce well-spaced flips that align with multi-hour swings. The cloud fill is typically 20 to 50 pips thick on EURUSD H1 and serves as a useful visual zone for stop placement. Most traders find this the sweet spot for the indicator.
On higher timeframes (D1, W1, MN1), flips are infrequent but each one tends to mark a structural shift in market direction. The indicator's non-repainting guarantee is especially valuable on these timeframes because each signal represents a multi-day or multi-week commitment.
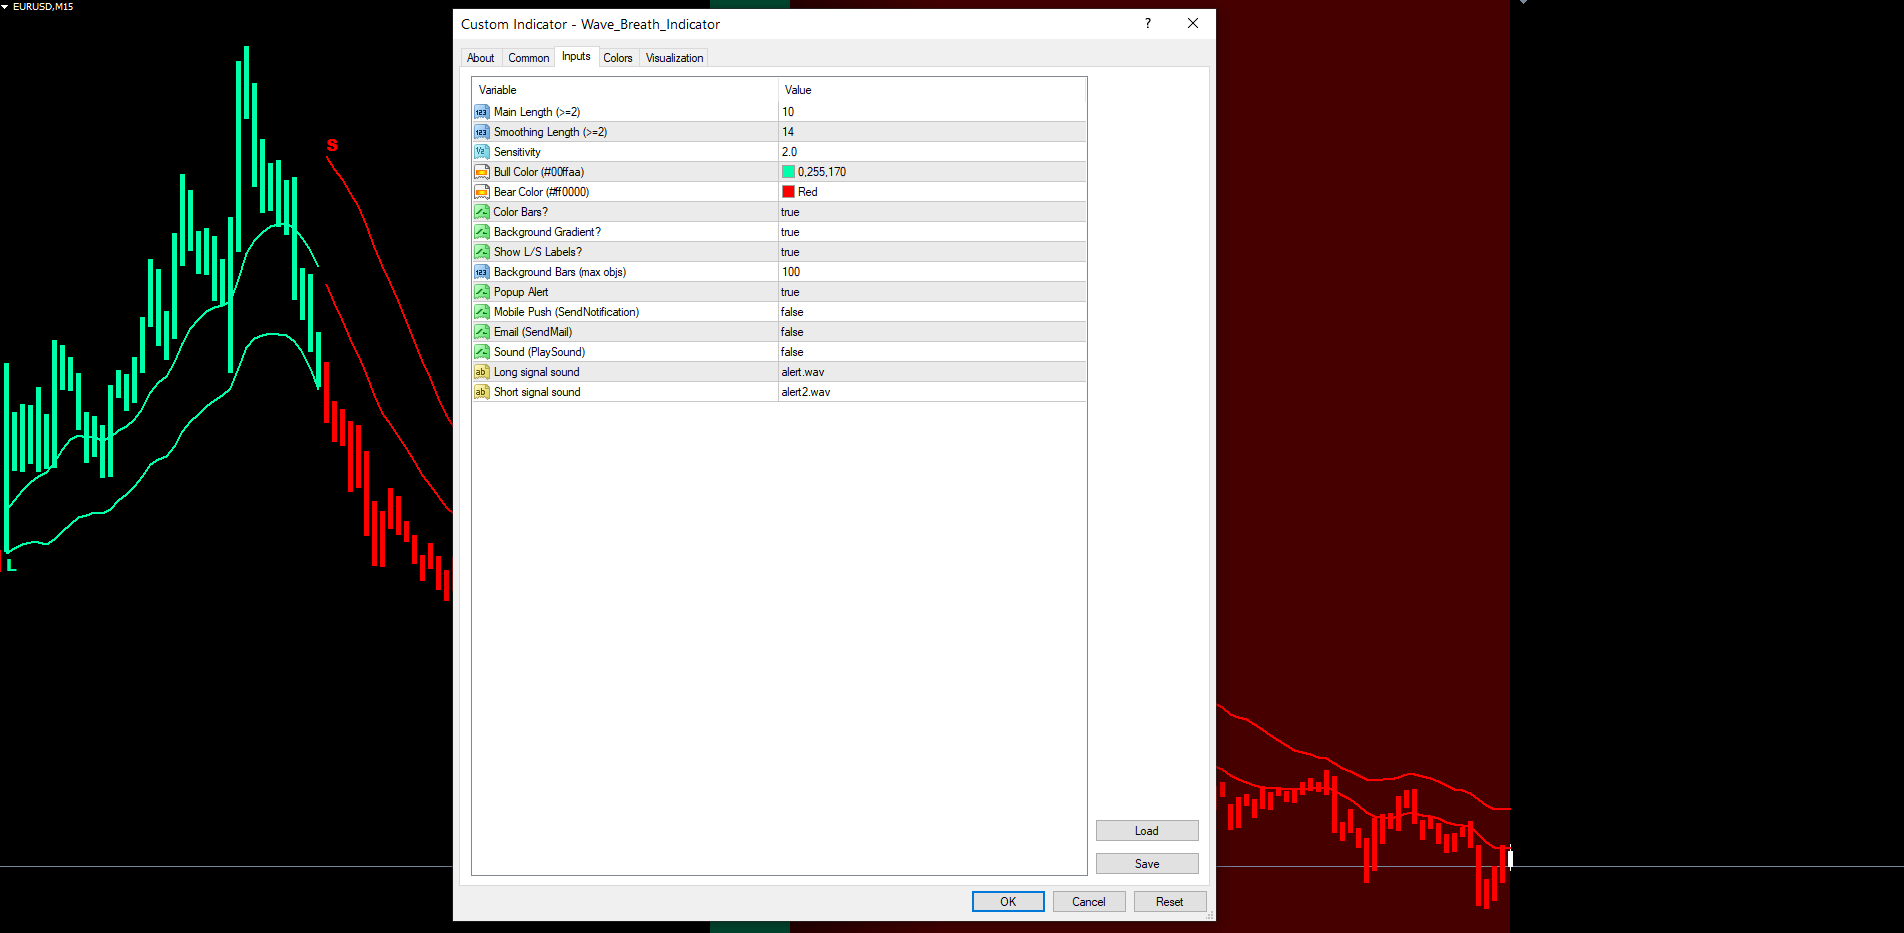
Parameter Reference
All inputs match the source code defaults. They are organized into three groups in the indicator settings dialog: Trend Settings, Visualization, and Alerts.
Trend Settings
| Parameter | Default | Description |
|---|---|---|
| InpLength | 10 | Main length for the EMA pair on the typical price (fast = length, slow = 2 x length). Minimum value 2. |
| InpSmoothLen | 14 | EMA length used to smooth the rolling volatility before band calculation. Minimum value 2. |
| InpSensitivity | 2.0 | Multiplier applied to smoothed volatility to size the sensitivity bands. Must be greater than zero. |
Visualization
| Parameter | Default | Description |
|---|---|---|
| InpBullColor | C'0,255,170' | Color used for bull basis, level, cloud, paint bars, and L labels |
| InpBearColor | C'255,0,0' | Color used for bear basis, level, cloud, paint bars, and S labels |
| InpShowBars | true | Paint candle bars in the active trend color |
| InpShowBg | true | Draw the per-bar background intensity gradient |
| InpShowSignals | true | Draw L (long) and S (short) text labels at trend flips |
| InpBgLookback | 100 | Number of recent bars on which the background gradient is rendered (1 to 500). The cap protects against the 512-object-per-chart limit on MT4. |
Alerts
| Parameter | Default | Description |
|---|---|---|
| InpAlertPopup | true | Show MetaTrader popup dialog on a confirmed flip |
| InpAlertPush | false | Send a push notification to the MetaTrader mobile app |
| InpAlertEmail | false | Send an email through the MetaTrader SMTP configuration |
| InpAlertSound | false | Play a sound file from the terminal Sounds folder |
| InpSoundLong | "alert.wav" | Sound file played for long signals |
| InpSoundShort | "alert2.wav" | Sound file played for short signals |
Recommended Configuration Profiles
Scalping (M5 to M15). Reduce InpLength to 7, InpSmoothLen to 10, InpSensitivity to 1.7. The basis becomes more reactive and the bands tighten, which produces more frequent flips that suit short-duration trades. Disable the background gradient (InpShowBg = false) on busy 1-minute charts to keep the canvas clean.
Default (M30, H1, H4). Use all default values. This profile balances responsiveness and signal quality on most major forex pairs, indices, commodities, and crypto. Enable popup and either push or email alerts.
Swing (D1, W1). Increase InpLength to 14, InpSmoothLen to 21, InpSensitivity to 2.5. The basis becomes smoother, the bands wider, and the trend latch more deliberate. Each flip on D1 or W1 represents a meaningful structural shift, so the slower configuration is appropriate.
Installation
Wave Breath Indicator is distributed through the MQL5.com Market and installs automatically after purchase.
- Purchase the indicator from the MQL5.com Market product page.
- The indicator downloads and installs automatically into MetaTrader.
- Open the Navigator panel (Ctrl+N) and expand the Indicators section.
- Find Wave Breath Indicator under Indicators > Market.
- Drag the indicator onto any chart.
- Adjust input parameters if needed, then click OK.
The indicator works on every timeframe and every instrument supported by your broker. No manual file copying is required. Both the MT4 and MT5 builds are supplied; the MQL5.com Market routes the correct binary to your terminal automatically.
For best results on first attach, allow the indicator a moment to scan history. The warmup is approximately InpLength * 5 bars of EMA stabilization plus the time needed to walk the trend state machine and emit historical L and S labels. After this initial pass, every subsequent tick processes incrementally with no measurable delay.
Conclusion
Wave Breath Indicator gives traders a clean, rule-based view of market direction built on three reinforcing layers: a smoothed dual-EMA basis on the typical price, volatility-scaled sensitivity bands that breathe with market activity, and a stateful trend latch that only flips on a confirmed close through the opposite band. The visual layer (bicolor basis, level line, cloud fill, paint bars, intensity background, L and S labels) communicates the current state of all three layers at a single glance. The alert system makes monitoring effortless across multiple instruments. The non-repainting architecture ensures every signal a trader sees in backtest matches what would have been seen in real time.
The indicator is designed for traders who want a structured, repeatable approach to trend-following across forex, indices, commodities, and crypto. It performs well on M30, H1, and H4 timeframes with default settings and adapts cleanly to lower or higher timeframes through the InpLength and InpSmoothLen parameters. The full input set is configurable, allowing the indicator to be tuned from fast-reactive scalping configurations to slow, deliberate swing setups.
Whether used as a primary trend filter, a confirmation tool alongside other analysis methods, or a signal source in its own right, Wave Breath Indicator provides a foundation for disciplined, rules-based trading. Both MT4 and MT5 builds are included and produce identical output, so the workflow you develop on one platform transfers directly to the other.
Download the indicator:
- MetaTrader 5: Wave Breath MT5
- MetaTrader 4: Wave Breath MT4
CONTACT & SUPPORT
- Email: info@forexobroker.com
- Questions: Use the Comments section on the product page or send a private message
- Bug Reports: Please include your broker name, account type, and a screenshot
-
✅ All MQL Tools: https://www.mql5.com/en/users/forexobroker/ ✅
--------------------------------------------------------------------------------------------------------------
🏦 **Broker I use**: https://icmarkets.com/?camp=55869
🏦 **Broker For EU Traders I use 1**: https://www.ictrading.com?camp=91414
🏦 **Broker I use 2**: https://one.exnessonelink.com/boarding/sign-up/a/c_thuv62ocfq
💻 **VPS**: https://chocoping.com/processing/aff.php?aff=738
💼 **Companies I use for getting funded**:
Fundednext: https://fundednext.com/?fpr=kestutis39
The5ers: https://www.the5ers.com/?afmc=16kl
FTMO: https://trader.ftmo.com/?affiliates=nRAyOhmFRnEnFdOpdLeh
Risk Disclaimer
Trading foreign exchange and CFDs on margin carries a high level of risk and may not be suitable for all investors. You may sustain a loss exceeding your initial investment. Trend Quorum is a technical analysis tool and does not guarantee profitable trades. Past performance is not indicative of future results. The authors accept no liability for any loss arising from use of the indicator. By using Trend Quorum you acknowledge sole responsibility for your trading decisions.


