

Wolf Blackout Trader — User Manual & Installation Guide
Introduction
The Wolf Blackout Trader indicator is a non-repainting trend-and-reversal trading system for MetaTrader 4 and MetaTrader 5. It combines a Dual Range Filter engine (fast length 32 + slow length 89), a 5-layer confluence scoring system that grades every signal from 1 to 5 stars, an independent Reversal Detector running on a long-period RSI with EMA-of-RSI confirmation, a 5-tier TP ladder with partial-hit tracking, signature "blackout" tinted bars, a 22-row pixel-anchored dashboard, a multi-timeframe trend row spanning M5 through Daily, and a native MetaTrader alert package covering all 8 trade-lifecycle events (BUY, SELL, TP1–TP5, SL) across four delivery channels (popup, sound, mobile push, email).
This manual covers installation, attachment, every input group with parameter tables, reading the chart and dashboard, configuring the 8 alert events across the 4 native MetaTrader channels, and troubleshooting.
Download the indicator:
- MetaTrader 5: Wolf Blackout Trader MT5
- MetaTrader 4: Wolf Blackout Trader MT4
TIP: Wolf Blackout Trader works on every symbol and every timeframe available in MetaTrader. H1 and above produce higher-quality signals; M5–M15 are well-suited for scalping. Tune the minimum-confluence input to control signal frequency.
Installation Guide
Wolf Blackout Trader is distributed through the MQL5.com Market. Installation is fully automatic — there are no files to download, copy, or paste anywhere. The MetaTrader terminal handles the entire process once you complete the purchase.
Step 1 — Purchase from MQL5.com Market
- Visit the Wolf Blackout Trader product page on MQL5.com
- Choose the MetaTrader 4 version or the MetaTrader 5 version (or both — they are sold as separate listings)
- Click Buy and complete the purchase via your MQL5.com account
- MQL5.com confirms the purchase and links the product to your account
IMPORTANT: Do not look for files to download. The MQL5.com Market handles all file placement and updates automatically. You will never receive a .ex4, .ex5, .mq4, .mq5, or .zip file by email — the product is delivered directly inside the terminal.
Step 2 — Find in Navigator (Indicators > Market)
- Open MetaTrader 4 or MetaTrader 5
- Confirm you are logged into your MQL5.com account via Tools > Options > Community
- Press Ctrl+N to open the Navigator panel (if not already visible)
- Expand Indicators > Market
- Find Wolf Blackout Trader in the list
If the indicator does not appear in Indicators > Market immediately after purchase, restart MetaTrader. The Market section of Navigator refreshes on terminal start.
If after restart the indicator still does not appear:
- Check View > Toolbox > Journal tab for any error messages
- Verify your MQL5.com login under Tools > Options > Community
- Confirm the purchase appears in your MQL5.com account purchase history
Step 3 — Drag onto Chart and Configure Inputs
- Drag the Wolf Blackout Trader entry from the Navigator onto any chart
- The input dialog opens automatically
- Review or adjust the inputs (defaults are tuned for H1 swing trading on FX majors)
- Click OK to attach
The indicator immediately begins drawing the Range Filter line, blackout-tinted candles, historical signals, SL/TP lines for any active trade, and the 22-row dashboard in the chosen corner.
To remove the indicator, right-click on the chart > Indicators List > select Wolf Blackout Trader > Delete.
To detach all indicators at once (e.g., to start with a clean chart), use the keyboard shortcut Ctrl+I to open the indicators list and remove items individually.
First Impression on the Chart
When you attach Wolf Blackout Trader with default inputs, you will immediately see several visual elements appear:
- Range Filter line — a stair-stepped line running through the candles, colored mint in bullish regimes and red in bearish regimes
- Blackout-tinted candles — every candle painted mint (during up-streaks), red (during down-streaks), or gray (during transition zones)
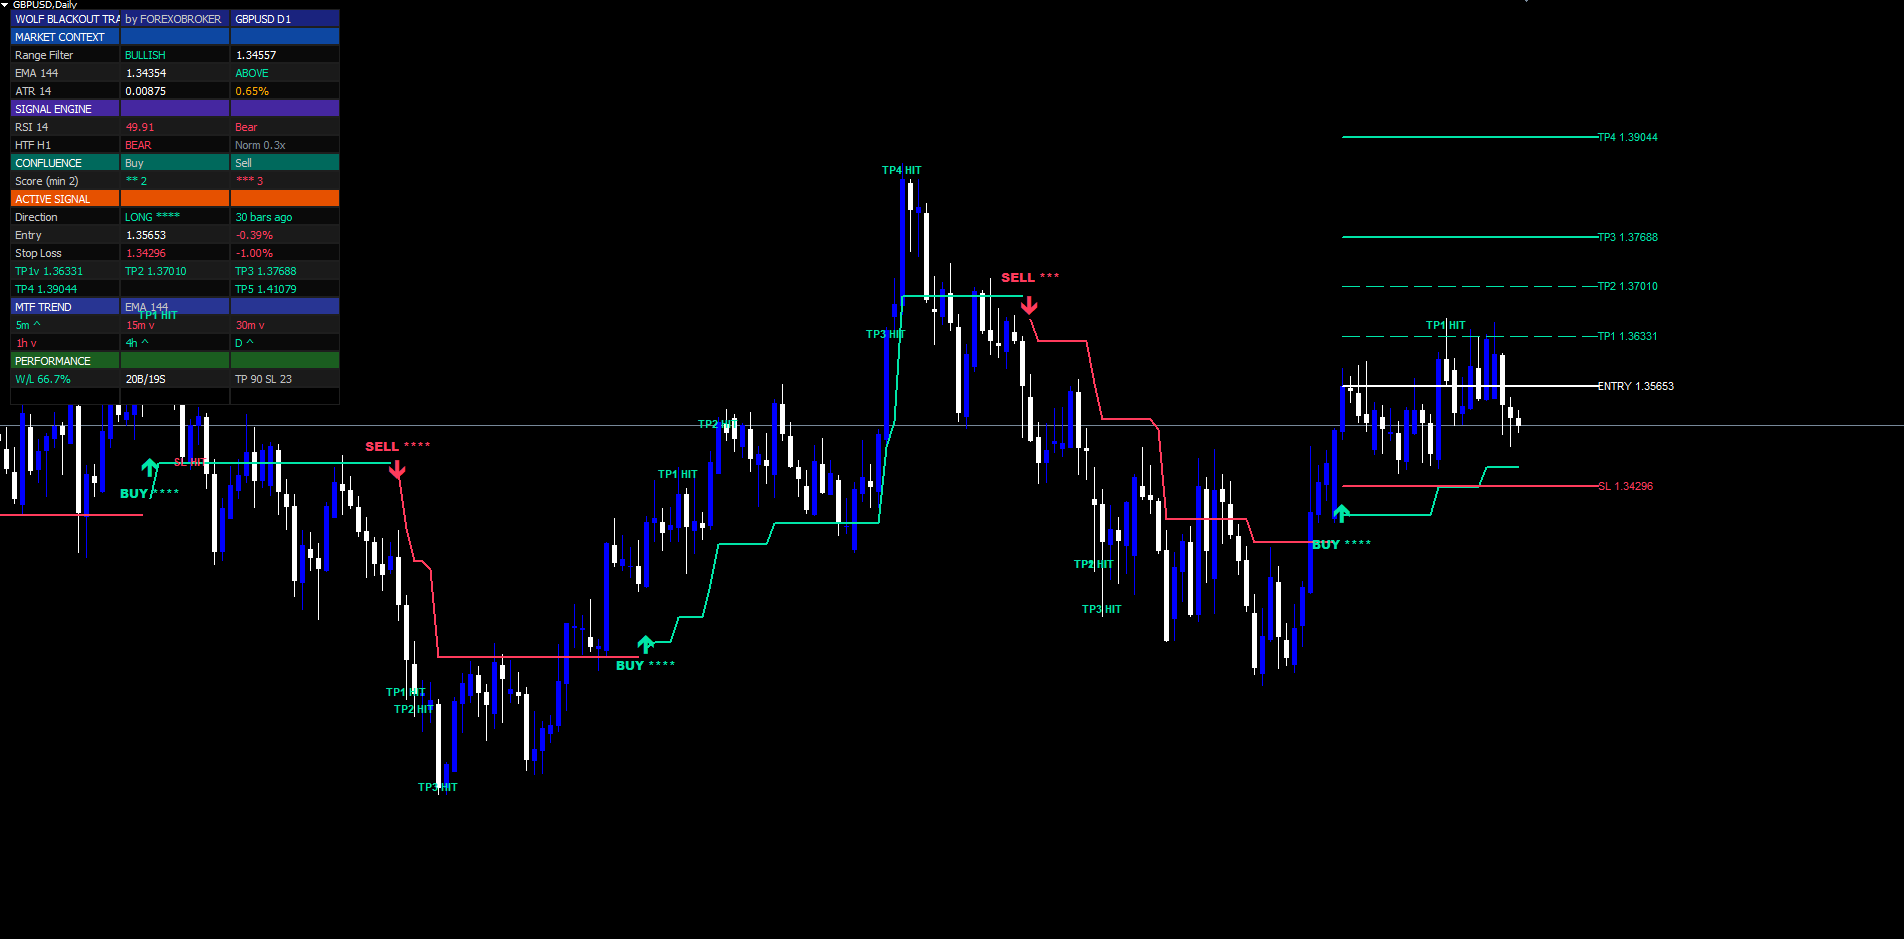
- Historical BUY/SELL signal labels — every confirmed signal in the visible history is drawn as a colored arrow + label like BUY ▲ ★★★★ or SELL ▼ ★★★
- Reversal diamond markers — small mint diamonds below bars where RSI(28) hit oversold, and red diamonds above bars where RSI(28) hit overbought
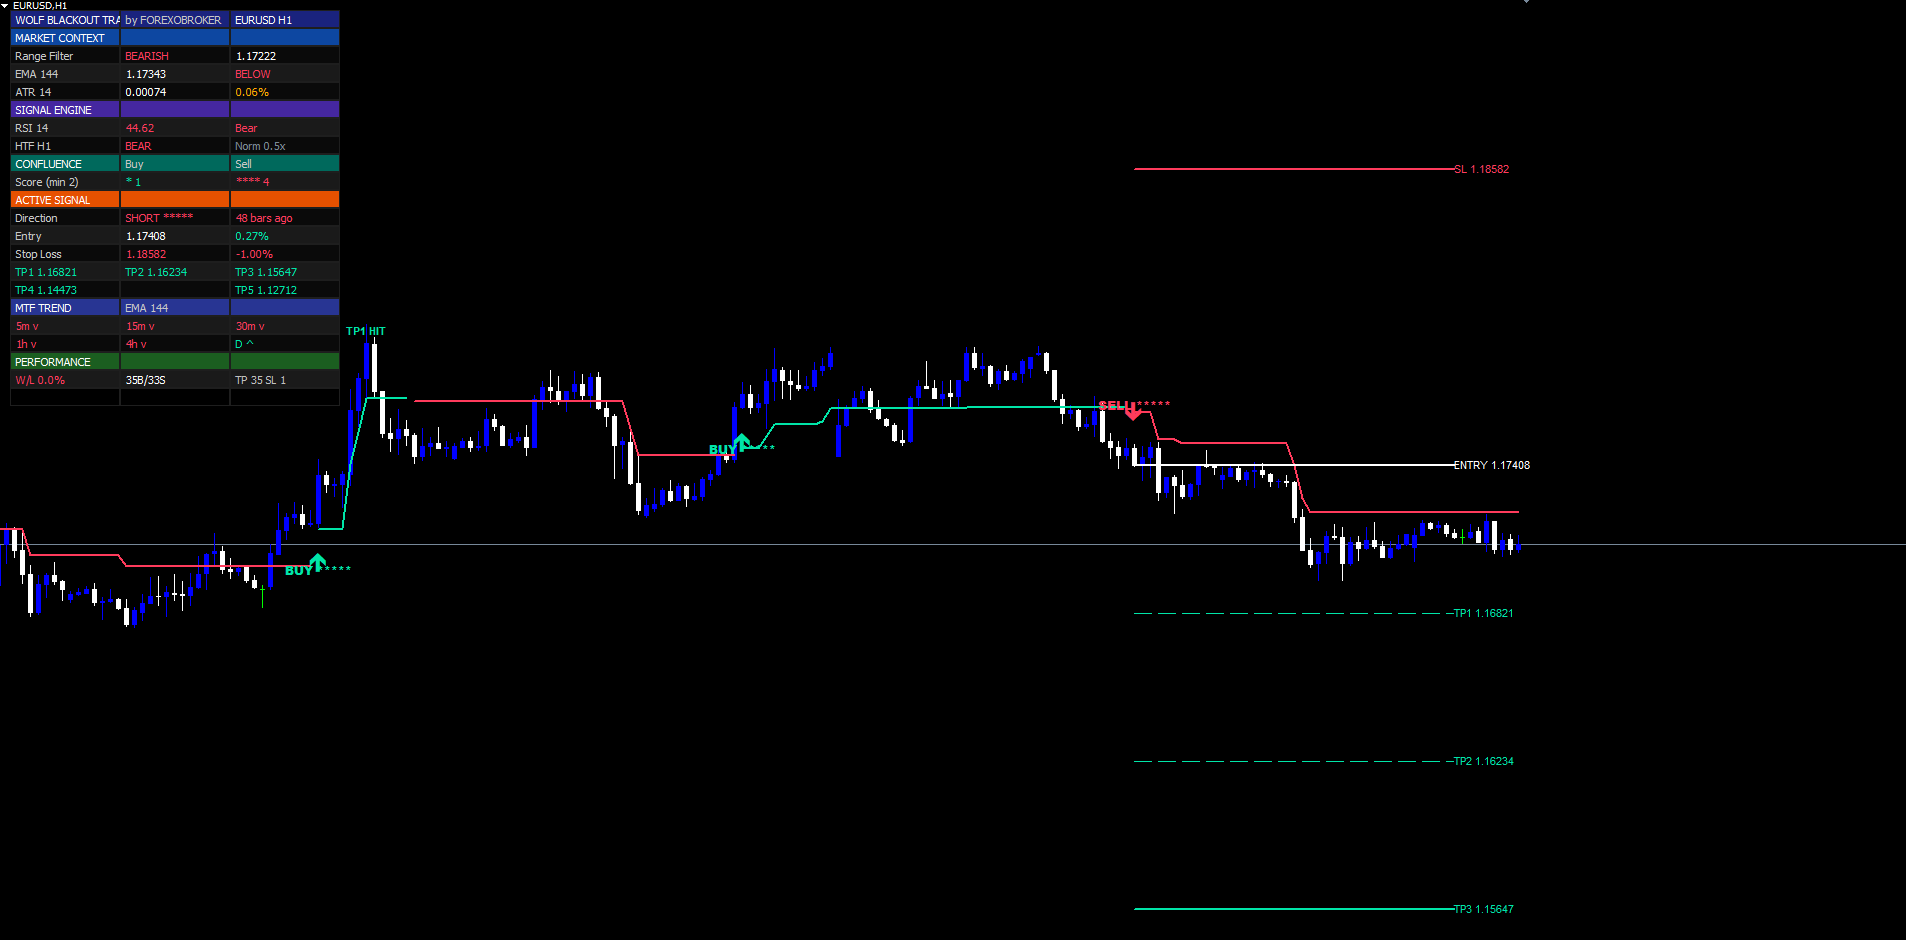
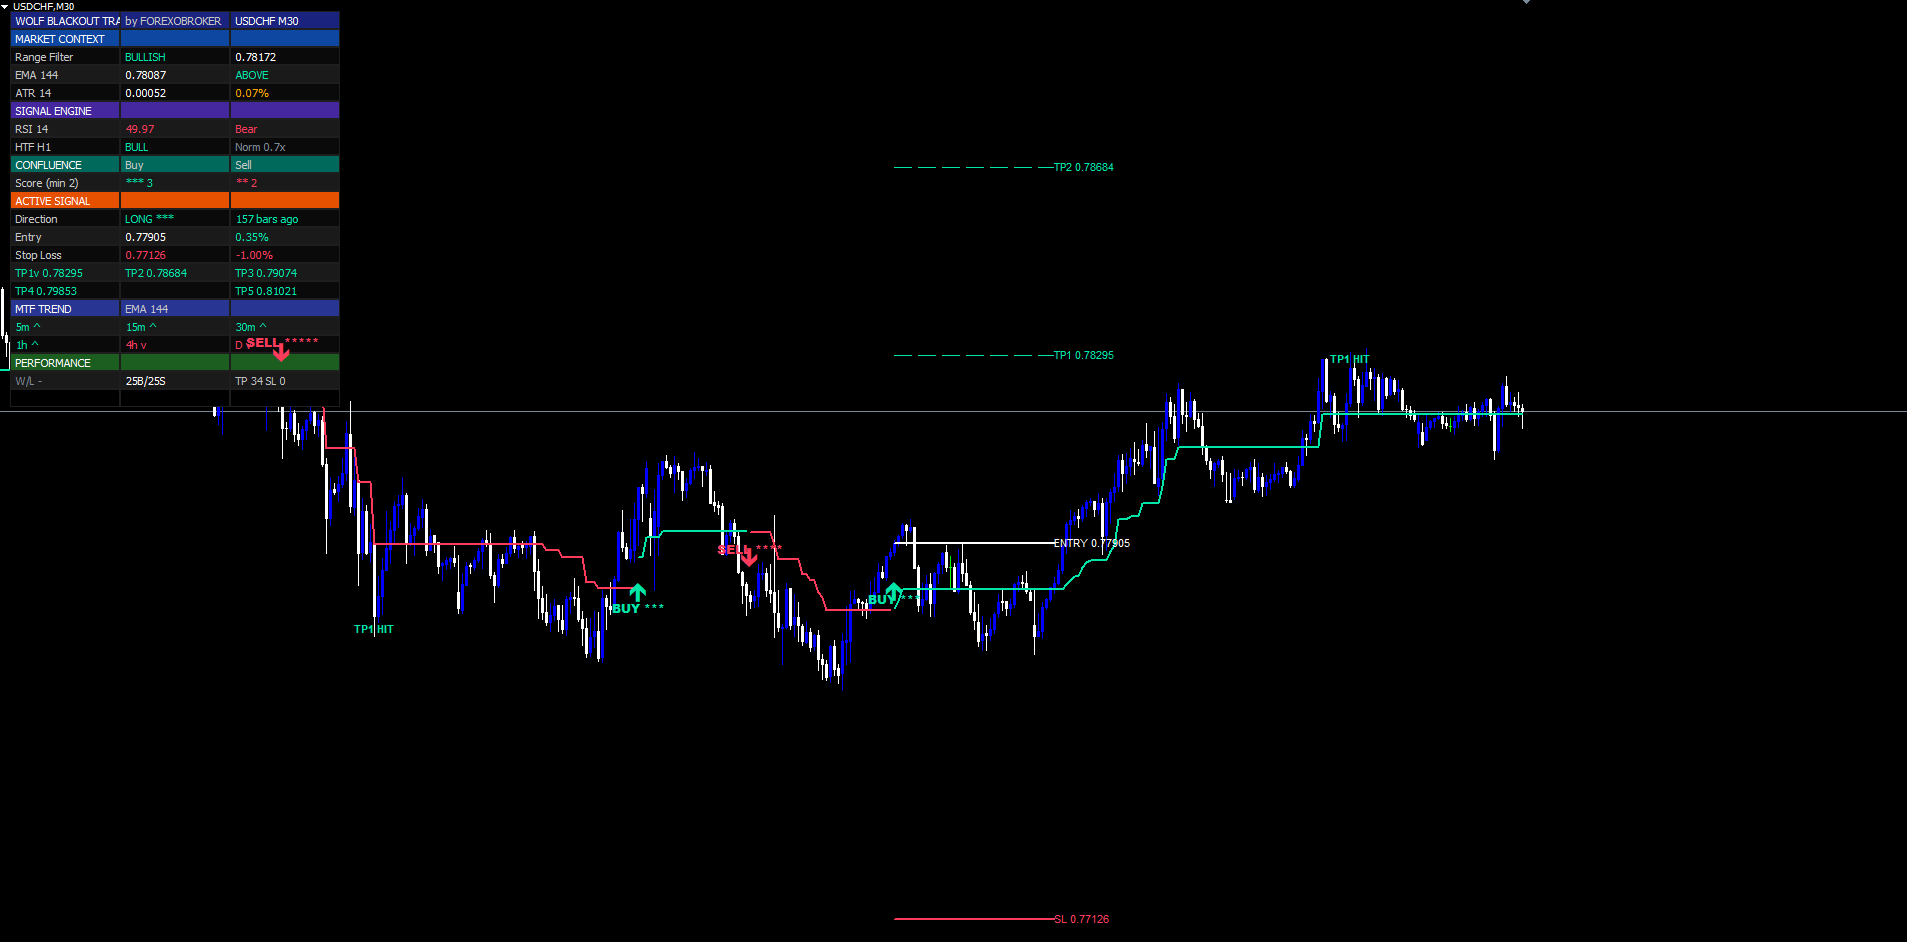
- 22-row dashboard in the top-right corner showing live trend, signal, confluence, MTF, and performance state
- SL and 5 TP horizontal lines — visible only if a trade is currently active (the most recent signal has not yet hit SL or TP5)
If a trade is currently active, the dashboard's Active Signal section displays the entry price, SL, TP1, TP2, TP3, TP4, and TP5 prices with live P&L and hit status. The matching six horizontal lines extend forward from the signal bar by 40 bars (configurable via extendBars ).
The chart can feel busy on first attachment, especially on a symbol with several months of history. If you want a cleaner view:
- Toggle off bar coloring with colorBars = false to keep MetaTrader's default candle colors
- Toggle off the Range Filter line with showFilter = false
- Toggle off SL/TP lines with showSLTP = false
- Toggle off the dashboard with showDash = false
- Toggle off reversal diamonds with showReversal = false
Each visual element has an independent on/off switch in the inputs, so you can build exactly the view you want.
Reading the Signal Labels
A signal label combines three elements:
- Arrow glyph — ▲ for BUY (placed below the bar low) or ▼ for SELL (placed above the bar high), colored mint for buys and red for sells. The arrow style is configurable via buyLblStyle / sellLblStyle — options include BUY ▲ , 🟢 BUY , BUY , or ↑ LONG , and the symmetric set for sells.
- Star rating — between one and five stars ( ★ to ★★★★★ ) showing the confluence score. The minimum allowed score before drawing is set by minConfluence (default 2 stars).
- Tooltip — hover the label and a popup shows the full trade specification: entry price, SL price, all five TP prices, the confluence score breakdown by layer (which of Range/RSI/EMA/HTF/Vol passed), and the bar timestamp.
Star count interpretation:
| Stars | Confluence | Meaning |
|---|---|---|
| ★ | 1 of 5 | Range Filter trigger only; all other filters off or failed |
| ★★ | 2 of 5 | Default minimum threshold; balanced for swing trading |
| ★★★ | 3 of 5 | Strong setup, momentum and trend agreement |
| ★★★★ | 4 of 5 | Very strong, only one filter missed |
| ★★★★★ | 5 of 5 | Extremely rare; every filter aligned |
Higher star counts produce fewer signals but better historical hit ratios. The optimal star count for your trading style depends on your market, timeframe, and risk tolerance — most discretionary traders settle on a 2-star or 3-star minimum after a week of demo testing.
The 22-row dashboard's Confluence section shows the live buy-score and live sell-score updating on every tick. You can watch the score build in real time before a signal fires, and use that to anticipate entries.
Input Parameter Groups
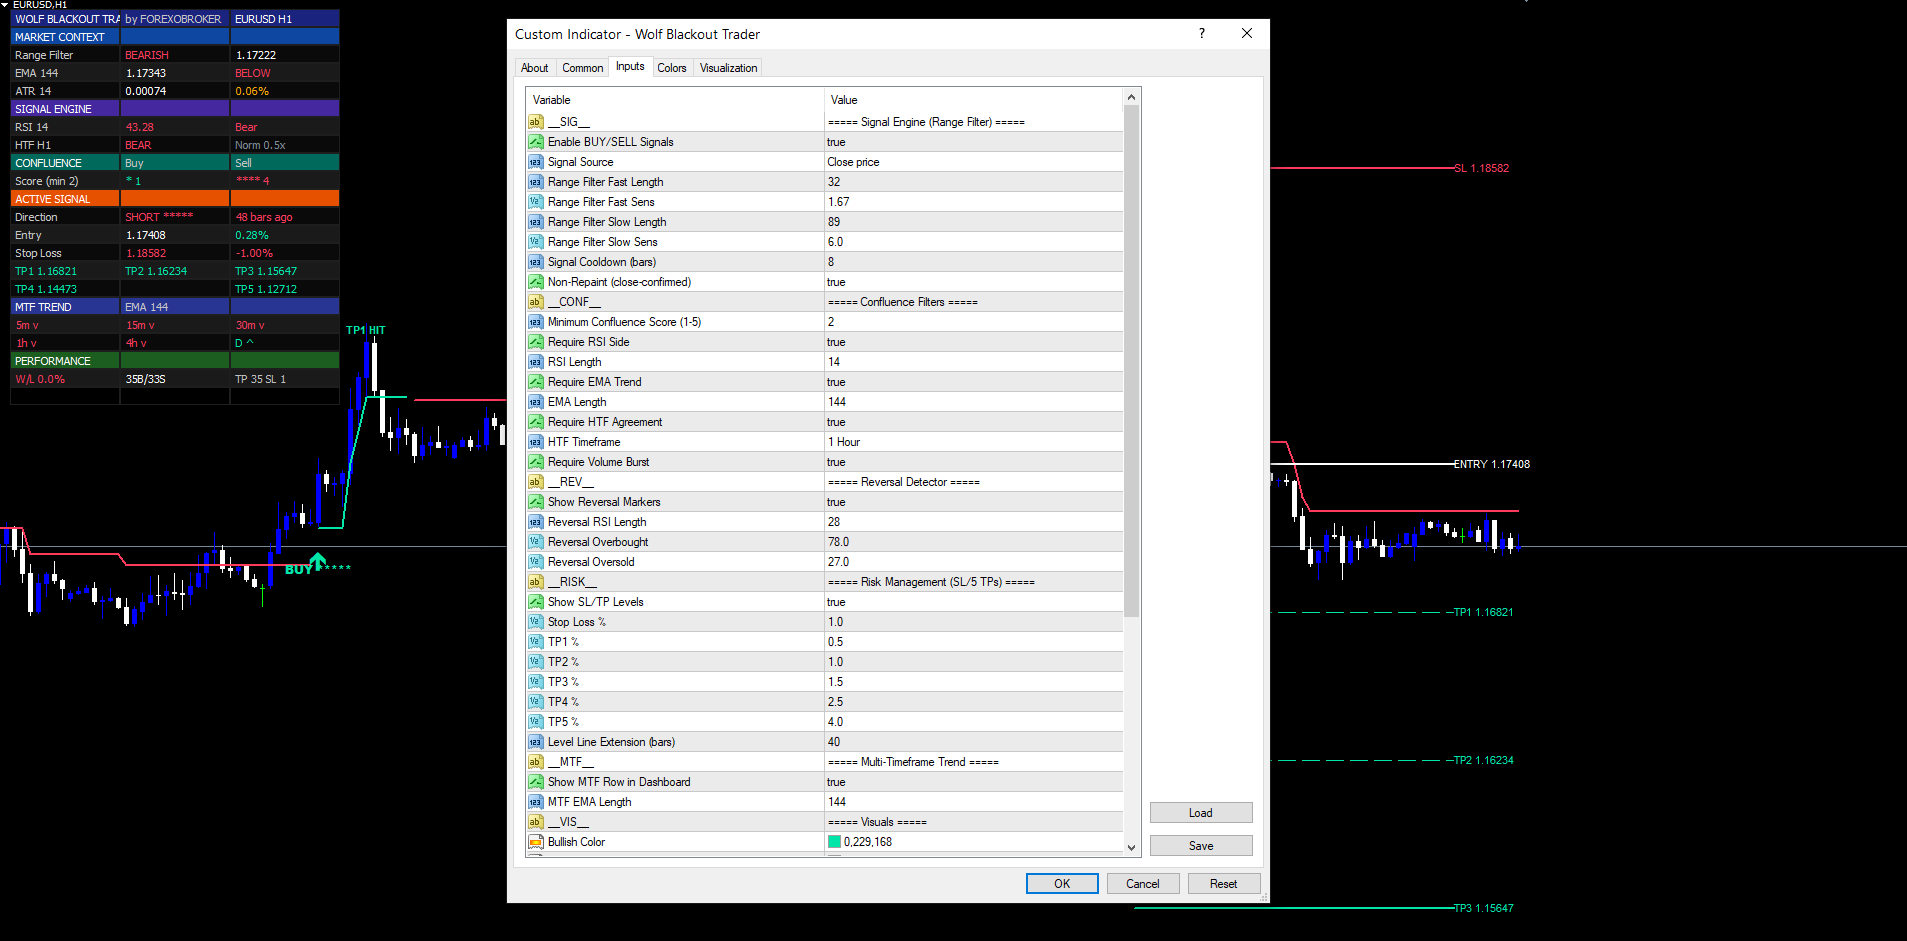
The input panel is organized into eight sections, each with a group header in the MetaTrader inputs dialog.
Signal Engine (Range Filter)
Core triggers for buy/sell signal detection.
| Input | Default | Description |
|---|---|---|
| enableSignals | true | Master on/off switch for BUY/SELL signal generation |
| src | close | Applied price for the Range Filter (close, open, high, low, hl2, hlc3) |
| fastLen | 32 | Fast Range Filter length (1–200) — early trend detection |
| fastSens | 1.67 | Fast Range Filter sensitivity (0.1–5.0) — band-width multiplier |
| slowLen | 89 | Slow Range Filter length (1–200) — dominant regime |
| slowSens | 6.0 | Slow Range Filter sensitivity (0.1–20.0) |
| signalCooldown | 8 | Minimum bars between same-direction signals (1–200) |
| nonRepaintMode | true | When ON, signals fire only on bar close; OFF allows intra-bar |
Increase fastLen and slowLen together to slow the filter and reduce signal frequency. Decrease them to speed up. Keep the ratio roughly fast:slow ≈ 1:3 for balanced behavior.
Confluence Filters
The five layers that score each Range Filter trigger.
| Input | Default | Description |
|---|---|---|
| minConfluence | 2 | Minimum confluence score to draw a signal (1–5) |
| useRsiConfirm | true | Require RSI side agreement (RSI>50 for BUY, RSI<50 for SELL) |
| rsiLen | 14 | RSI length for confluence (2+) |
| useEmaConfirm | true | Require close on correct side of EMA |
| emaLen | 144 | EMA length for trend confluence (10+) |
| useHtfConfirm | true | Require higher-timeframe EMA agreement |
| htfRes | 60 | HTF timeframe (Pine notation: "5", "15", "60", "240", "D") |
| useVolConfirm | true | Require volume burst (volume ≥ SMA20) |
Disable any layer to award a free point in scoring — but remember the minimum-confluence value must still reflect your true strictness. Disabling 3 of 5 layers means a "2-star" signal is effectively a 1-of-2 signal in real-world stringency.
Reversal Detector
Independent detector for RSI extremes (separate from main pipeline).
| Input | Default | Description |
|---|---|---|
| showReversal | true | Draw reversal diamond markers |
| revRsiLen | 28 | Reversal RSI length (longer than confluence RSI) |
| revOb | 78.0 | Overbought threshold for SELL reversal |
| revOs | 27.0 | Oversold threshold for BUY reversal |
Reversal markers do not contribute to the main signal count, do not draw SL/TP, and do not increment win/loss counters. They are pure visual cues showing where RSI exhaustion is signaled.
Risk Management (SL / 5 TPs)
Percentage-based stop loss and 5-tier take-profit ladder.
| Input | Default | Description |
|---|---|---|
| showSLTP | true | Draw SL and 5 TP lines on chart |
| slPct | 1.0 | Stop loss percentage from entry (0.05–20.0) |
| tp1Pct | 0.5 | TP1 percentage from entry |
| tp2Pct | 1.0 | TP2 percentage from entry |
| tp3Pct | 1.5 | TP3 percentage from entry |
| tp4Pct | 2.5 | TP4 percentage from entry |
| tp5Pct | 4.0 | TP5 percentage from entry |
| extendBars | 40 | How many bars forward to extend SL/TP lines (5–500) |
For crypto and high-volatility instruments, scale all percentages up (e.g., 2.0 / 1.0 / 2.0 / 3.0 / 5.0 / 8.0). For low-volatility FX crosses, scale down (0.5 / 0.25 / 0.5 / 0.75 / 1.25 / 2.0).
Multi-Timeframe Trend
The MTF row on the dashboard.
| Input | Default | Description |
|---|---|---|
| showMtf | true | Show MTF trend row in dashboard |
| mtfEmaLen | 144 | EMA length applied across all 6 timeframes |
The six timeframes are fixed: M5, M15, M30, H1, H4, D1. The EMA length is shared across them. Each cell shows ▲ (or ^ in MetaTrader builds) in mint when close>EMA on that timeframe, or ▼ ( v ) in red when close<EMA.
Visuals
Colors and label styling.
| Input | Default | Description |
|---|---|---|
| bullCol | #00E5A8 (mint) | Bullish color for signals, bars, MTF arrows, TP lines |
| bearCol | #FF3B5C (red) | Bearish color for signals, bars, SL line |
| neutralCol | #7C8895 (gray) | Neutral color for transition bars |
| colorBars | true | Paint candles by trend regime (blackout effect) |
| showFilter | true | Plot the Range Filter line on chart |
| buyLblStyle | BUY ▲ | BUY label glyph (4 options) |
| sellLblStyle | SELL ▼ | SELL label glyph (4 options) |
The brand colors are indigo ( #1A237E ) for dashboard header backgrounds plus mint and red for bullish/bearish elements. Keep the defaults unless you have a specific visual preference — the colors are tuned for the near-black #0A0F1E chart background many traders use.
Dashboard
Pixel-anchored dashboard widget.
| Input | Default | Description |
|---|---|---|
| showDash | true | Show the dashboard widget |
| dashPos | Top Right | Corner anchor: TR / TL / MR / ML / BR / BL |
| dashSize | Tiny | Font scale: Tiny / Small / Normal / Large |
| dashAcc | #1A237E (indigo) | Dashboard header background color |
The dashboard reflows for each size — cell widths scale with font size so the layout reads cleanly at every scale. Use Tiny for tight chart layouts (e.g., quad-chart MultiCharts setups), Large for single-chart standalone viewing.
Alerts
8 trade-lifecycle events, 4 native MetaTrader delivery channels.
| Input | Default | Description |
|---|---|---|
| InpEnableAlerts | true | Master on/off for all alerts |
| InpAlertPopup | true | MetaTrader popup dialog via Alert() |
| InpAlertSound | true | Play sound file via PlaySound() on every event |
| InpAlertPush | false | Mobile push via SendNotification() (requires MetaQuotes ID) |
| InpAlertEmail | false | Email via SendMail() (requires SMTP set up in Tools > Options > Email) |
| InpAlertSound1 | "alert2.wav" | Sound file path — any .wav under Terminal/Sounds |
The 8 events (BUY, SELL, TP1 HIT, TP2 HIT, TP3 HIT, TP4 HIT, TP5 HIT, SL HIT) all fire automatically once InpEnableAlerts is on. Each event is routed to every channel that is enabled — there are no per-event toggles. The Configuring Alerts section below walks through MetaQuotes ID setup for push and SMTP setup for email.
Understanding SL and the 5-TP Ladder
When a signal fires, six horizontal lines are drawn from the signal bar extending forward by extendBars bars:
| Line | Color | Style | Position |
|---|---|---|---|
| SL | red #FF3B5C | dashed, width 2 | Entry × (1 ± slPct/100) — below for BUY, above for SELL |
| TP1 | mint #00E5A8 | dashed, width 1 | Entry × (1 ± 0.5%) |
| TP2 | mint | dashed, width 1 | Entry × (1 ± 1.0%) |
| TP3 | mint | dashed, width 2 | Entry × (1 ± 1.5%) |
| TP4 | mint | dashed, width 2 | Entry × (1 ± 2.5%) |
| TP5 | mint | solid, width 3 | Entry × (1 ± 4.0%) |
Line widths progress from thin (TP1) to thick (TP5) so the chart reads cleanly when multiple historical trades overlap. Each line has a right-side text label like TP3 1.07845 (1.5%) .
Partial-hit tracking. As the trade progresses, the indicator monitors high and low on every bar:
- For BUY trades — if high >= activeTPn marks TPn as hit
- For SELL trades — if low <= activeTPn marks TPn as hit
- For both directions — SL is hit when price crosses the SL level
When a TP is hit, three things happen:
- A small TPn HIT label is dropped on the bar where the hit occurred
- The dashboard's Active Signal row for that TP shows a * suffix
- The corresponding alert fires (if enabled)
Trade closure rule. A trade is considered fully closed when either SL is hit or TP5 is hit, whichever comes first.
Win/loss accounting rule. If TP1 was hit before SL, the trade counts as a win — modeling the universal discretionary rule "move stop to breakeven after first take". Three outcomes are possible:
- Pure win — TP1+ hit, SL never hit. Counts as a win.
- Breakeven-protected win — TP1 hit, then SL hits. Counts as a win.
- Loss — SL hit before TP1. Counts as a loss.
This rule is reflected in the Performance section of the dashboard. The total wins / losses / win-rate-% figures correspond to this accounting, not to a naive "last leg hit" interpretation.
When the trade fully closes, the SL and TP lines are removed from the chart to keep the view uncluttered. The signal arrow and label remain permanently visible for historical reference.
Reading the Dashboard
The dashboard has 22 rows organized into six sections. It is pixel-anchored to one of six chart corners and updates on every tick (with a 500ms throttle in the MetaTrader builds via OnTimer).
Header (rows 0–1). Brand title WOLF BLACKOUT TRADER in indigo background with mint text. Below it, the current symbol and timeframe plus a date/time stamp.
Market Context (rows 2–6). Section header MARKET CONTEXT , then:
- Trend Regime — BULL / BEAR / FLAT (colored mint / red / gray)
- Range Filter — current filter value with delta from previous bar
- RSI(14) — value with state label (OB / OS / Bull / Bear)
- EMA(144) — value with ^ or v flag showing price-vs-EMA
- Volume — ratio of current volume to SMA20 with HIGH / Norm tag
Signal Engine (rows 7–9). Section header SIGNAL ENGINE , then:
- Last signal direction with bars-ago counter (LONG / SHORT / WAITING)
- Last signal star rating
- Cooldown remaining bars (0 if free to signal, N otherwise)
Confluence (rows 10–12). Section header CONFLUENCE , then:
- Live BUY score — mint, with star rendering, plus minimum-required threshold in parentheses
- Live SELL score — red, same rendering
- Layer breakdown — Range / RSI / EMA / HTF / Vol, each showing Pass or Fail for the current bar
Active Signal (rows 13–18). Section header ACTIVE SIGNAL , then:
- Direction with stars and bars-ago
- Entry price with live percent P&L from entry
- SL price with percentage distance from entry
- TP1 / TP2 / TP3 on one row (each cell with * if hit)
- TP4 / TP5 on one row (each with * if hit)
- Reversal Detector state (BUY zone / SELL zone / -)
MTF Trend (row 19). Six cells side by side: M5 / M15 / M30 / H1 / H4 / D1. Each shows ^ or v arrow colored mint or red.
Performance (rows 20–21). Total buys and sells fired since attachment. Wins / Losses / Win Rate %, plus cumulative TP1/2/3/4/5 hit counts.
Repositioning. Change dashPos to one of the six corner options. The dashboard auto-anchors to that corner and stays in place across scroll, zoom, and symbol switches. On CHARTEVENT_CHART_CHANGE (terminal window resize) the dashboard re-anchors to maintain the corner offset.
Scaling. Set dashSize to Tiny / Small / Normal / Large for different font scales. Tiny uses ~10px text and fits comfortably on M1 timeframes with many historical bars. Large uses ~14px text and is best for single-chart standalone use.
Configuring Alerts
Wolf Blackout Trader fires 8 distinct trade-lifecycle alert events, each routable through any combination of four native MetaTrader channels: terminal popup, sound file, mobile push notification, and email. All four channels are built into the MetaTrader 4 and MetaTrader 5 terminals — no third-party services, scripts, or external bridges are involved.
The 8 Events
| # | Event | Fires When |
|---|---|---|
| 1 | BUY Signal | Main bullish signal at or above InpMinConfluence (message body is prefixed with STRONG when the score equals 5) |
| 2 | SELL Signal | Main bearish signal at or above InpMinConfluence (same STRONG prefix at score 5) |
| 3 | TP1 HIT | TP1 level reached on the active trade |
| 4 | TP2 HIT | TP2 reached |
| 5 | TP3 HIT | TP3 reached |
| 6 | TP4 HIT | TP4 reached |
| 7 | TP5 HIT | TP5 reached (trade closes) |
| 8 | SL HIT | Stop loss hit (trade closes) |
The Reversal Detector (diamond markers) is a pure visual layer in the MT4 / MT5 builds — it draws markers on the chart and updates the dashboard's Reversal Detector cell, but it does not fire its own alert event.
Setup — Popup Alerts (Simplest)
When InpEnableAlerts = true and InpAlertPopup = true , every triggered event produces a MetaTrader popup dialog with the alert message. Popups are best for active sessions when you are sitting in front of the terminal.
No additional configuration required — both inputs are ON by default.
Setup — Sound Alerts
When InpAlertSound = true , the .wav file named by InpAlertSound1 (default alert2.wav ) plays on every triggered event. The file must exist under the MetaTrader installation's Sounds folder. Both MT4 and MT5 ship with a small library of stock sounds ( alert.wav , alert2.wav , email.wav , news.wav , ok.wav , tick.wav , timeout.wav , wait.wav ) — you can substitute any of them, or drop in your own .wav file.
Setup — Push Notifications (Mobile)
- Install the MetaTrader 4 / MetaTrader 5 mobile app on your phone (iOS or Android)
- Open the app, go to Settings > Chat and Messages
- Note your MetaQuotes ID (an 8-digit number like 12345678 )
- In desktop MetaTrader, go to Tools > Options > Notifications
- Tick Enable Push Notifications and paste your MetaQuotes ID into the field
- Click Test to verify delivery
- In the indicator inputs, set InpAlertPush = true
Push delivers the same message text as popups, directly to your phone's lock screen via MetaQuotes' push infrastructure. Latency is typically under 5 seconds from bar close to lock-screen notification.
Setup — Email Alerts
- In MetaTrader, go to Tools > Options > Email
- Tick Enable and configure the SMTP fields:
- SMTP Server (e.g., smtp.gmail.com:587)
- SMTP Login (your email username)
- SMTP Password (your email password or an app-specific token)
- From — sender email address
- To — recipient email address
- Click Test to confirm delivery
- In the indicator inputs, set InpAlertEmail = true
Email is slower than popup and push (5–30 seconds of SMTP latency) but useful for archival and downstream parsing into a trade journal.
Message Format
BUY and SELL alerts carry the symbol, timeframe, entry price, stop loss, all five TP prices, and the confluence score:
WBT BUY EURUSD H1 Entry 1.07842 SL 1.06764 TP1 1.08382 TP2 1.08920 TP3 1.09459 TP4 1.10539 TP5 1.12156 Score 4
When the confluence score equals 5, the subject prefix becomes WBT STRONG <DIRECTION> (i.e. the literal word STRONG is injected ahead of the direction word in the same BUY or SELL alert event) — the rest of the message body is identical.
TP and SL HIT alerts are one-line confirmations chosen for clean rendering in popups, lock-screen push notifications, and email subject lines:
WBT TP3 HIT EURUSD H1
Alert Silencing on Load
When the indicator first attaches to a chart, hundreds of historical signals exist in the visible history. To prevent flooding the terminal with hundreds of popup alerts, the indicator sets a g_silenceAlerts = true flag during the initial historical replay ( prev_calculated == 0 ) and clears it at the end of OnCalculate . Only fresh signals fired on new bars after attachment trigger alerts.
Per-bar deduplication is also built in: the same bar cannot trigger the same alert twice, even if the indicator recomputes signals on subsequent ticks before bar close.
Troubleshooting & Support
Indicator does not appear in Navigator after purchase. Restart MetaTrader. The Market section of Navigator refreshes on terminal start. If still not visible after restart, check Tools > Options > Community and verify your MQL5.com login. Also confirm the purchase appears in your account purchase history on MQL5.com.
Indicator shows in Navigator but does not attach to chart. Check View > Toolbox > Journal for error messages. The most common cause is invalid input values — every input has range validation in OnInit. Verify that values like fastLen , slowLen , rsiLen , emaLen are within their permitted ranges. The indicator returns INIT_PARAMETERS_INCORRECT for out-of-range values to prevent accidental misuse.
Range Filter line and signals do not appear. The indicator needs at least slowLen + emaLen + 60 bars of history before signals can fire (default: 89 + 144 + 60 = ~293 bars). On a fresh chart with limited history, scroll back to load more bars (Page Up several times) or switch to a higher timeframe to confirm the indicator is working.
Signal stream too dense on chart. Increase minConfluence from 2 to 3 or 4. Each step up significantly thins the signal stream. Alternatively, lengthen the cooldown ( signalCooldown ) from 8 to 15–20 bars.
Too few signals on chart. Decrease minConfluence to 1, or disable some of the confluence layers ( useRsiConfirm , useEmaConfirm , useHtfConfirm , useVolConfirm ). Note: each disabled layer awards a free point in scoring, so make sure your minimum-confluence value still reflects your real strictness.
MTF row shows arrows but they seem stuck. The MTF row uses confirmed-bar values from each higher timeframe with [1] shift. The values only update when the higher-timeframe bar closes — so for the H4 cell, the arrow only changes every 4 hours when an H4 bar closes. This is intentional and prevents repaint.
Blackout candles look wrong / bars anchored to zero in MT4. The MT4 build uses four DRAW_HISTOGRAM buffers (high/low/open/close) for colored candles. All four must use the same line width — if you somehow modified the source to use mixed widths, the auto-pairing breaks and each buffer renders as a vertical line anchored to zero. The compiled .ex4 from the Market enforces uniform width.
Dashboard appears off-screen or behind toolbar. Adjust dashPos to a different corner, or change dashSize to Small or Tiny. The default dashPos = Top Right works well on most chart layouts.
Alerts fire during initial attachment. This should not happen on the current version — the silence flag is set on prev_calculated == 0 . If alerts do fire on attach, remove and re-add the indicator from Navigator. The Market product page always reflects the latest build.
SL/TP lines disappear unexpectedly. The lines are intentionally removed when the trade closes (SL hit or TP5 hit). The signal arrow remains visible. To check whether a trade closed, look at the dashboard's Active Signal section — if it shows "WAITING", the trade is closed.
Download the indicator:
- MetaTrader 5: Wolf Blackout Trader MT5
- MetaTrader 4: Wolf Blackout Trader MT4
CONTACT & SUPPORT
- Email: info@forexobroker.com
- Questions: Use the Comments section on the product page or send a private message
- Bug Reports: Please include your broker name, account type, and a screenshot
-
✅ All MQL Tools: https://www.mql5.com/en/users/forexobroker/ ✅
--------------------------------------------------------------------------------------------------------------
🏦 **Broker I use**: https://icmarkets.com/?camp=55869
🏦 **Broker For EU Traders I use 1**: https://www.ictrading.com?camp=91414
🏦 **Broker I use 2**: https://one.exnessonelink.com/boarding/sign-up/a/c_thuv62ocfq
💻 **VPS**: https://chocoping.com/processing/aff.php?aff=738
💼 **Companies I use for getting funded**:
Fundednext: https://fundednext.com/?fpr=kestutis39
The5ers: https://www.the5ers.com/?afmc=16kl
FTMO: https://trader.ftmo.com/?affiliates=nRAyOhmFRnEnFdOpdLeh
Risk Disclaimer
Trading foreign exchange and CFDs on margin carries a high level of risk and may not be suitable for all investors. You may sustain a loss exceeding your initial investment. Trend Quorum is a technical analysis tool and does not guarantee profitable trades. Past performance is not indicative of future results. The authors accept no liability for any loss arising from use of the indicator. By using Trend Quorum you acknowledge sole responsibility for your trading decisions.


