")

Introduction
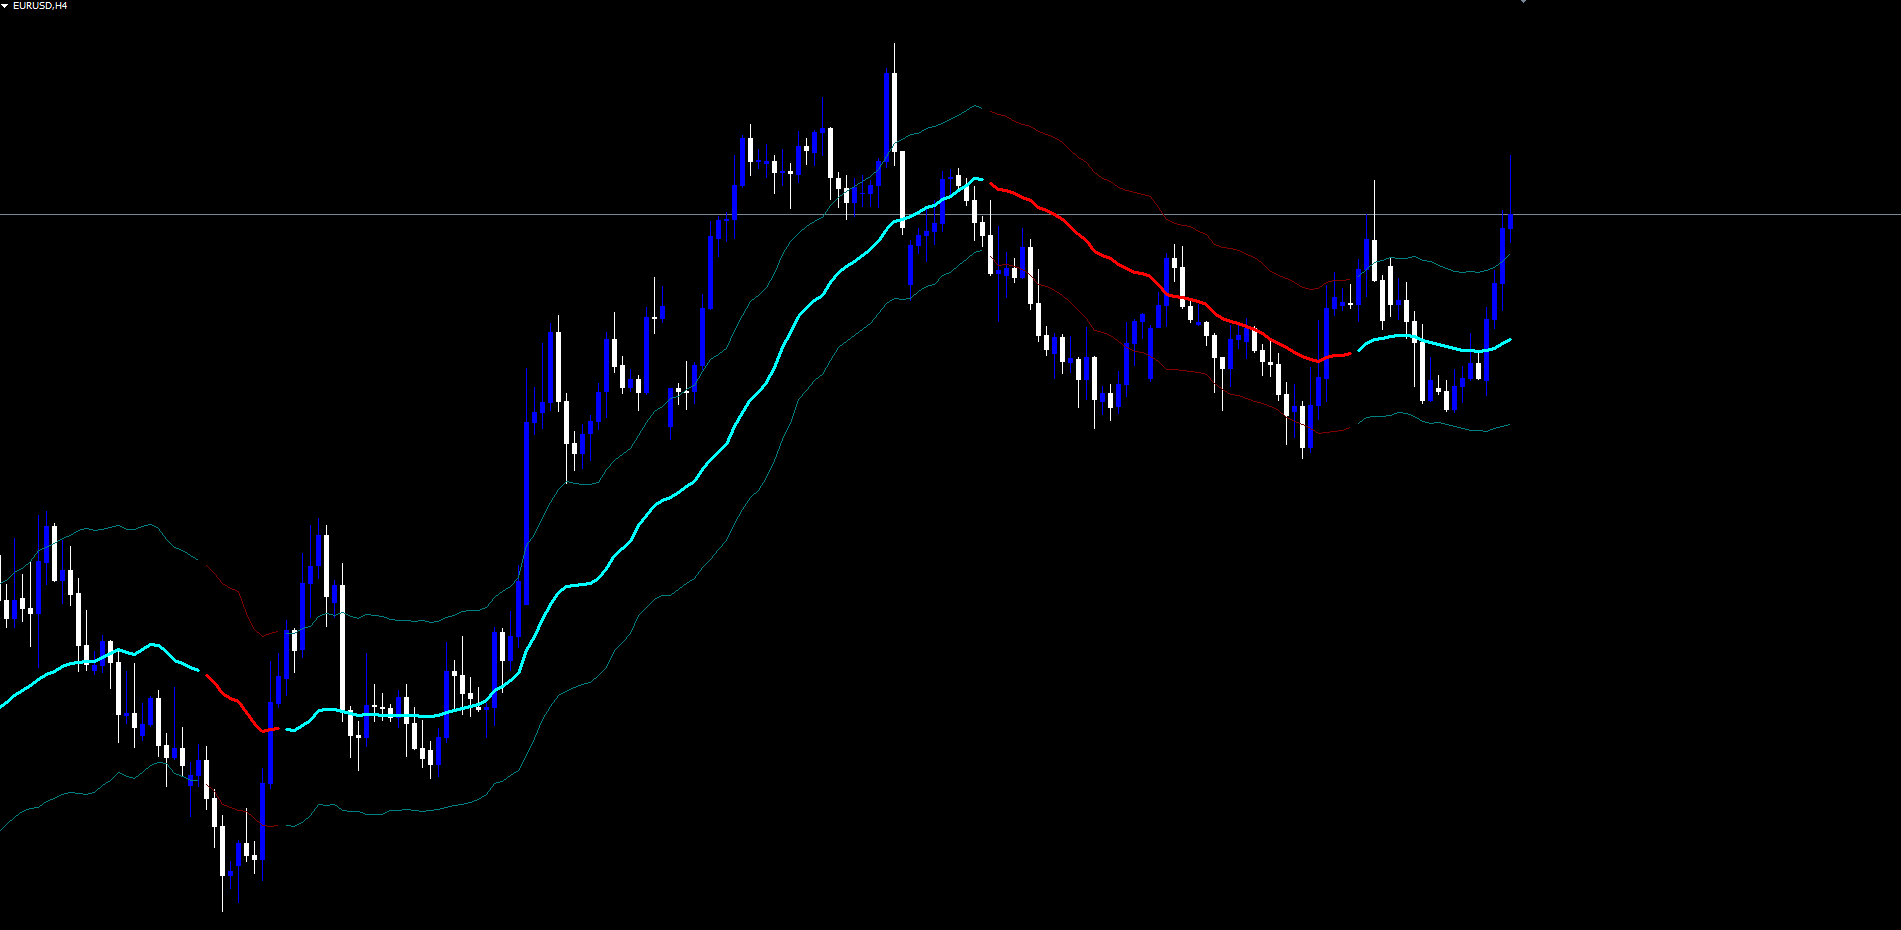
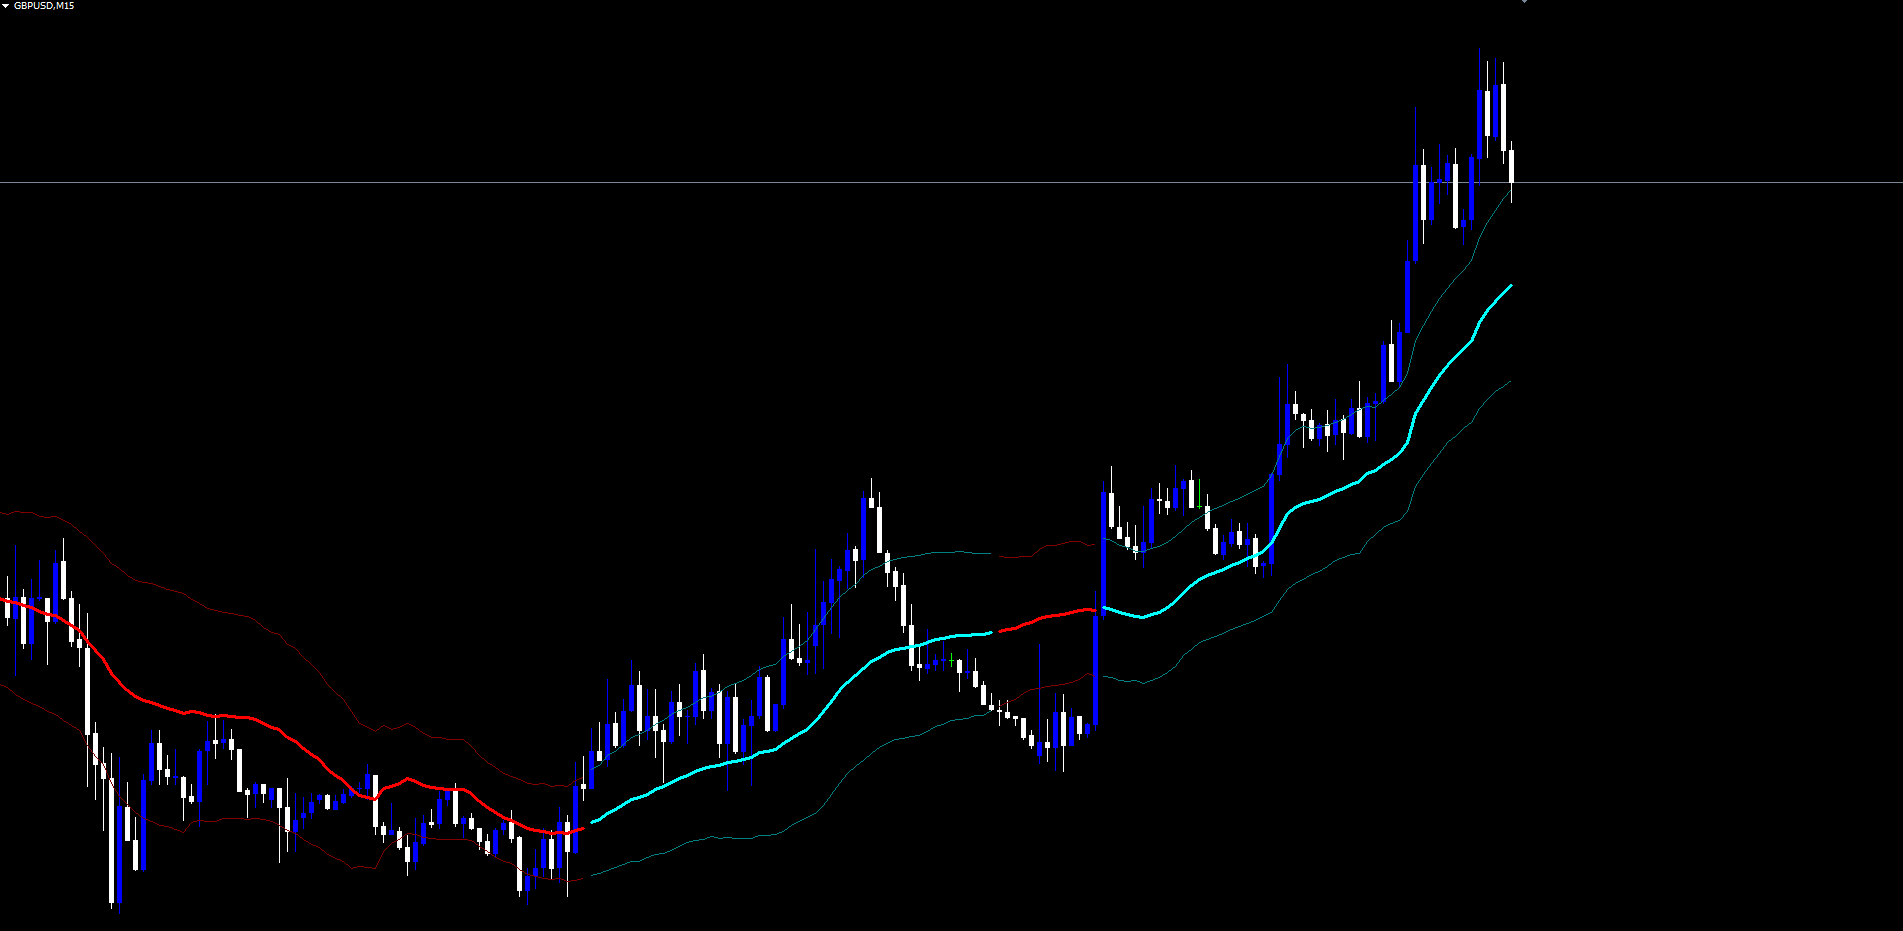
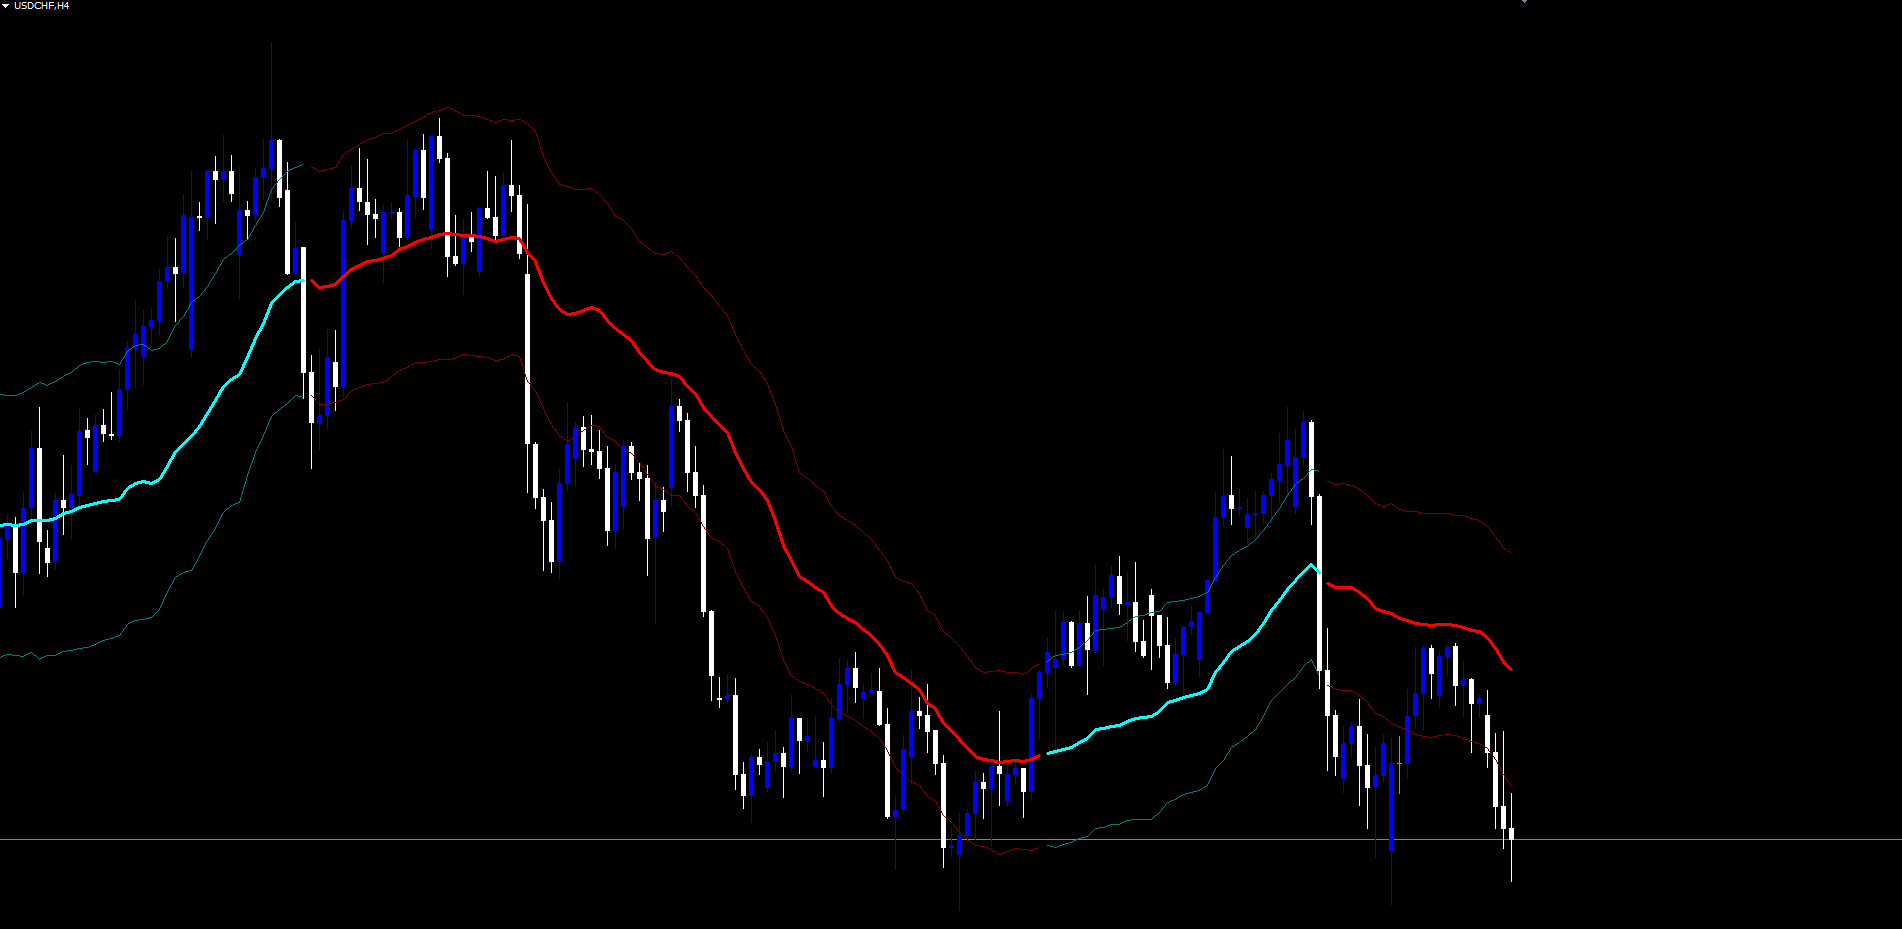
The Deep Trend Curve Indicator is a non-repainting Volume Weighted Moving Average (VWMA) trend indicator with ATR adaptive bands for MetaTrader 4 and MetaTrader 5. It draws a bicolor trend baseline that switches between aqua (bullish) and red (bearish) based on a deterministic state machine, surrounded by upper and lower volatility bands that scale automatically with the Average True Range.
Key Features:
- Volume Weighted Moving Average (VWMA): Trend baseline weighted by tick volume, prioritizing bars with strong participation
- ATR Adaptive Bands: Upper and lower volatility envelopes that scale with current market range
- Bicolor Trend State: Aqua bullish / red bearish color switching on confirmed bar close
- Non-Repainting Architecture: Closed-bar processing with live-bar mirror -- signals never change retroactively
- Trend Confirmation Alerts: Bullish and bearish trend turn alerts via popup, sound, push, and email
- Cross-Platform: Identical visual output on MetaTrader 4 and MetaTrader 5
Download the indicator:
- MetaTrader 5: Deep Trend Curve MT5
- MetaTrader 4: Deep Trend Curve MT4
TIP: This indicator is designed for traders who want a clean, single-glance trend reference that does not flicker or repaint. It works on any symbol and any timeframe available in MetaTrader.
Understanding VWMA + ATR Bands
Deep Trend Curve Indicator combines two well-known concepts -- the Volume Weighted Moving Average and the Average True Range -- into a single trend system.
How the calculation works:
- For each bar, the indicator sums (close * tick_volume) over the lookback period ( InpVwmaLength )
- It divides that sum by the total tick volume to produce the VWMA
- It computes the average True Range over the same period
- It places the upper band at VWMA + ATR * InpAtrMult and the lower band at VWMA - ATR * InpAtrMult
- The trend state machine evaluates the close against the bands:
- Close > upper band -> trend becomes bullish (aqua)
- Close < lower band -> trend becomes bearish (red)
- Otherwise -> trend stays unchanged from the previous bar
- The bar is colored according to the resulting state
Why volume weighting matters: Bars with strong participation (high tick count) carry more weight in the VWMA. A breakout candle with high volume pulls the trend line more aggressively than a quiet drift candle of the same magnitude.
Why ATR bands matter: The bands automatically widen during volatile sessions and tighten during quiet sessions, so the trend transition threshold scales with market conditions instead of being a fixed pip distance.
NOTE: The indicator uses tick volume, which is the count of price quote updates per bar. On forex markets where official transaction volume is not reported, tick volume is the standard proxy. The Pine Script reference implementation uses the same approach.
Installation Guide
Deep Trend Curve Indicator is distributed through the MQL5.com Market. Installation is automatic.
Steps:
- Purchase the indicator from the MQL5 Market product page
- The indicator installs automatically into your MetaTrader terminal
- Open MetaTrader and press Ctrl+N to open the Navigator panel
- Expand Indicators > Market
- Locate Deep Trend Curve Indicator in the list
- Drag the indicator onto any chart, or double-click its name
- The settings dialog appears -- adjust parameters as needed (see sections below)
- Click OK to apply
After loading, you will see:
- VWMA line drawn at the volume-weighted average price (aqua during bullish trends, red during bearish trends)
- Upper band drawn at VWMA + ATR * Multiplier (teal during bullish, maroon during bearish)
- Lower band drawn at VWMA - ATR * Multiplier (teal during bullish, maroon during bearish)
IMPORTANT: Do not manually copy files to the data folder. The MQL5 Market handles all file placement and updates automatically.
Trend State System Overview
The indicator's core logic is a deterministic three-state machine.
The Three States:
- Bullish (aqua): The most recent confirmed bar closed above the upper ATR band, indicating an uptrend
- Bearish (red): The most recent confirmed bar closed below the lower ATR band, indicating a downtrend
- Neutral (default aqua): The starting state before the first transition occurs (the indicator initializes new bars to the previous bar's state)
Transition Logic:
The state machine only transitions when price decisively crosses one of the bands:
| Current Close | Result |
|---|---|
| Above upper band | Trend becomes bullish |
| Below lower band | Trend becomes bearish |
| Between bands | Trend remains unchanged from previous bar |
This persistence rule is what gives the indicator its clean, readable visualization. The line does not flicker as price oscillates around the VWMA -- it only flips color when a meaningful break occurs.
Non-Repainting Confirmation:
- Trend transitions are evaluated only on confirmed (closed) bars
- The live (still-forming) bar inherits the trend color of the previous closed bar
- Once a confirmed bar's color is established, it never changes
This means a bar that closed bullish three days ago will still be bullish tomorrow. There is no rewriting of historical state when new data arrives.
Calculation Parameter Settings
These parameters control the VWMA and ATR calculations.
| Parameter | Default | Description |
|---|---|---|
| InpVwmaLength | 34 | Number of bars in both the VWMA and the ATR calculations. Shorter values (14-21) react faster to price changes; longer values (55-89) produce a smoother baseline |
| InpAtrMult | 1.5 | Multiplier applied to ATR for the upper and lower band distance. Lower values (0.8-1.2) trigger more frequent trend changes; higher values (2.0-3.0) require larger moves before transition |
Choosing the right length:
- 14-21 bars: Highly responsive, suitable for scalping (M5-M15) where you want quick trend recognition
- 34 bars (default): Balanced for swing trading on H1-H4, captures meaningful structural moves
- 55-89 bars: Smooth and slow, suitable for position trading on D1-W1 charts
Choosing the right ATR multiplier:
- 0.8-1.2: Tight bands, more frequent trend changes, more noise
- 1.5 (default): Balanced filtering of normal market volatility
- 2.0-3.0: Wide bands, fewer trend changes, only triggered by significant moves
TIP: Start with the defaults (34, 1.5) and only adjust after observing how the indicator performs on your preferred timeframe and instrument.
Visualization Parameters
The indicator's visual appearance is controlled by #property indicator_color and #property indicator_width directives at the top of the source file. The compile-time defaults are:
| Element | Bullish | Bearish | Width |
|---|---|---|---|
| VWMA main line | clrAqua (cyan) | clrRed | 3 pixels |
| Upper band | clrTeal | clrMaroon | 1 pixel |
| Lower band | clrTeal | clrMaroon | 1 pixel |
To change colors permanently: Modify the #property indicator_colorN directives in the source code, where N is the plot number (1-6 for the six bicolor buffers). Recompile in MetaEditor (F7) for the changes to take effect.
To change colors temporarily: Right-click the indicator on the chart, choose Properties, and edit the colors on the Colors tab. Changes apply only to that chart instance.
TIP: On dark chart backgrounds, the default aqua/red palette is highly visible. On light chart backgrounds, consider switching to clrDodgerBlue and clrCrimson for better contrast.
Risk Management Workflow
Deep Trend Curve Indicator is a trend filter, not an automated trade-execution system. It does not place stop loss or take profit levels on the chart. Instead, it provides the directional context that the trader uses as input to their own risk management framework.
Recommended workflow:
- Determine direction from the trend color. Trade only in the direction of the current state -- longs during bullish, shorts during bearish
- Use the lower band as a stop reference for longs. A close below the lower band invalidates the bullish thesis
- Use the upper band as a stop reference for shorts. A close above the upper band invalidates the bearish thesis
- Use ATR for position sizing. The same ATR value the indicator uses internally is exposed via the iATR function in MetaTrader (period 34 by default), which can drive a separate position-sizing tool
- Treat trend transitions as exit signals. When the line flips color against your position, consider closing or reducing exposure
The indicator's bands provide a natural stop-loss reference because they represent the volatility-adjusted boundary of the current trend. A move beyond the band is by definition a significant counter-trend move.
Complete Parameter Reference
The following table lists all input parameters in the order they appear in the indicator settings dialog.
| # | Parameter | Type | Default | Category |
|---|---|---|---|---|
| 1 | InpVwmaLength | int | 34 | Calculation |
| 2 | InpAtrMult | double | 1.5 | Calculation |
| 3 | InpAlertBull | bool | true | Alerts |
| 4 | InpAlertBear | bool | true | Alerts |
| 5 | InpAlertPopup | bool | true | Alerts |
| 6 | InpAlertSound | bool | false | Alerts |
| 7 | InpAlertEmail | bool | false | Alerts |
| 8 | InpAlertPush | bool | false | Alerts |
The indicator is intentionally lean on inputs to keep the configuration straightforward. The two calculation parameters ( InpVwmaLength and InpAtrMult ) determine the trend's responsiveness; the six alert parameters determine which events fire and through which channels.
Alert Configuration
Deep Trend Curve Indicator supports four alert delivery channels and two distinct alert events.
Alert Channels
| Parameter | Default | Description |
|---|---|---|
| InpAlertPopup | true | Show a popup dialog in MetaTrader |
| InpAlertSound | false | Play the default alert.wav sound |
| InpAlertEmail | false | Send email notification |
| InpAlertPush | false | Send push notification to the MetaTrader mobile app |
Alert Events
The indicator fires alerts for two events, each once per bar:
| Alert Event | Example Message |
|---|---|
| Bullish Trend Confirmed | Deep Trend Curve [EURUSD] - BULLISH trend confirmed |
| Bearish Trend Confirmed | Deep Trend Curve [EURUSD] - BEARISH trend confirmed |
Each alert fires only once per bar to prevent duplicate notifications. The alert text includes the symbol name and the trend confirmation state.
Direction-Specific Master Switches
| Parameter | Default | Description |
|---|---|---|
| InpAlertBull | true | Master switch for bullish trend alerts |
| InpAlertBear | true | Master switch for bearish trend alerts |
These let you enable only one direction (for example, only bullish alerts on a long-only watchlist).
Enabling Push Notifications
- Install the MetaTrader mobile app on your phone (iOS or Android)
- Open the app and navigate to Settings > Messages
- Copy your MetaQuotes ID
- In the desktop MetaTrader, go to Tools > Options > Notifications
- Enter your MetaQuotes ID and enable notifications
- Set InpAlertPush = true in the indicator settings
Enabling Email Notifications
- In MetaTrader, go to Tools > Options > Email
- Check Enable
- Enter your SMTP server, port, login, password, and destination email address
- Click Test to verify the configuration works
- Set InpAlertEmail = true in the indicator settings
Trading Strategies
The following three approaches demonstrate different ways to use Deep Trend Curve Indicator. All strategies assume default settings unless stated otherwise.
WARNING: Trading involves significant risk of loss. These strategies are provided for educational purposes only. Always test on a demo account first and never trade with money you cannot afford to lose.
Strategy A: Trend Following Pullbacks (H1 - H4)
Goal: Enter in the direction of the established trend on pullbacks toward the VWMA.
Setup:
- VWMA Length: 34 (default)
- ATR Multiplier: 1.5 (default)
- Timeframe: H1 or H4
Trade management:
- Wait for the VWMA line to be in your trade direction (aqua for longs, red for shorts)
- Wait for price to pull back to or near the VWMA (within the inner band area)
- Enter on the first bar that closes back in the trend direction
- Place stop loss just beyond the opposite band (lower band for longs, upper band for shorts)
- Take profit at 1.5-2 times the stop distance, or trail the stop along the band
Strategy B: Trend Reversal Confirmation (M30 - H1)
Goal: Enter at confirmed trend transitions when the line color flips.
Setup:
- VWMA Length: 21 (Fast Response preset)
- ATR Multiplier: 1.2 (Fast Response preset)
- Timeframe: M30 or H1
Trade management:
- Enable bullish and bearish alerts on multiple charts
- When an alert fires, check the chart and verify the trend transition is supported by your higher-timeframe analysis
- Enter at the open of the bar after the transition bar
- Place stop loss at the recent swing high (for shorts) or swing low (for longs)
- Take partial profit at 1:1 risk-reward and let the rest run with a trailing stop along the band
Strategy C: Multi-Timeframe Bias Filter
Goal: Use the indicator on H4 or D1 as a directional filter for trades on lower timeframes.
Setup:
- Apply Deep Trend Curve Indicator to the H4 or D1 chart of your traded instrument
- Determine the higher-timeframe trend (aqua = bullish bias, red = bearish bias)
- On your trading timeframe (M15, M30, H1), apply your usual entry methodology
- Take only entries that align with the H4/D1 bias from Deep Trend Curve
This approach combines the indicator's slow, reliable trend filter with whatever entry technique you already use, removing counter-trend trades from your decision tree.
TIP: For Strategy C, set up the higher-timeframe chart in a separate window or use the Color Print feature to overlay the trend state on your trading timeframe.
Parameter Tuning Presets
The following preset tables provide starting points for different trading styles.
Default Preset (Balanced, H1 - H4)
| Parameter | Default Value |
|---|---|
| InpVwmaLength | 34 |
| InpAtrMult | 1.5 |
The standard configuration for most Forex pairs on the 1-hour and 4-hour timeframes. Captures meaningful trend changes while filtering minor swings. Recommended for new users.
Fast Response Preset (M5 - M30)
| Parameter | Fast Value |
|---|---|
| InpVwmaLength | 21 |
| InpAtrMult | 1.2 |
Tighter bands and a shorter VWMA produce more frequent trend transitions. Best for intraday trading on lower timeframes where quick reversals matter. Expect more signals but with shorter persistence per state.
Smooth Trend Preset (D1 - W1)
| Parameter | Smooth Value |
|---|---|
| InpVwmaLength | 55 |
| InpAtrMult | 2.0 |
Wider bands and a longer VWMA produce fewer but higher-conviction trend transitions. Suitable for position trading on daily and weekly charts where major structural moves are the focus.
Crypto / High Volatility Preset
| Parameter | Crypto Value |
|---|---|
| InpVwmaLength | 34 |
| InpAtrMult | 2.0 |
For instruments with extreme volatility (BTCUSD, ETHUSD, indices during news), the higher ATR multiplier prevents the bands from being constantly violated by normal volatility expansion.
TIP: Adjust one parameter at a time and observe its effect over at least 50 historical bars before making further changes.
Troubleshooting
No Trend Color Visible on Chart
Possible causes and fixes:
- Warmup period not reached. The indicator requires at least InpVwmaLength + 2 bars of history before producing any output. On a fresh chart, scroll back to ensure enough bars are loaded
- Chart background color matches the line color. Right-click chart > Properties > Colors and verify the chart background contrasts with aqua and red
- Both bull and bear buffers are at EMPTY_VALUE on the visible region. This should not happen with the corrected build, but if it does, check the Experts log for any error messages
Lines Not Aligned with Candles
Possible causes and fixes:
- Old compiled binary. If you upgraded to a newer version of the indicator, the old .ex4 or .ex5 may still be cached. Open MetaEditor, open the source file, press F7 to recompile, and re-attach the indicator to the chart
- Wrong build for your platform. The .mq4 file must be compiled by MetaEditor 4 (bundled with MetaTrader 4). The .mq5 file must be compiled by MetaEditor 5 (bundled with MetaTrader 5). Cross-compilation does not work
- MT4 vs MT5 indexing differences. The MT4 build uses series-indexed buffers (shift = 0 is the current bar). The MT5 build calls ArraySetAsSeries to convert parameter arrays to the same orientation. Both builds produce visually identical output
Alerts Not Firing
- Confirm that EnableAlerts is set to true (this is the master switch via InpAlertBull / InpAlertBear toggles in this build)
- For push notifications: verify your MetaQuotes ID is configured in Tools > Options > Notifications and that InpAlertPush = true
- For email alerts: verify SMTP settings in Tools > Options > Email and that InpAlertEmail = true
- Alerts fire only once per bar per event type. If you missed the alert, you will not receive a duplicate on the same bar
Different Results Between MT4 and MT5
- The underlying calculation logic is identical, but minor differences in tick volume reporting between MT4 and MT5 broker feeds can produce small differences in VWMA values
- The ATR calculation uses the same formula on both platforms but processes the data slightly differently due to the array indexing conventions
- These differences are typically small (a few decimal places) and do not affect the overall trend state determination
Chart Auto-Scale Looks Wrong
If the chart Y-axis is forced to include 0 or extends far beyond the candle range, this typically means the buffer is being populated with default zero values instead of empty values:
- Recompile the indicator in MetaEditor (F7) to ensure the latest build is in use
- Re-attach the indicator to the chart after recompiling
- Press F8 (Properties) > Common tab > verify "Show in Data Window" is checked, then "Use the Buffer Empty Value" should be EMPTY_VALUE not 0
Support and Contact
If you need assistance with Deep Trend Curve Indicator:
| Contact Method | Details |
|---|---|
| support@forexobroker.com | |
| Website | www.forexobroker.com |
| MQL5 Market | Use the Comments section on the product page |
When contacting support, please include:
- Your MetaTrader version (MT4 or MT5) and exact build number
- Broker name and the symbol you are trading
- A description of the issue
- Screenshots of the chart and the indicator settings dialog
- The exact parameter values you are using
Download the indicator:
- MetaTrader 5: Deep Trend Curve MT5
- MetaTrader 4: Deep Trend Curve MT4
CONTACT & SUPPORT
- Email: info@forexobroker.com
- Questions: Use the Comments section on the product page or send a private message
- Bug Reports: Please include your broker name, account type, and a screenshot
-
✅ All MQL Tools: https://www.mql5.com/en/users/forexobroker/ ✅
--------------------------------------------------------------------------------------------------------------
🏦 **Broker I use**: https://icmarkets.com/?camp=55869
🏦 **Broker For EU Traders I use 1**: https://www.ictrading.com?camp=91414
🏦 **Broker I use 2**: https://one.exnessonelink.com/boarding/sign-up/a/c_thuv62ocfq
💻 **VPS**: https://chocoping.com/processing/aff.php?aff=738
💼 **Companies I use for getting funded**:
Fundednext: https://fundednext.com/?fpr=kestutis39
The5ers: https://www.the5ers.com/?afmc=16kl
FTMO: https://trader.ftmo.com/?affiliates=nRAyOhmFRnEnFdOpdLeh
Risk Disclaimer
Trading foreign exchange and CFDs on margin carries a high level of risk and may not be suitable for all investors. You may sustain a loss exceeding your initial investment. Trend Quorum is a technical analysis tool and does not guarantee profitable trades. Past performance is not indicative of future results. The authors accept no liability for any loss arising from use of the indicator. By using Trend Quorum you acknowledge sole responsibility for your trading decisions.


