
Descent Blade Indicator: Non-Repainting Parabolic SAR Cross Trend Reversal System with BW Fractal TP and Re-Entry Signal

Introduction
Trend reversal trading is the discipline of identifying when a directional move loses momentum and a counter-move begins. Done well, it offers the best risk-reward ratios available to a discretionary trader, because entries are placed at the structural pivot rather than chasing an established move. Done poorly, it produces a steady stream of losing trades, because every minor pullback in a strong trend looks like a potential reversal until it isn't.
The Parabolic SAR (Stop and Reverse), designed by J. Welles Wilder Jr., remains one of the most widely studied trend reversal tools. The dot pattern beneath an uptrend or above a downtrend provides a continuous visual reference, and a flip from one side of price to the other signals a potential regime change. Yet anyone who has traded raw PSAR knows the issue: it flips frequently in choppy conditions, generating dozens of false signals that erode an account before the next genuine trend takes hold.
The Descent Blade Indicator solves this with a layered confirmation engine combining a Wilder PSAR, a one-bar lagging variant, a Bill Williams Fractal exit and re-entry signal layer, and a strict non-repainting evaluation rule. Every signal is calculated on a confirmed bar close and is permanent. The indicator is available for both MetaTrader 4 and MetaTrader 5 and is distributed exclusively through the MQL5.com Market.
Download the indicator:
- MetaTrader 5: Descent Blade MT5
- MetaTrader 4: Descent Blade MT4
The system is based on the open-source Pine Script project Trend Trader-Remastered by aybarsm , released under the Mozilla Public License 2.0. The MQL4 and MQL5 implementations were rewritten from scratch with non-repainting closed-bar processing, marketplace-compliant input validation, and a unified visual layer that renders identically across both platforms.
This article explains the lagging PSAR concept, the BW Fractal TP and RE layer, and the complete parameter reference.
Why Standard Parabolic SAR Is Hard to Trade
The classical Parabolic SAR places a dot below price during an uptrend and above during a downtrend, trailing the move with an acceleration factor that grows each time price prints a new extreme. When price closes through the dot, the SAR flips and the acceleration factor resets. The flip itself is the reversal signal.
This mechanism makes the SAR responsive but also fragile. In a smooth trend the dot tracks tightly and locks in profit. In a choppy market it produces premature flips that reverse on the next bar, again and again. A trader entering on every flip in a sideways market gets chopped repeatedly. A single SAR flip also carries no information about the size or sustainability of the move that follows — a flip during a 5-pip retracement looks identical to a flip at the start of a 200-pip impulsive leg.
The Descent Blade Indicator addresses this with a confirmation layer built on top of the SAR — a lagging PSAR variant that operates as a structural gate rather than a reactive flip alarm.
The Lagging PSAR Concept
The lagging PSAR is computed from the standard SAR with a one-bar offset. At any bar t , the lagging value equals the standard SAR value at bar t-1 . This sounds like a trivial transformation, but its effect on signal quality is significant.
Consider a typical SAR flip from above price to below price (a bullish reversal). On the flip bar:
- The standard SAR jumps to a low value below price (the new uptrend's first dot).
- The lagging SAR carries forward yesterday's standard SAR value, which was above price (the last downtrend's terminal dot).
- A BUY signal is defined as a true cross of the bar's high above the lagging value, with the previous bar's high having been below it.
This formulation has a clean mathematical property: the cross condition high[t] > lagging[t] and high[t-1] <= lagging[t-1] is exactly equivalent to the standard SAR flip condition. A flip and a lagging cross occur on the same bar. But the lagging plot remains visible on the chart as a horizontal reference line at the prior trend's terminal SAR value, giving the trader a clear picture of where the next confirmation level sits during the new trend.
When price subsequently breaks back through the lagging line in the opposite direction, the SAR has flipped a second time and the trend has reversed again. The lagging line therefore acts as a slow rolling pivot that tracks regime changes, while the standard SAR continues to provide tight intra-trend stop guidance.
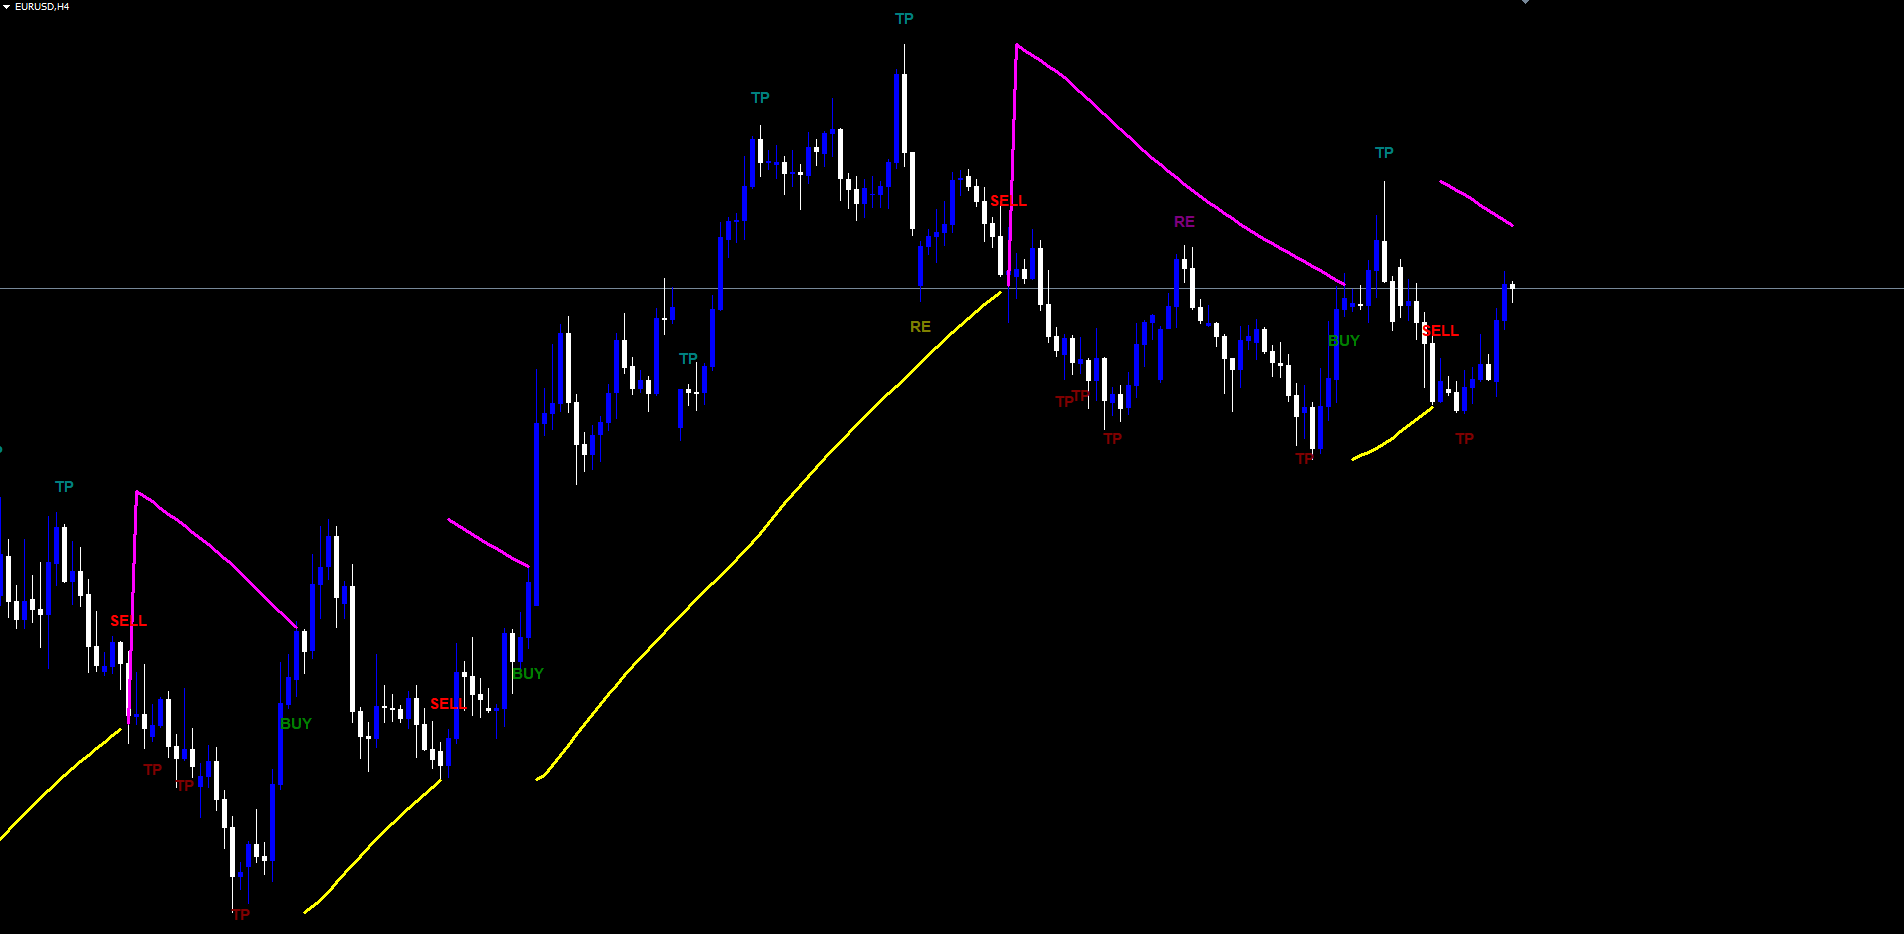
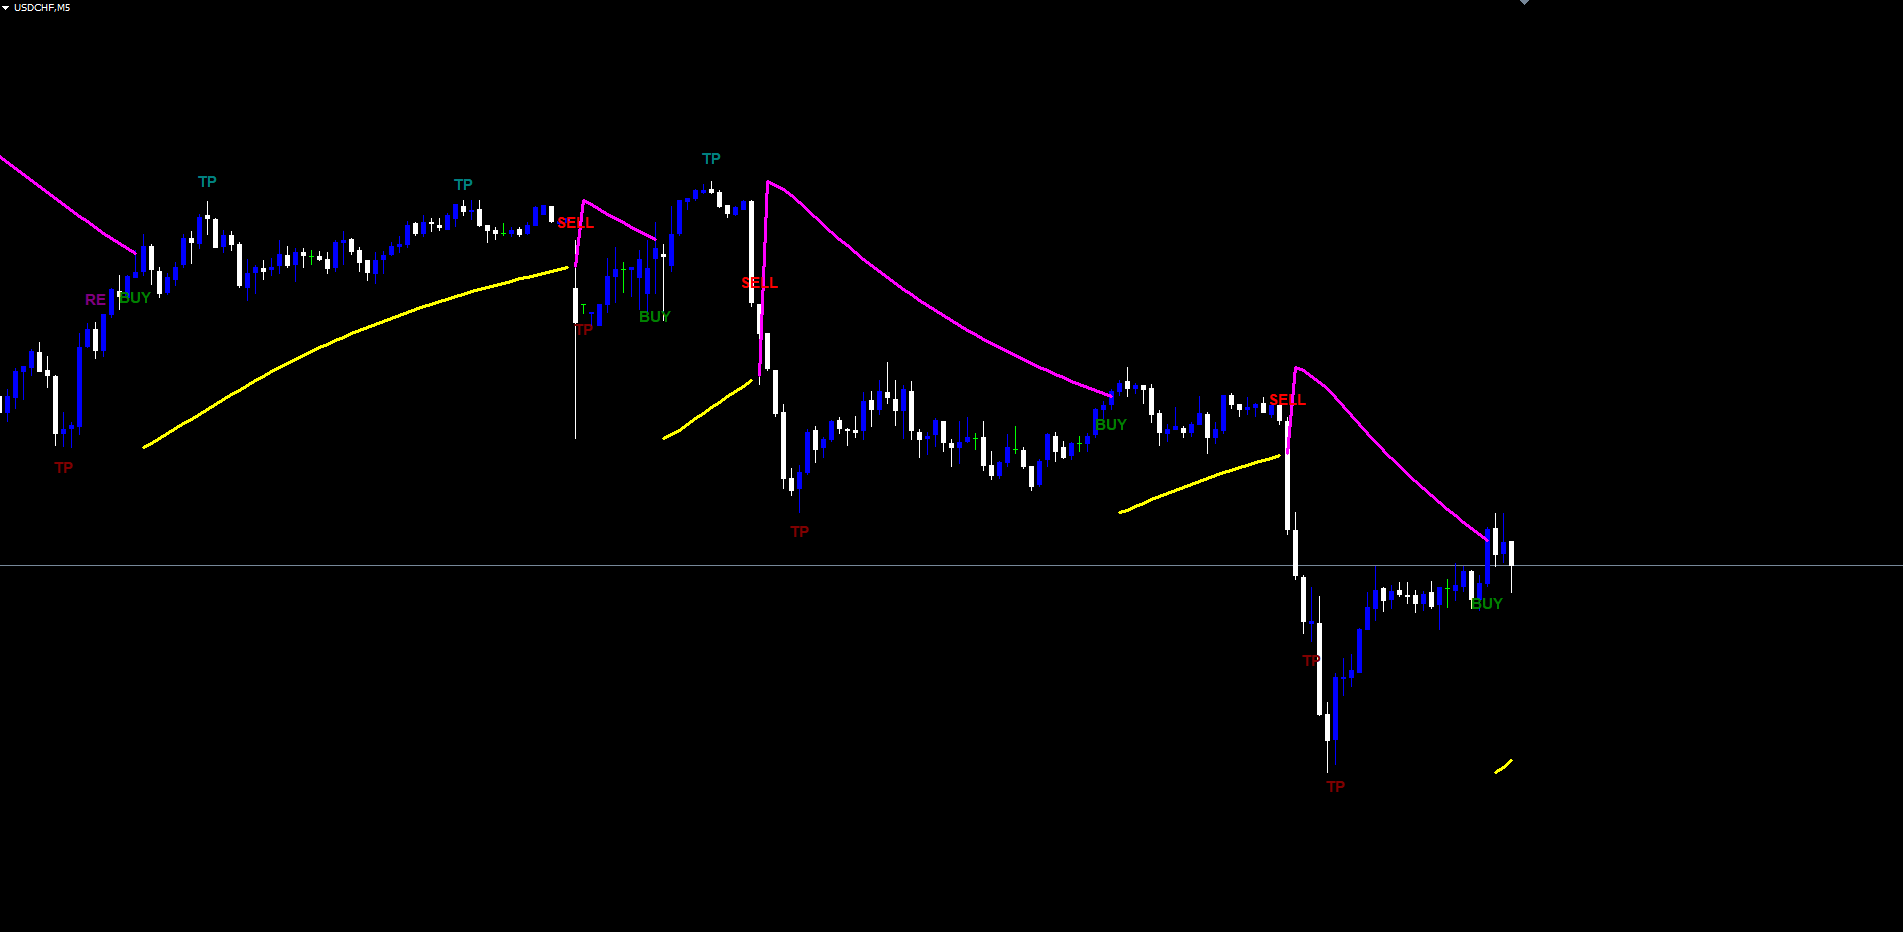
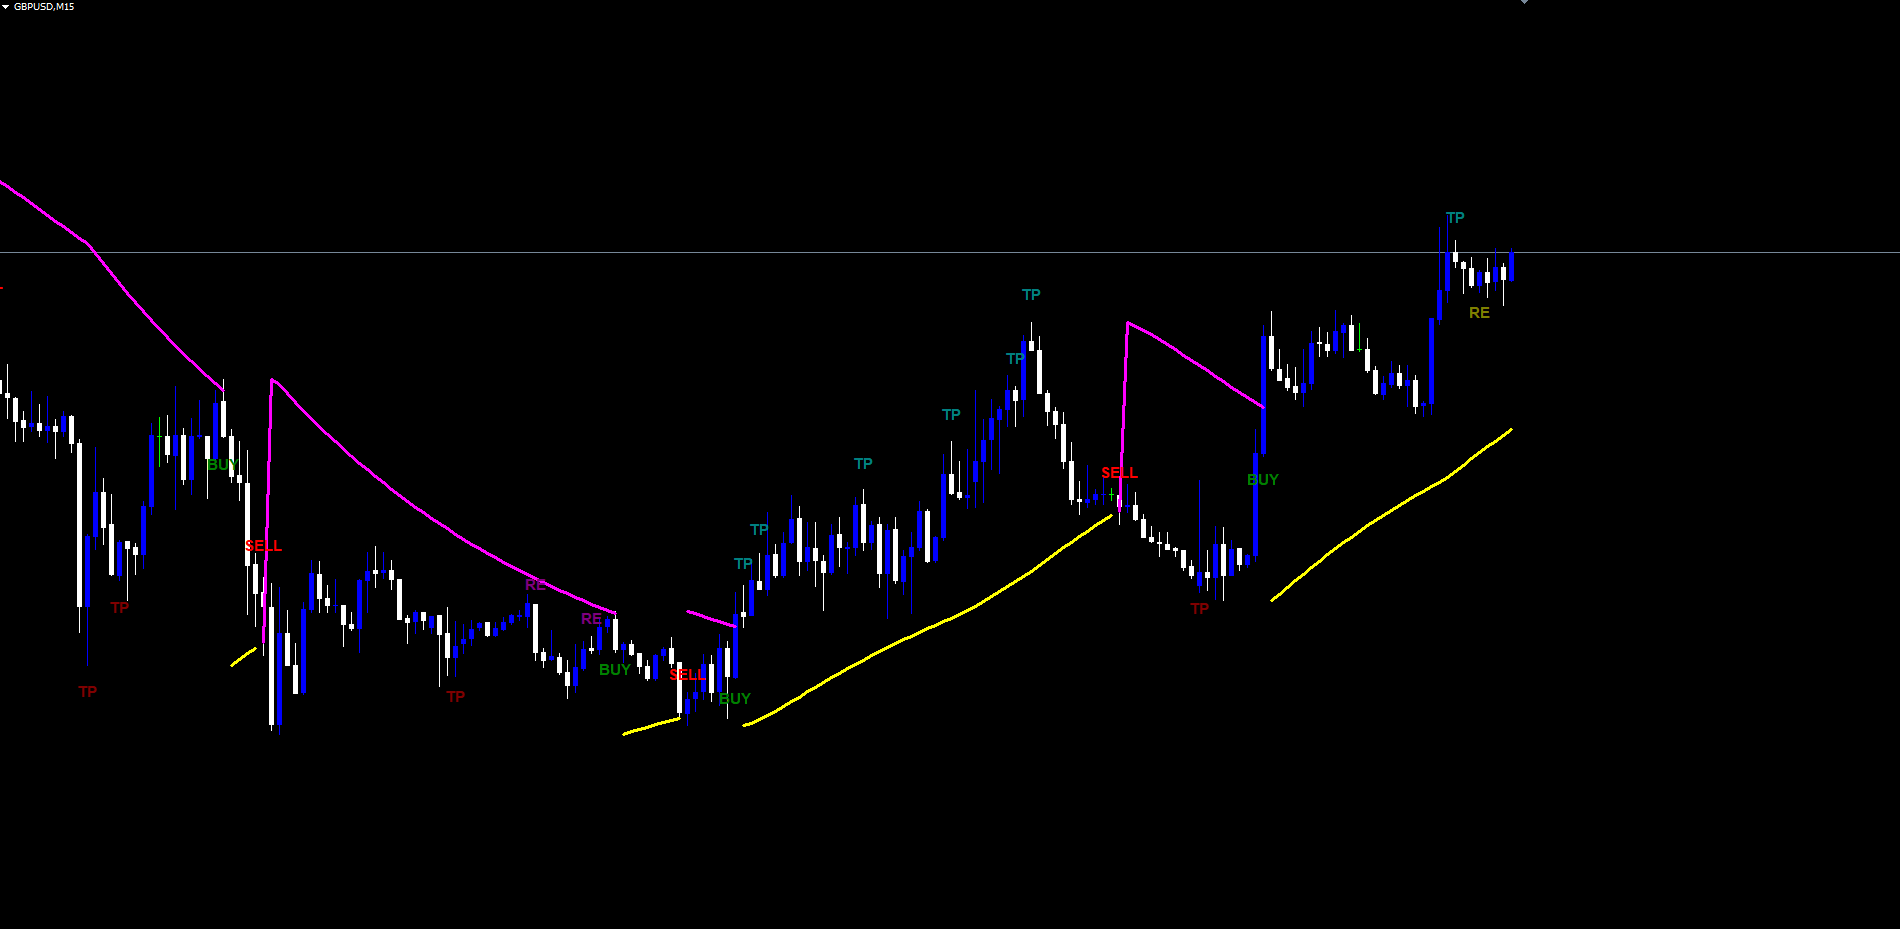
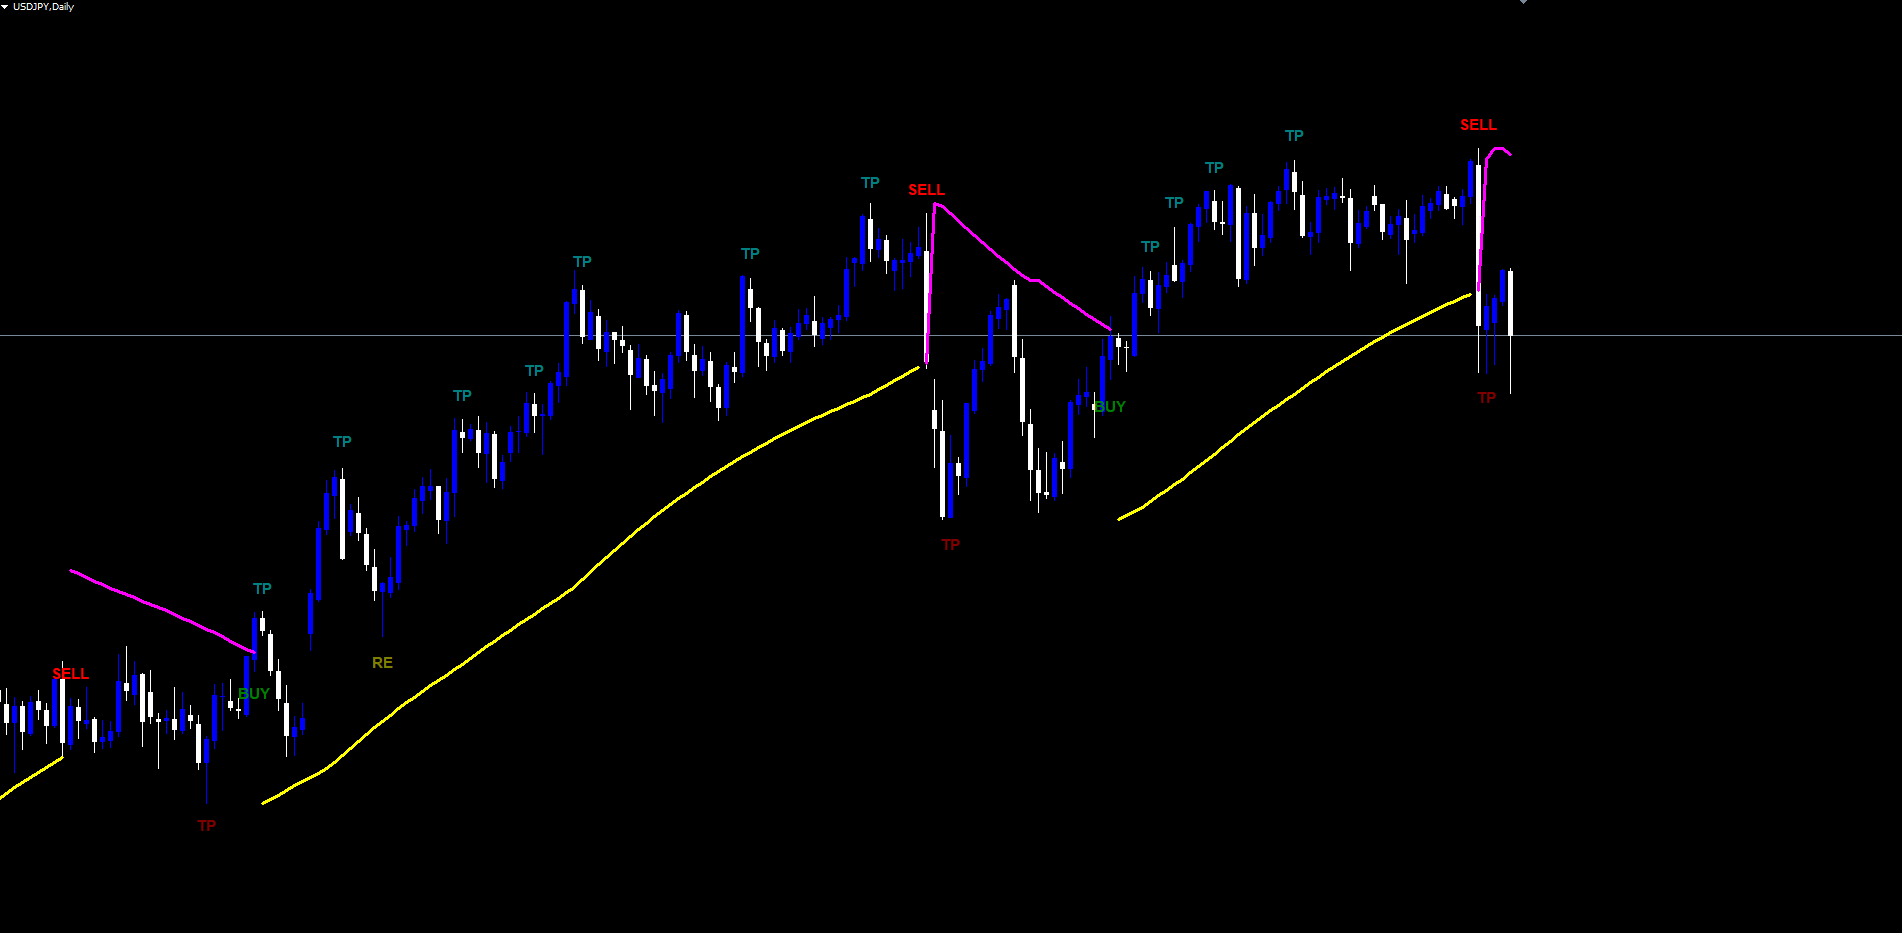
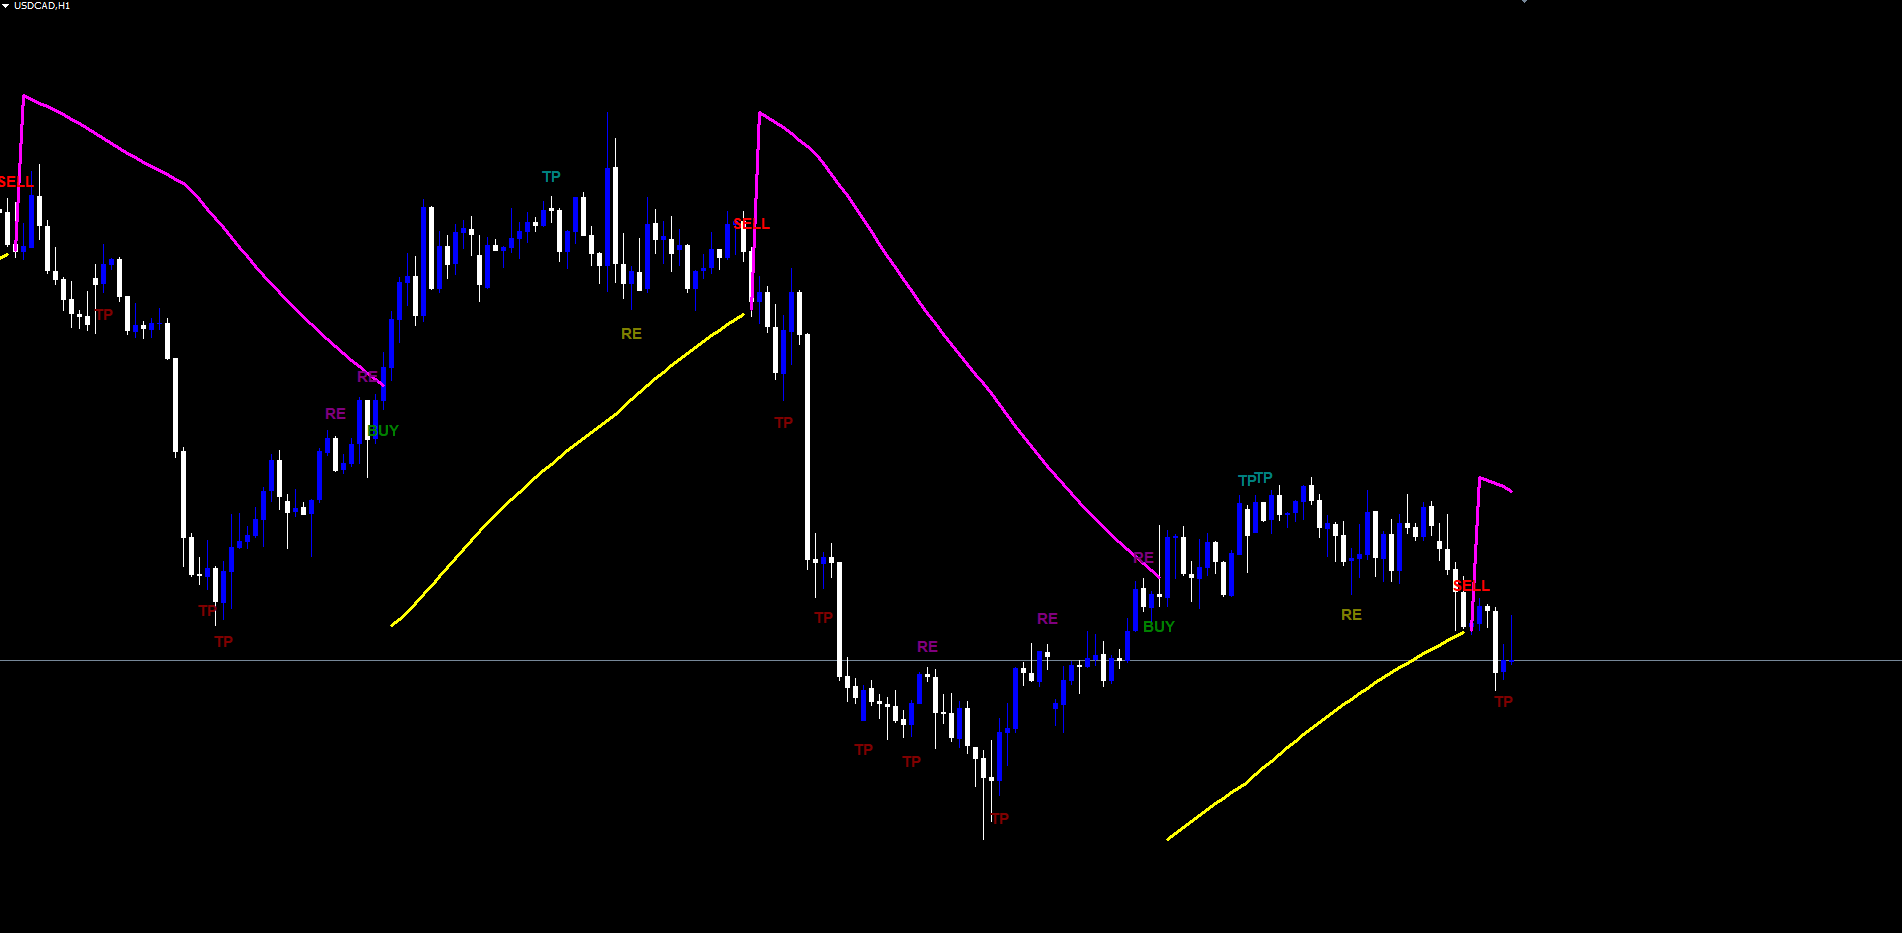
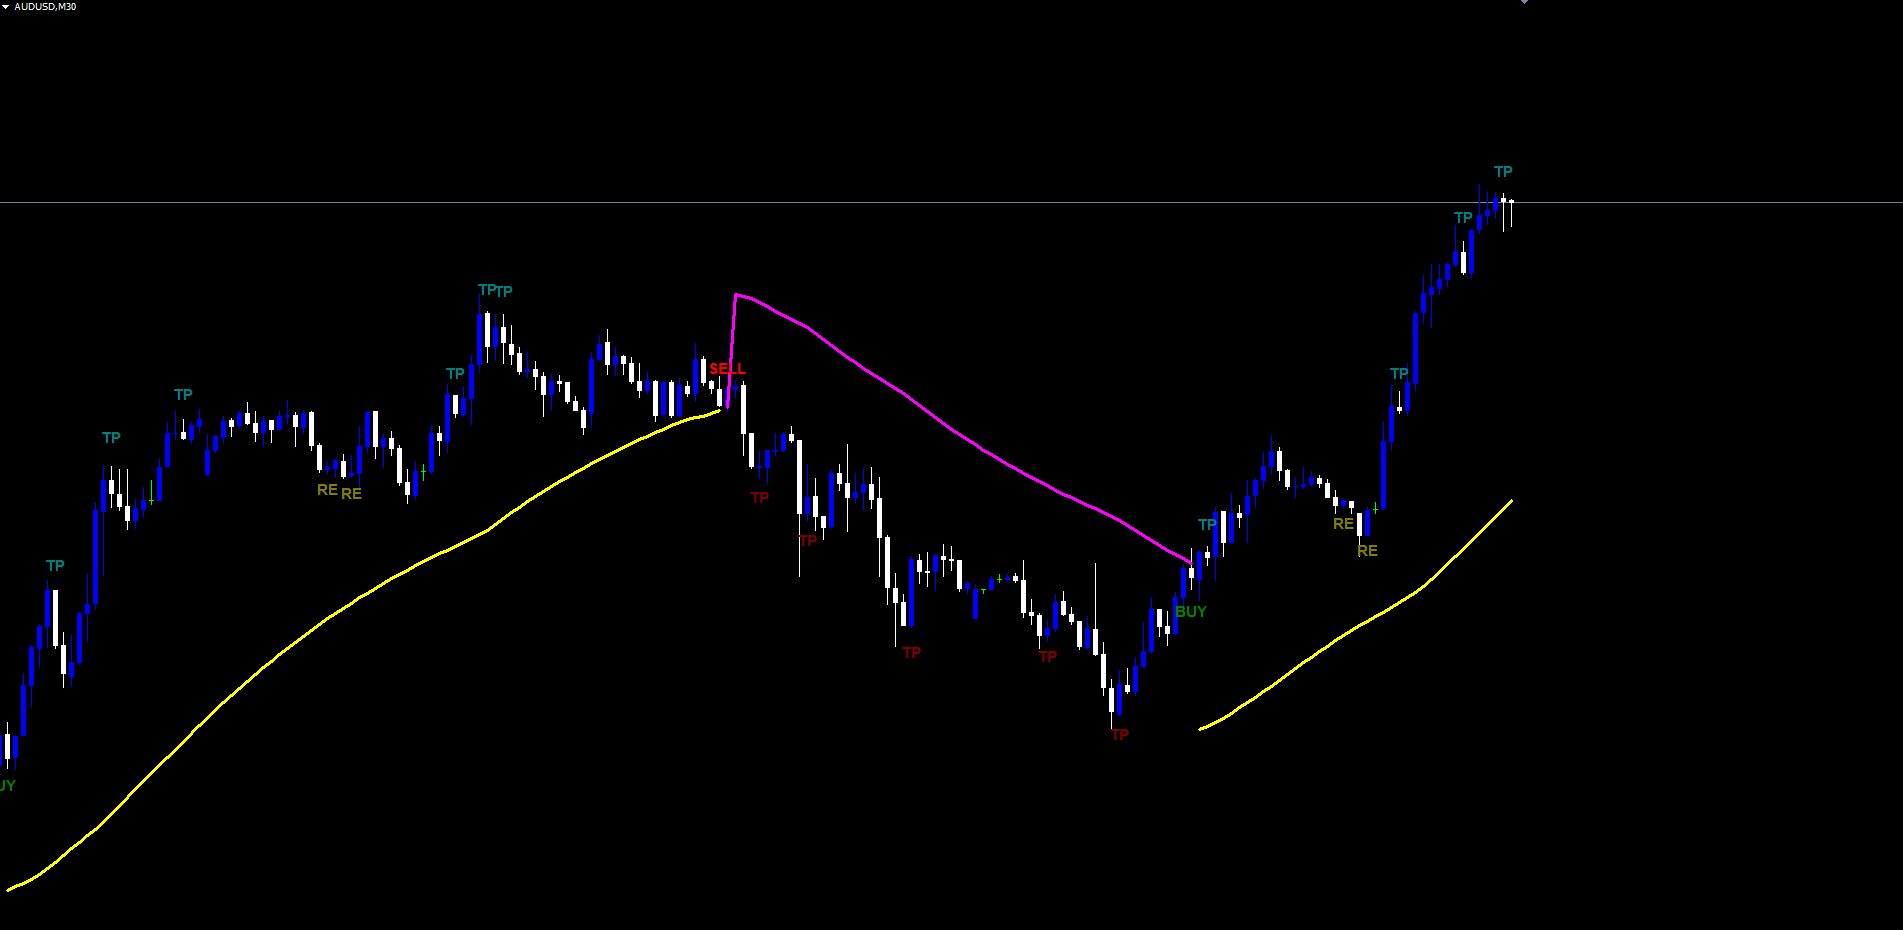
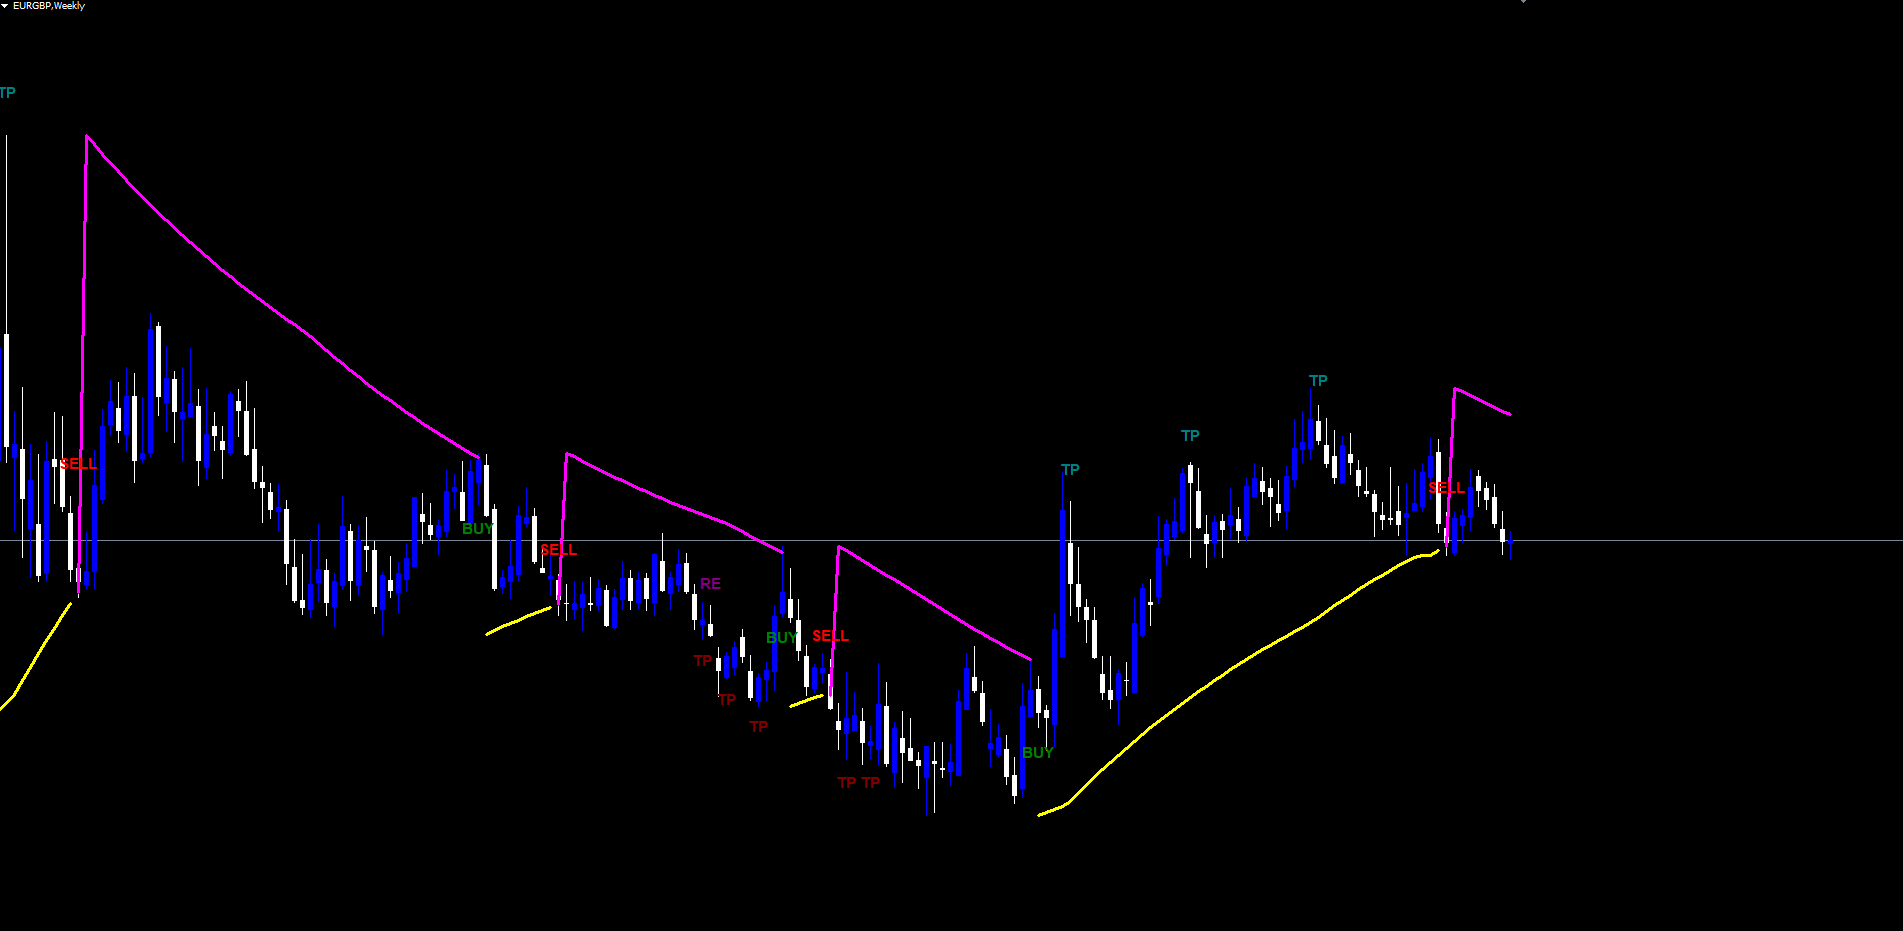
In the Descent Blade Indicator, the lagging line is rendered yellow when it sits below the bar's low (during an uptrend) and magenta when it sits above the bar's low (during a downtrend). The standard PSAR is hidden by default but can be enabled as an additional overlay through the input dialog. Most traders find the lagging line alone is sufficient and prefer the cleaner chart that results.
How Entry, Exit, TP, and Re-Entry Signals Are Generated
The indicator's signal engine is a position-aware state machine. It tracks a single internal position state that is either NONE, BUY, or SELL. Transitions between states are driven by lagging PSAR crosses, while take profit and re-entry events fire only while a position is active.
Entry Signals
A BUY entry fires when the bar's high crosses above the lagging PSAR with the prior bar below. A SELL entry fires when the bar's low crosses below the lagging PSAR with the prior bar above. The Direction input restricts the entry side: setting it to "Buy Only" disables sell entries; setting it to "Sell Only" disables buy entries; the default "Buy & Sell" allows both directions.
When a BUY entry fires, a green BUY label is drawn below the bar and the internal state transitions to BUY. The entry price is recorded as the lagging PSAR value at the cross bar — the same level whose breach defines the cross. This recorded entry price becomes the reference for subsequent take profit logic.
A SELL entry mirrors the BUY logic. A red SELL label is drawn above the bar, the state transitions to SELL, and the entry price is the lagging PSAR at the cross bar.
Exit Signals
The indicator generates an EXIT signal when an opposite-direction lagging PSAR cross occurs while a position is open. An EXIT BUY fires when the indicator is currently in BUY state and a SELL-direction cross is detected. An EXIT SELL fires when the indicator is currently in SELL state and a BUY-direction cross is detected. EXIT signals are disabled by default in the input dialog because most traders rely on the immediate counter-side entry signal to communicate the same information. Enabling them produces a denser visual layer but no additional logical meaning.
When an opposite cross happens on a bar with an open position, both an EXIT signal for the existing position and a new ENTRY signal for the new direction can be drawn on the same bar. This represents the standard "stop and reverse" behavior that gives the SAR its name.
Take Profit Signals
Take profit signals identify locations where price has met two specific conditions while the trade is in profit. The first condition is a candle direction reversal — the previous bar must close in the trade's direction while the current bar closes against it. The second condition is a Bill Williams Fractal breakout — a recent fractal pivot has had price close beyond it during the trade's lifetime. When both conditions align, the indicator fires a TP signal.
For a BUY trade, TP-Buy fires when:
- The previous bar closed up and the current bar closes down (or doji).
- A high fractal exists within the last FracLbHigh (default 2) detected fractals whose breakout time is after the trade's entry.
- The current close is above the entry price.
- The fractal hasn't already been TP-marked in this trade.
- The current close is above the prior TP price (if any).
For a SELL trade, TP-Sell mirrors the logic with low fractals.
Each TP signal is drawn as a teal label (for BUY trades, above the bar) or maroon label (for SELL trades, below the bar) showing simply "TP". The indicator marks the fractal as already-TP'd so it cannot trigger a second TP on the same trade. Multiple TP signals can fire during one trade as price climbs through successive fractals, producing a chain of partial profit-taking opportunities.
Re-Entry Signals
Re-entry signals are the mirror image of TP signals and fire when price action suggests the trade may be losing momentum and a counter-side scale-in could be appropriate. RE signals are intended for traders who use grid or pyramid management and want a structured, rule-based way to add to a position against the current direction.
For a BUY trade, RE-Buy fires on a downward candle reversal at a low fractal (mirror of TP-Sell's high-fractal logic) with additional gating: the proximity of the close to the lagging PSAR must exceed ReMinProximity (default 0%, no gate), and either a prior TP must have occurred OR ReBuyNoTp must be enabled. The default behavior requires a TP to have occurred before any RE signal fires.
The RE signal is drawn as an olive label (BUY trades) or purple label (SELL trades) showing "RE". As with TP signals, each fractal can only trigger one RE per trade.
The combined effect is a trade lifecycle that begins with a clear entry, layers structured profit-taking opportunities through TP signals, optionally provides counter-trend scale-in opportunities through RE signals, and closes with either an EXIT signal or a new opposite-direction entry.
The BW Fractal Engine Explained
Bill Williams' Fractal indicator identifies pivot points using a simple lookback rule. A high fractal forms at a bar whose high exceeds the highs of the surrounding bars on each side within a defined window. A low fractal forms at a bar whose low is below the lows of the surrounding bars within the same window.
The Descent Blade Indicator uses a default lookback of 2 bars on each side ( FracLbHigh = 2 , FracLbLow = 2 ), the standard Williams setting. Each detected fractal is added to an internal list with its time, price, and breakout state. When subsequent price action causes a close above a high fractal's price (or below a low fractal's price), the fractal is marked as broken out and its breakout time and price are recorded.
The fractal list is the structural memory the take profit and re-entry layer uses to identify where the market has previously rotated. Only fractals whose breakout occurred AFTER the current trade's entry are eligible for TP or RE marking, and only the most recent FracLbHigh or FracLbLow fractals are scanned. This dual filter keeps the signal layer focused on the trade's own rotation structure rather than ancient pivots that no longer carry weight.
The High Source and Low Source inputs let advanced users substitute alternative price series (Open, Close, Median, Typical, Weighted) for the fractal calculation. Standard usage leaves these at High and Low respectively.
Non-Repainting Architecture
Non-repaint is the property that signals printed on the chart cannot move, change, or disappear after they appear. It is the most critical structural property a signal indicator can have, and it is also one of the most commonly violated.
A repainting indicator evaluates conditions on the still-forming live bar. A signal can appear, persist for several minutes, then vanish when the bar closes at a different price. Backtests of repainting indicators look impossibly accurate because every signal that didn't actually trigger gets silently removed. Live trading then produces an entirely different result, often catastrophically worse.
The Descent Blade Indicator eliminates repainting through a strict closed-bar evaluation rule. The internal state machine processes a bar only after that bar has closed. Specifically, signals fire during the chronological loop only at bar shifts of 1 or greater — never on the live forming bar at shift 0. The standard PSAR and lagging PSAR can update on the live bar visually, but the cross detection, fractal evaluation, and TP/RE state machine all run only against confirmed historical data.
A practical consequence is that signals appear at the moment of bar close, not at the moment price first crosses the lagging PSAR mid-bar. This one-bar delay relative to the intra-bar event is the cost of non-repainting integrity. It is a trade-off serious traders universally prefer, because the alternative — seeing a signal mid-bar that may or may not still be there at bar close — produces unreliable backtests and erratic live behavior.
The non-repaint guarantee extends to the historical scan that runs when the indicator is loaded. The indicator walks the chart from oldest bar to newest, applying the state machine deterministically. Every signal printed during this scan is identical to what would have appeared in real time at bar close on that bar. Crucially, alerts are suppressed during the historical scan and only fire for newly closed bars at runtime. Loading the indicator on a chart with months of history does not flood the trader with retroactive notifications.
The Alert System
Eight alert events cover every transition the indicator can produce:
- Enter-Buy fires on a BUY entry.
- Enter-Sell fires on a SELL entry.
- Exit-Buy fires on a BUY EXIT (opposite-direction lagging PSAR cross during a BUY trade).
- Exit-Sell fires on a SELL EXIT.
- TP-Buy fires on a take profit signal during a BUY trade.
- TP-Sell fires on a take profit signal during a SELL trade.
- RE-Buy fires on a re-entry signal during a SELL trade (counter-direction scale-in).
- RE-Sell fires on a re-entry signal during a BUY trade.
Each alert can be routed to one or more delivery channels:
| Channel | Default | Parameter |
|---|---|---|
| Popup dialog | Enabled | InpAlertPopup = true |
| Push notification (mobile) | Disabled | InpAlertPush = false |
| Disabled | InpAlertEmail = false | |
| Sound (alert.wav) | Enabled | InpAlertSound = true |
Each alert category can be muted independently:
| Category | Parameter |
|---|---|
| Entry signals (Enter-Buy, Enter-Sell) | InpAlertEntry |
| Exit signals (Exit-Buy, Exit-Sell) | InpAlertExit |
| TP signals (TP-Buy, TP-Sell) | InpAlertTP |
| RE signals (RE-Buy, RE-Sell) | InpAlertRE |
Alert messages are pipe-delimited strings containing the event tag, symbol, broker name, timeframe, bar timestamp, and reference price. A typical entry alert reads DBI|Enter-Buy|EURUSD|MetaQuotes-Demo|H1|2026.05.01 14:00:00|1.10523 . This compact format makes it easy to forward alerts to external systems or to scan a log for specific events.
A critical implementation detail is the alert suppression flag that prevents the historical scan from firing thousands of retroactive notifications when the indicator first loads on a chart. The flag is enabled only after the historical scan completes, so the only alerts a trader ever receives are those from bars that close after the indicator was applied.
Visual Layer and Color Theme
The chart-rendered visual elements are designed for clarity on dark chart themes (the default MetaTrader background).
Lagging PSAR line: yellow when below the bar's low (uptrend), magenta when above (downtrend). Width 3 pixels, solid style. This is the primary structural reference and is enabled by default.
Standard PSAR line: lime when below price (uptrend), red when above (downtrend). Width 3 pixels, solid style. Hidden by default. Enable only if you want the secondary intra-trend stop reference.
Position Entry line: white horizontal segment running from the entry bar through the duration of the open trade, anchored at the entry price. Width 2 pixels. Hidden by default. Enable to see the trade's reference price plotted continuously across the chart.
Signal labels: text rendered as on-chart objects with bar-time anchoring. Default font is Arial Bold size 11, configurable through the inputs. Each signal type has its own color matching the corresponding Pine Script source:
| Signal | Color Default | Anchor |
|---|---|---|
| BUY entry / EXIT BUY | Green | Below bar |
| SELL entry / EXIT SELL | Red | Above bar |
| TP for BUY trade | Teal | Above bar |
| TP for SELL trade | Maroon | Below bar |
| RE for BUY trade | Olive | Below bar |
| RE for SELL trade | Purple | Above bar |
All color, font name, and font size inputs are configurable. The default values reproduce the original Pine Script aesthetic; advanced users can swap colors to fit personal chart themes.
Signals are drawn at a vertical offset from the bar's high or low equal to 30% of the current 14-period ATR. This adaptive offset keeps the labels visually clear regardless of the instrument's volatility — labels appear at a similar visual distance whether you're trading EURUSD with a 50-pip ATR or GBPJPY with 200 pips.
Practical Trading Workflow
Step 1: Apply the indicator. Open a chart in MT4 or MT5, find Descent Blade Indicator under Indicators > Market in the Navigator panel, and drag it onto the chart. The defaults work on most instruments. Start with H1 or H4 to observe well-spaced signals before exploring intraday timeframes.
Step 2: Set the direction filter. Leave at "Buy & Sell" for bidirectional trading, or restrict to "Buy Only" or "Sell Only" if your strategy targets a single direction.
Step 3: Wait for an entry. When a confirmed bar closes with a lagging PSAR cross, the entry label appears at the close. Do not anticipate signals mid-bar — the indicator deliberately waits for bar confirmation to maintain non-repaint integrity.
Step 4: Manage TP signals during the trade. Each TP label (teal for BUY, maroon for SELL) marks a fractal-confirmed structural exhaustion against a swing pivot. A common pattern is to close a third on each successive TP and let the final portion run to the next opposite entry.
Step 5: Use RE signals selectively. RE signals fire only when a TP has previously occurred. Treat them as scale-in opportunities only if your account and broker accommodate grid-style management. Many traders disable RE display to keep charts cleaner.
Step 6: Plan the exit. EXIT labels are off by default because the next opposite entry communicates the same information. Enable them only if you prefer explicit close-and-reverse cues separate from the new entry.
Step 7: Configure alerts. Enable push notifications for mobile awareness across multiple charts. Mute categories you don't need (Exit, RE) by toggling the corresponding InpAlert* input.
Timeframe and Instrument Notes
Lower timeframes (M5–M15) produce frequent signals on minor swings. Medium timeframes (H1–H4) are the recommended default for swing traders, with well-spaced entries and meaningful TP marks. Higher timeframes (D1, W1) generate fewer but structurally significant signals suited to position trading.
The indicator is symbol-agnostic and works across Forex, indices, commodities, equities, and cryptocurrencies. Volatility-adaptive elements (ATR-based label offset, proximity-ratio RE gate) ensure reasonable behavior across instruments with vastly different ranges. For very low-volatility instruments, consider increasing fractal lookback to 3 or 4.
Parameter Reference
All input parameters are listed below, grouped by function. Default values match the source code exactly.
Position
| Parameter | Default | Description |
|---|---|---|
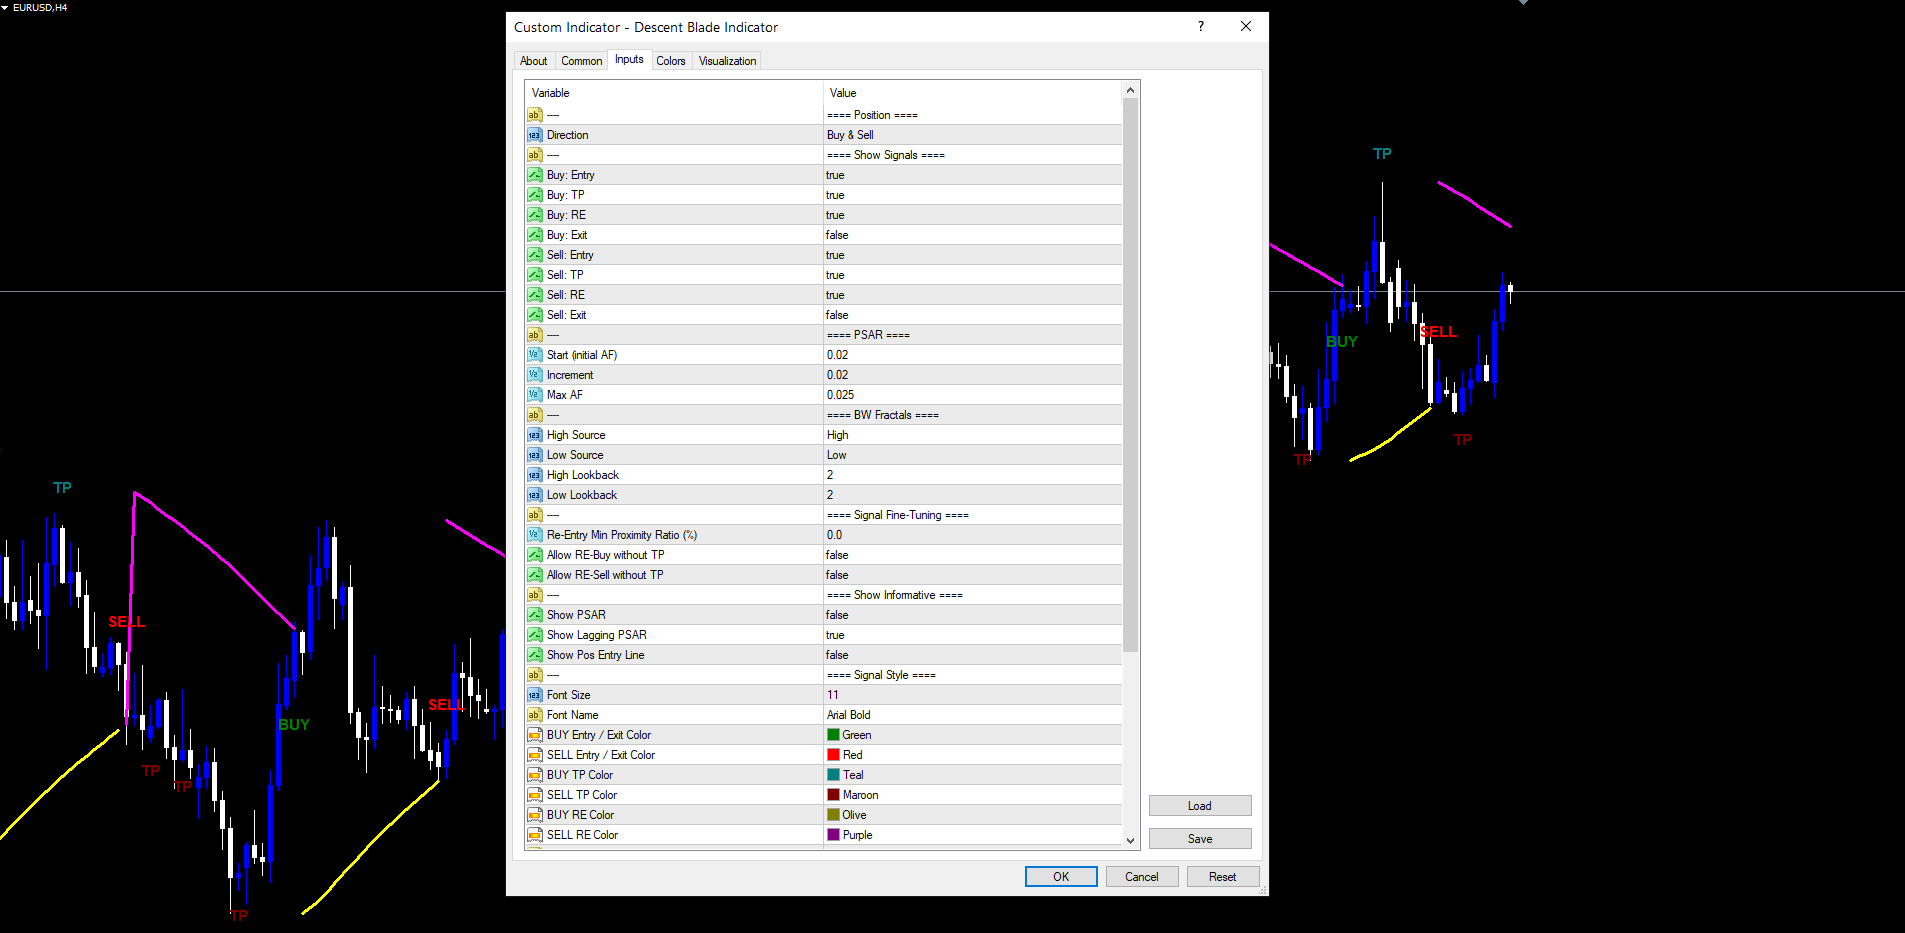
| InpDirection | Buy & Sell | Restrict signals to one side (Buy Only / Sell Only / Buy & Sell) |
Show Signals
| Parameter | Default | Description |
|---|---|---|
| InpShowEntryBuy | true | Display BUY entry labels |
| InpShowTpBuy | true | Display TP labels during BUY trades |
| InpShowReBuy | true | Display RE labels during SELL trades (BUY-side scale-in) |
| InpShowExitBuy | false | Display EXIT BUY labels (off by default) |
| InpShowEntrySell | true | Display SELL entry labels |
| InpShowTpSell | true | Display TP labels during SELL trades |
| InpShowReSell | true | Display RE labels during BUY trades (SELL-side scale-in) |
| InpShowExitSell | false | Display EXIT SELL labels (off by default) |
PSAR
| Parameter | Default | Description |
|---|---|---|
| InpPsarStart | 0.02 | Initial Acceleration Factor for the standard SAR |
| InpPsarIncrement | 0.02 | AF increment per new extreme point |
| InpPsarMax | 0.025 | Maximum AF cap |
BW Fractals
| Parameter | Default | Description |
|---|---|---|
| InpFracHighSrc | High | Price source for high fractals (High/Low/Close/Open/Median/Typical/Weighted) |
| InpFracLowSrc | Low | Price source for low fractals |
| InpFracLbHigh | 2 | Lookback bars for high fractal confirmation |
| InpFracLbLow | 2 | Lookback bars for low fractal confirmation |
Signal Fine-Tuning
| Parameter | Default | Description | ||
|---|---|---|---|---|
| InpReMinProximity | 0.0 | Minimum | close - lagging | / lagging × 100 ratio for RE signals |
| InpReBuyNoTp | false | Allow RE-Buy without a prior TP in the trade | ||
| InpReSellNoTp | false | Allow RE-Sell without a prior TP in the trade |
Show Informative
| Parameter | Default | Description |
|---|---|---|
| InpShowPsar | false | Display the standard PSAR line |
| InpShowPsarLagging | true | Display the lagging PSAR line |
| InpShowPosEntry | false | Display a horizontal entry-price line during open trades |
Signal Style
| Parameter | Default | Description |
|---|---|---|
| InpFontSize | 11 | Font size for signal labels |
| InpFontName | Arial Bold | Font face for signal labels |
| InpColEntryBuy | clrGreen | Color for BUY entry and EXIT BUY labels |
| InpColEntrySell | clrRed | Color for SELL entry and EXIT SELL labels |
| InpColTpBuy | clrTeal | Color for TP labels during BUY trades |
| InpColTpSell | clrMaroon | Color for TP labels during SELL trades |
| InpColReBuy | clrOlive | Color for RE labels during SELL trades |
| InpColReSell | clrPurple | Color for RE labels during BUY trades |
Alerts
| Parameter | Default | Description |
|---|---|---|
| InpAlertPopup | true | Show on-screen popup |
| InpAlertPush | false | Send push notification (requires MetaQuotes ID) |
| InpAlertEmail | false | Send email (requires SMTP configuration) |
| InpAlertSound | true | Play sound on alert |
| InpAlertSoundFile | alert.wav | Sound filename |
| InpAlertEntry | true | Enable Enter-Buy and Enter-Sell alerts |
| InpAlertExit | true | Enable Exit-Buy and Exit-Sell alerts |
| InpAlertTP | true | Enable TP-Buy and TP-Sell alerts |
| InpAlertRE | true | Enable RE-Buy and RE-Sell alerts |
Advanced
| Parameter | Default | Description |
|---|---|---|
| InpObjPrefix | DBI_ | Prefix for chart object names |
Recommended Configuration Profiles
Default (balanced). All defaults. Suitable for H1 and H4 trading on Forex majors, indices, and commodities.
Conservative (fewer signals). Increase InpFracLbHigh and InpFracLbLow to 4, set InpReMinProximity to 0.5, disable RE signals ( InpShowReBuy = false , InpShowReSell = false ). Produces fewer but more selective entries and TPs.
Aggressive (more signals). Set InpFracLbHigh = 1 , InpFracLbLow = 1 , enable InpReBuyNoTp = true and InpReSellNoTp = true . Produces a denser signal stream with RE signals appearing without a prior TP.
Visual-only mode. Set InpAlertPopup = false , InpAlertSound = false , all InpAlert* toggles to false. The indicator runs purely as a chart overlay with no notification sounds or popups.
Installation
The Descent Blade Indicator is distributed exclusively through the MQL5.com Market and installs automatically after purchase.
- Purchase the indicator from the MQL5.com Market product page.
- The indicator downloads and installs into MetaTrader 4 or MetaTrader 5 automatically.
- Open the Navigator panel (Ctrl+N) and expand the Indicators section.
- Find Descent Blade Indicator under Indicators > Market.
- Drag the indicator onto any chart.
- Adjust input parameters if needed, then click OK.
The indicator works on all timeframes and all symbols supported by your broker. No manual file copying is required.
For best results, allow the indicator a moment to load its historical scan the first time it is applied to a chart. The scan time depends on the bar count visible on the chart but typically takes under one second on a 5,000-bar chart and under five seconds on a 100,000-bar chart. After the initial scan, subsequent ticks process incrementally with no perceivable delay.
The indicator uses 5 indicator buffers (PSAR Up, PSAR Down, Lagging PSAR Up, Lagging PSAR Down, Position Entry) and creates chart text objects for signal labels. All chart objects use the prefix DBI_<chart_id>_ and are removed automatically when the indicator is removed from the chart.
Conclusion
The Descent Blade Indicator combines a Wilder Parabolic SAR with a one-bar lagging variant, a Bill Williams Fractal-based exit and re-entry layer, and a strict non-repainting evaluation rule. The lagging PSAR cross provides the primary entry trigger and acts as a structural confirmation gate that filters out the high-frequency flips that make raw PSAR difficult to trade. The BW Fractal layer adds context-aware TP and RE signals that adapt to the swing structure of each trade.
The indicator suits traders who want a structured, repeatable approach to trend reversal trading without the subjectivity of manual trendline drawing or the unreliability of repainting indicators. All eight alert events can be routed to popup, push, email, and sound channels independently. The historical scan is silent — no retroactive notifications flood the trader on indicator load.
The system works on Forex, indices, commodities, equities, and cryptocurrencies, and adapts to any timeframe through ATR-scaled label placement and proximity-ratio re-entry gating. Whether used as a primary signal source or a confirmation tool alongside other analysis, the structured approach to PSAR cross detection and fractal-confirmed trade management provides a foundation for disciplined, rule-based trading.
Download the indicator:
- MetaTrader 5: Descent Blade MT5
- MetaTrader 4: Descent Blade MT4
CONTACT & SUPPORT
- Email: info@forexobroker.com
- Questions: Use the Comments section on the product page or send a private message
- Bug Reports: Please include your broker name, account type, and a screenshot
-
✅ All MQL Tools: https://www.mql5.com/en/users/forexobroker/ ✅
--------------------------------------------------------------------------------------------------------------
🏦 **Broker I use**: https://icmarkets.com/?camp=55869
🏦 **Broker For EU Traders I use 1**: https://www.ictrading.com?camp=91414
🏦 **Broker I use 2**: https://one.exnessonelink.com/boarding/sign-up/a/c_thuv62ocfq
💻 **VPS**: https://chocoping.com/processing/aff.php?aff=738
💼 **Companies I use for getting funded**:
Fundednext: https://fundednext.com/?fpr=kestutis39
The5ers: https://www.the5ers.com/?afmc=16kl
FTMO: https://trader.ftmo.com/?affiliates=nRAyOhmFRnEnFdOpdLeh
Risk Disclaimer
Trading foreign exchange and CFDs on margin carries a high level of risk and may not be suitable for all investors. You may sustain a loss exceeding your initial investment. Trend Quorum is a technical analysis tool and does not guarantee profitable trades. Past performance is not indicative of future results. The authors accept no liability for any loss arising from use of the indicator. By using Trend Quorum you acknowledge sole responsibility for your trading decisions.


")
![[XAUUSD]: Weekly Liquidity Activation Points (timings), June 22-26, 2026](https://c.mql5.com/6/1013/splash-preview-771790.png "[XAUUSD]: Weekly Liquidity Activation Points (timings), June 22-26, 2026")
")