")
Smart Liquidity Matrix Indicator - Complete User Manual (MT4 & MT5)

Introduction
The Smart Liquidity Matrix is a non-repainting ICT Smart Money overlay indicator for MetaTrader 4 and MetaTrader 5. It automates the detection of Order Blocks, Fair Value Gaps, Market Structure (BoS/CHoCH), Equal Highs/Lows, Liquidity Sweeps, and Previous Period Levels, and generates confluence-scored Buy/Sell signals with automatic Stop Loss and Take Profit calculation.
Key Features:
- Order Blocks: Bullish and bearish zones detected at confirmed pivot points with automatic invalidation
- Fair Value Gaps: Three-bar imbalance zones with mitigation tracking
- Market Structure: Break of Structure (BoS) and Change of Character (CHoCH) with color-coded labels
- Confluence Signal Engine: EMA 20/50 trend, pivot zone retest, RSI filter, and one-trade-at-a-time management
- 9-Timeframe Signal Scanner: Real-time EMA trend status across M1 through MN in a single dashboard
- Premium Dashboard: Five-section panel with Market, Trend Analysis, Confluence Map, Active Signal with live P&L, and Scanner
Download the indicator:
- MetaTrader 5: Smart Liquidity Matrix MT5
- MetaTrader 4: Smart Liquidity Matrix MT4
TIP: This indicator is designed for traders who use ICT Smart Money Concepts and want automated detection of institutional footprints with structured, non-repainting signals. It works on any symbol and any timeframe available in MetaTrader.
Understanding ICT Smart Money Signals
Smart Liquidity Matrix generates buy and sell signals through a multi-step confluence process. Understanding each step helps you interpret the signals and manage trades effectively.
How signals are generated (6-step process):
- The indicator detects swing pivots using the configurable SwingLen parameter, requiring equal confirmation bars on both sides of each pivot high and pivot low
- Order blocks are created at confirmed pivots by scanning for the last opposing candle within OBScanBars of the pivot point
- The signal engine evaluates EMA 20/50 alignment on the chart timeframe -- buy entries require EMA 20 above EMA 50, sell entries require EMA 20 below EMA 50
- The engine checks for a pivot zone retest: the bar's wick must reach within 0.3 ATR of the most recent pivot, with the close confirming the expected direction (bullish candle for buy, bearish candle for sell)
- The RSI filter verifies that momentum is not at an extreme (below 70 for buy, above 30 for sell)
- If all conditions pass and the engine is in the flat state (no active trade), the signal fires, SL/TP are calculated, and the arrow appears on the chart
NOTE: All signal evaluation occurs on confirmed (closed) bars only. The signal arrow appears at the close of the bar that triggers the entry conditions. This one-bar delay relative to the initial condition match is the cost of non-repainting integrity -- what you see on historical data is exactly what would have appeared in real time.
Installation Guide
Smart Liquidity Matrix is distributed through the MQL5.com Market. Installation is automatic.
Steps:
- Purchase the indicator from the MQL5 Market product page
- The indicator downloads and installs automatically into your MetaTrader terminal
- Open MetaTrader and press Ctrl+N to open the Navigator panel
- Expand Indicators > Market
- Locate Smart_Liquidity_Matrix in the list
- Drag the indicator onto any chart, or double-click its name
After loading, you will see:
- Order Block rectangular zones (cyan for bullish, tomato for bearish)
- Fair Value Gap dashed zones (green for bullish, red for bearish)
- Structure lines with BoS/CHoCH labels at structural break points
- Signal arrows (green up arrow for BUY, red down arrow for SELL)
- SL/TP lines extending forward from the signal bar (when a trade is active)
- Equal High/Low dotted horizontal lines (when detected)
- Previous Period high/low/equilibrium levels
- Dashboard panel with five sections (if enabled)
IMPORTANT: Do not manually copy files to the data folder. The MQL5 Market handles all file placement and updates automatically.
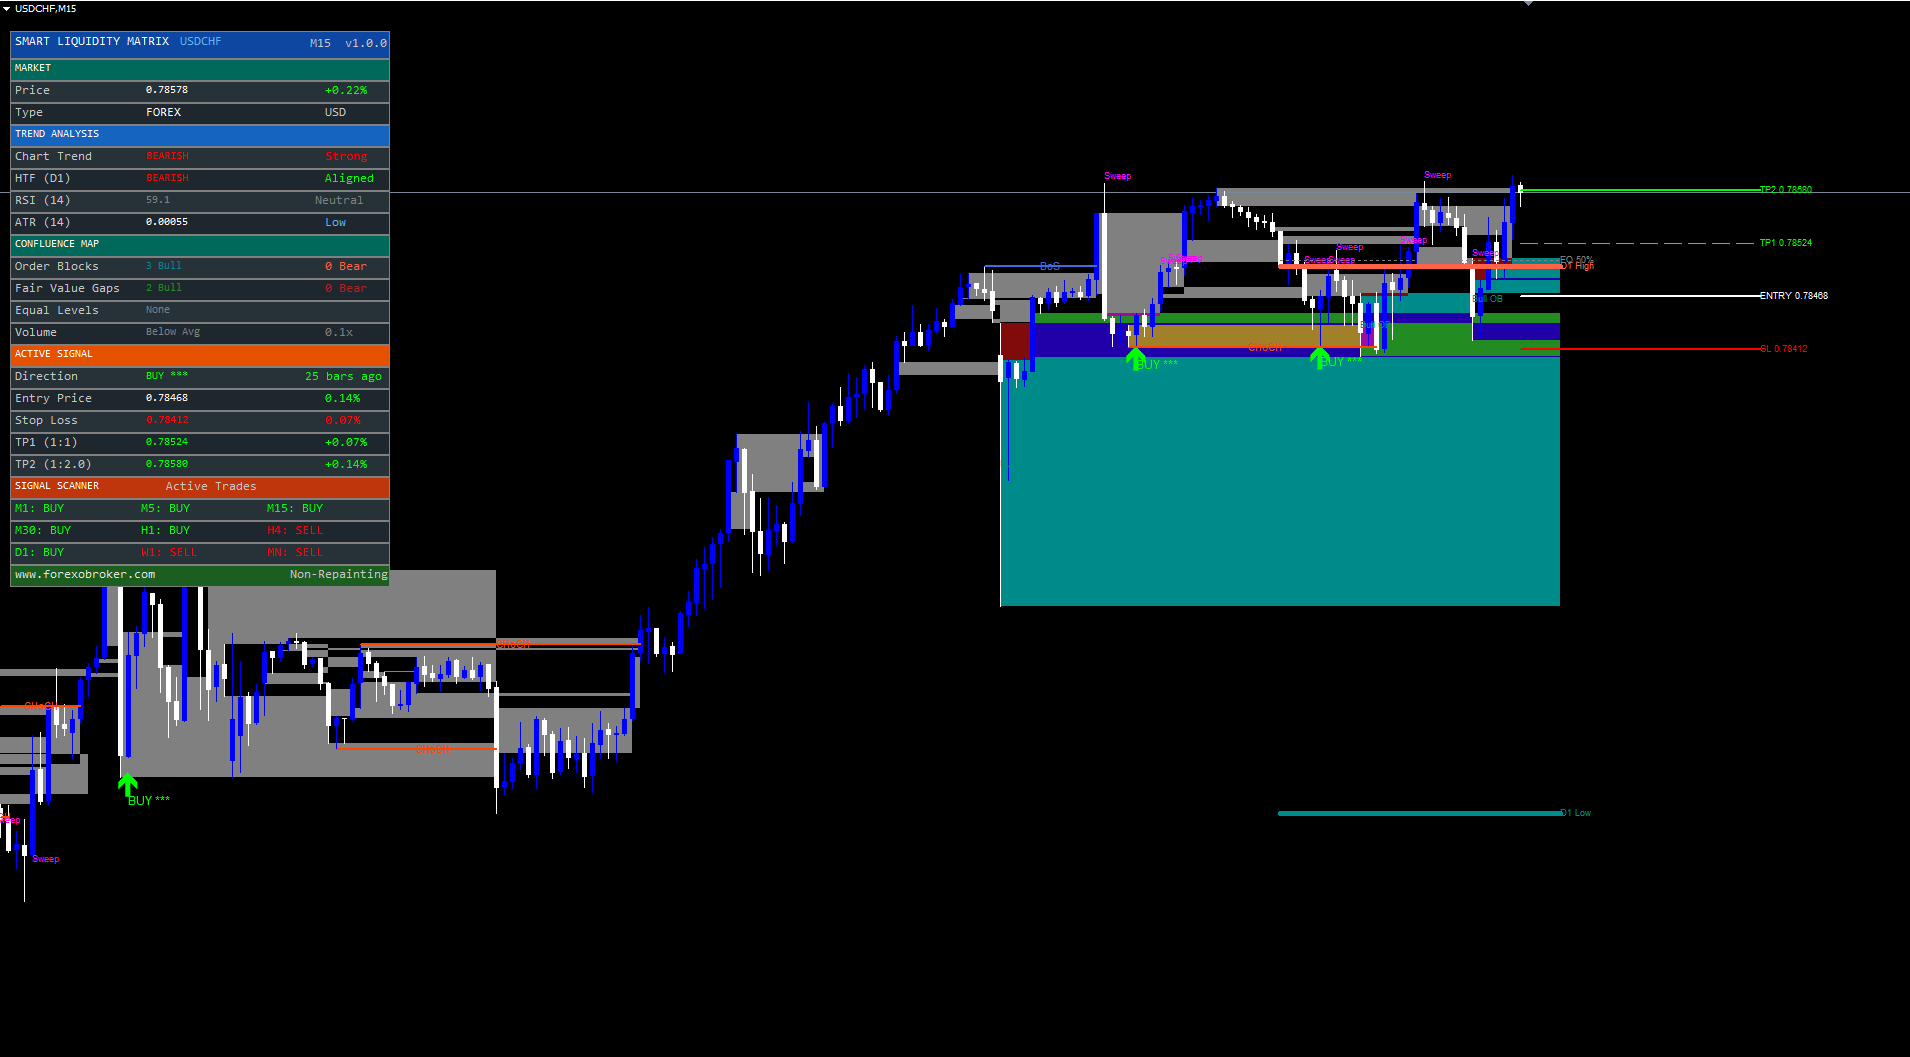
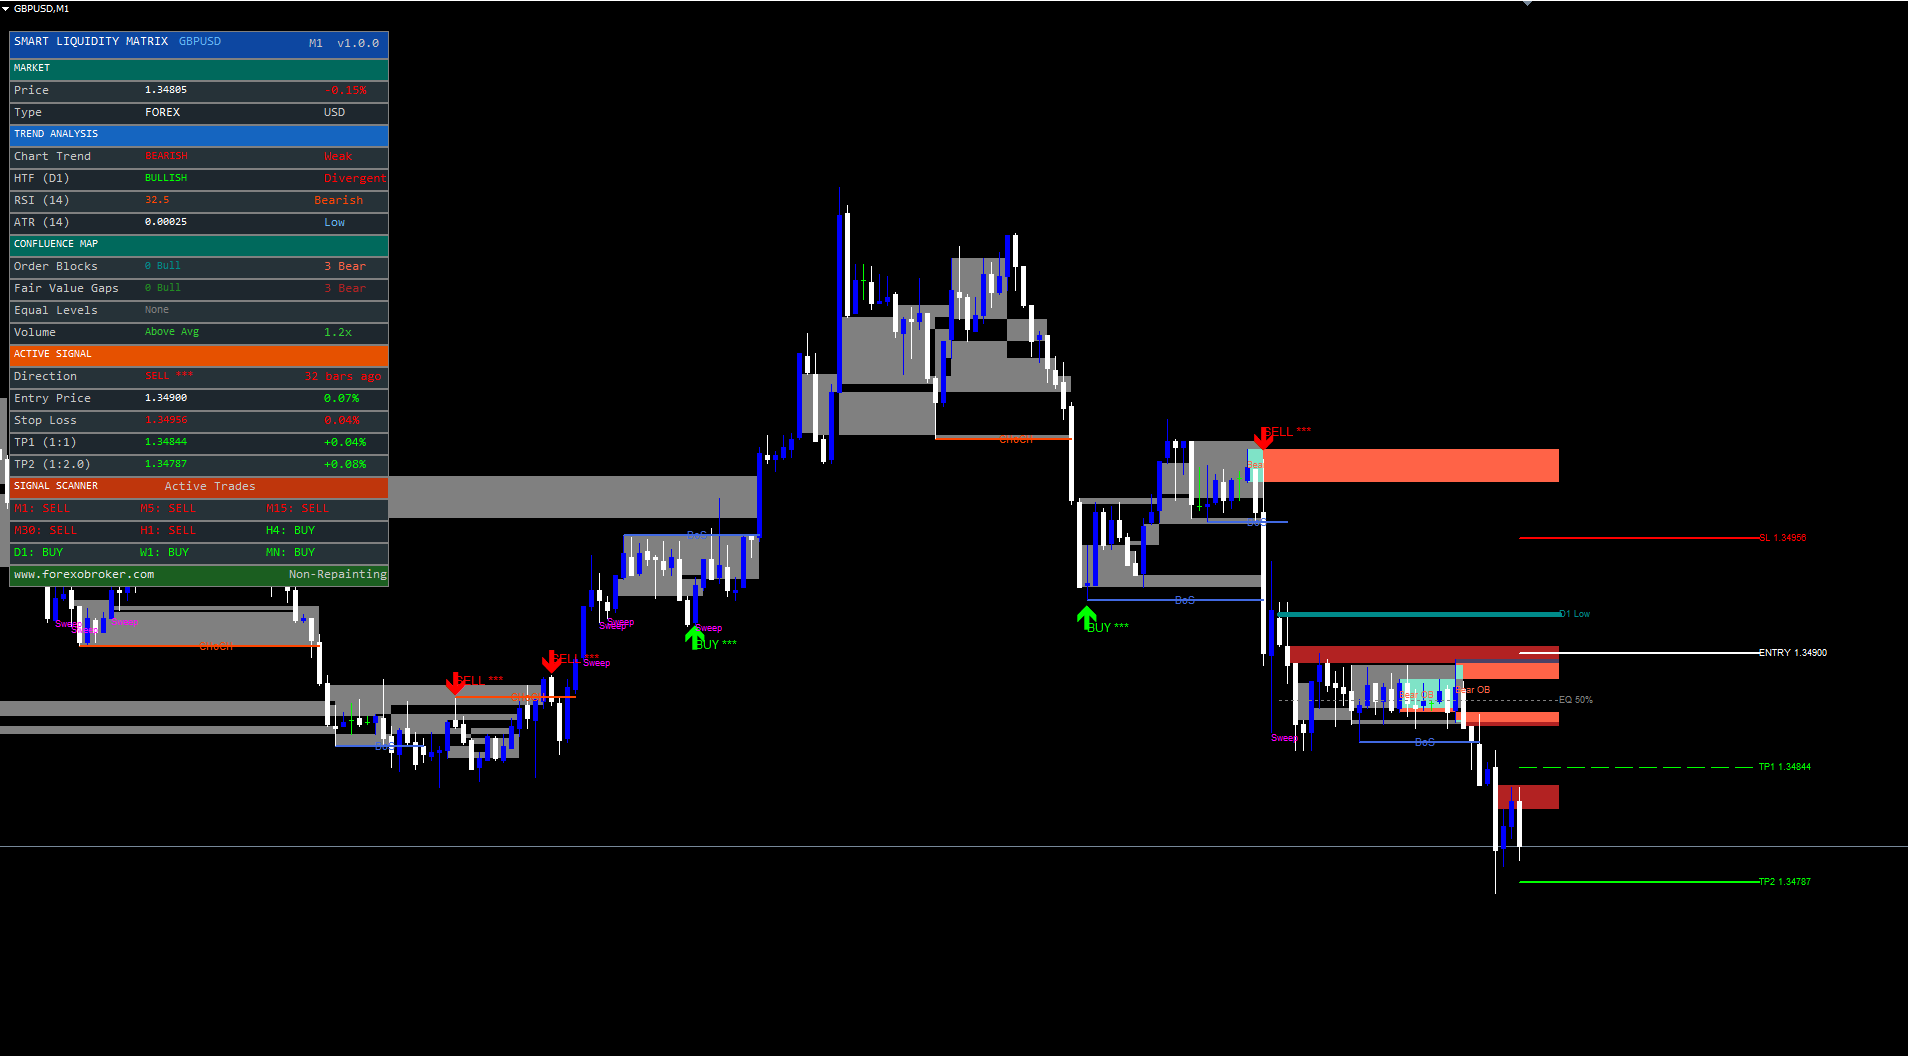
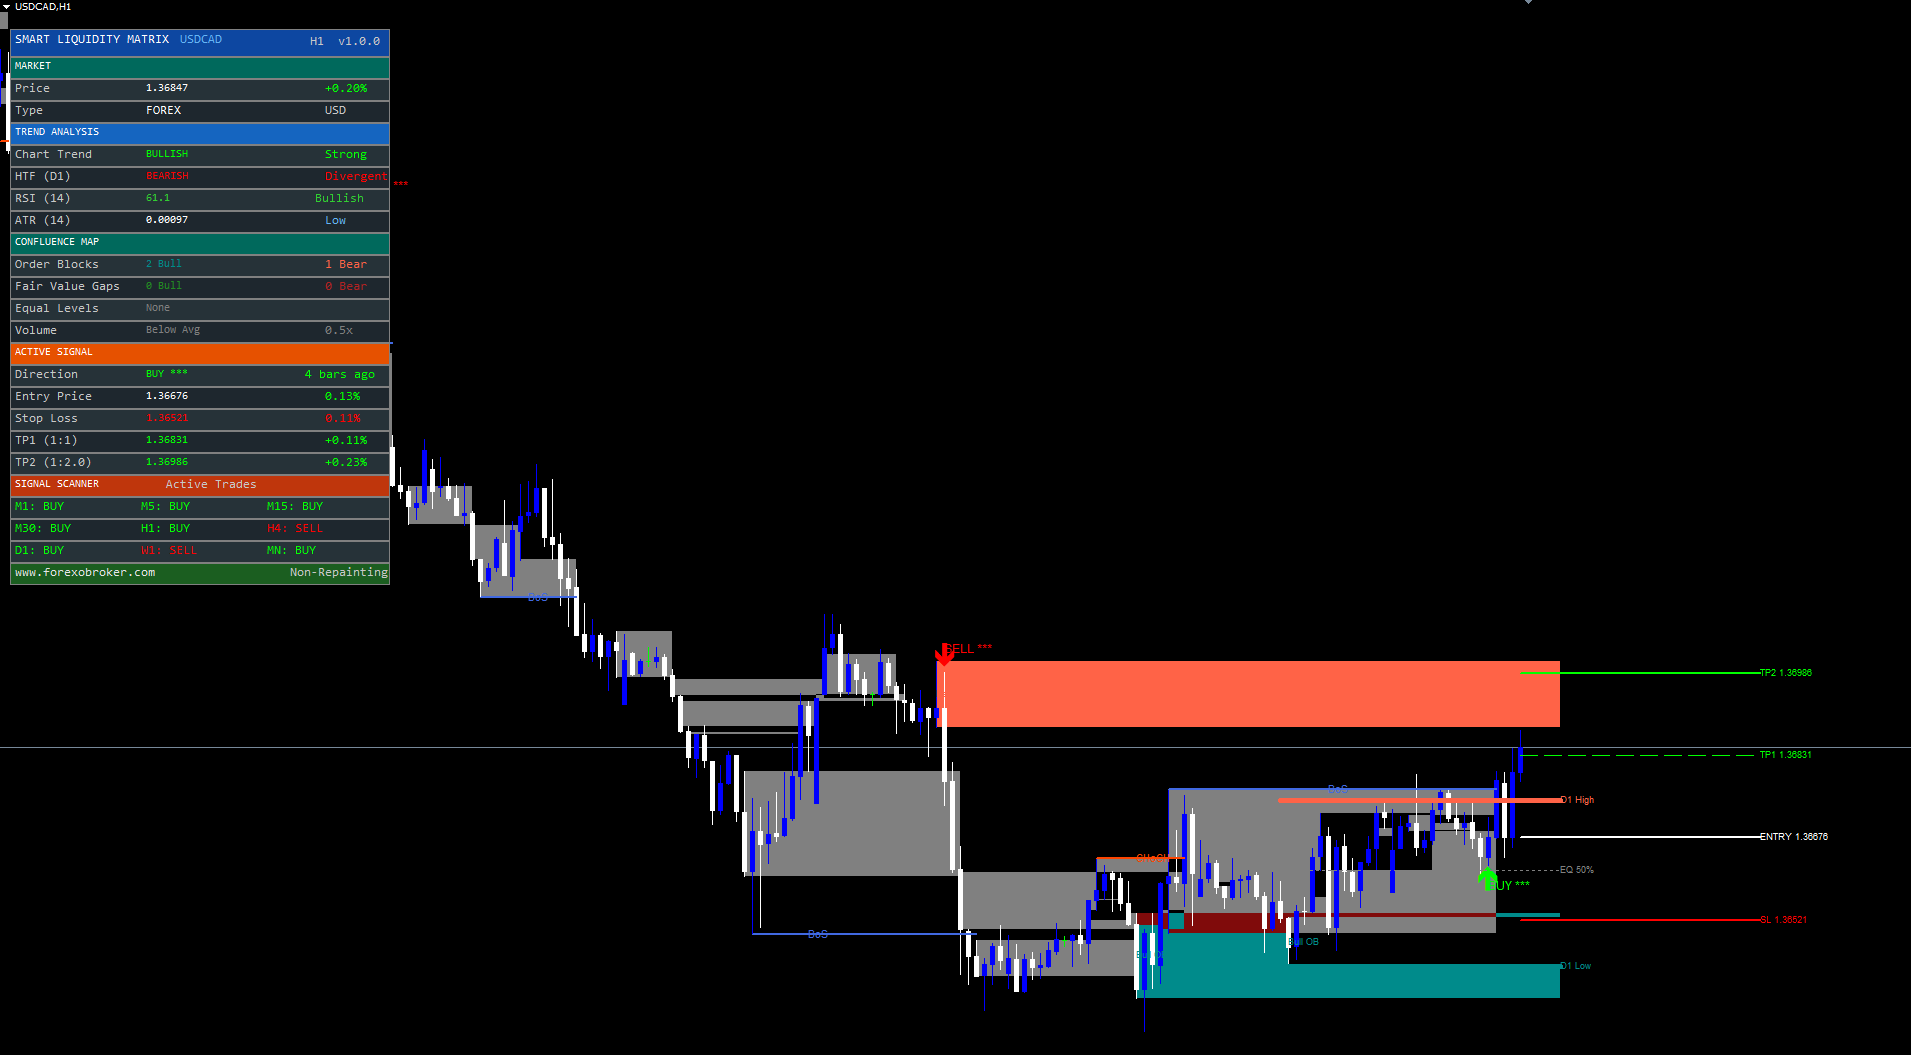
Signal System Overview
Each signal consists of visual components on the chart that communicate direction, confluence quality, and risk management levels.
Signal Arrow. BUY signals display a green upward arrow (Wingding 233) below the signal bar. SELL signals display a red downward arrow (Wingding 234) above the signal bar. Arrows appear only on confirmed (closed) bars and never move or disappear once printed.
Signal Label. Adjacent to the arrow, a text label shows the direction ("BUY" or "SELL") followed by a star rating representing the confluence score. For example, "BUY *" indicates a buy signal with a score of 3 out of 5.
Confluence Score. The score reflects how many confluence conditions align at the moment of entry. The signal engine evaluates EMA alignment, pivot retest proximity, candle direction, and RSI conditions. Higher scores indicate stronger confluence. A score of 3 is standard; scores of 4 or 5 indicate exceptional alignment across multiple Smart Money components.
SL/TP Lines. When a signal fires, horizontal lines are drawn at the entry price (white solid), stop loss (red dashed), TP1 at 1:1 risk-reward (green dashed, thin), and TP2 at the configured risk-reward ratio (green dashed, thick). These lines extend forward from the signal bar to provide ongoing visual reference.
Market Structure Settings
These parameters control swing detection and the display of Break of Structure and Change of Character events.
| Parameter | Default | Description |
|---|---|---|
| SwingLen | 5 | Number of bars on each side required for pivot confirmation. Lower values (3-4) detect more pivots on lower timeframes. Higher values (8-10) detect only major pivots for swing/position trading |
| ShowBoS | true | Display Break of Structure lines on the chart. BoS events confirm trend continuation |
| BosColor | clrRoyalBlue | Color for BoS lines and labels |
| ShowCHoCH | true | Display Change of Character lines on the chart. CHoCH events signal potential trend reversals |
| ChochColor | clrOrangeRed | Color for CHoCH lines and labels |
| MaxStructLines | 5 | Maximum number of structure lines displayed simultaneously. Oldest lines are removed first when the limit is reached |
How market structure works:
- When a new pivot high is confirmed, the current swing low is locked as the structural low
- When a new pivot low is confirmed, the current swing high is locked as the structural high
- A bullish break occurs when a bar closes above the locked structural high
- If the previous trend was bearish, the break is classified as CHoCH (reversal); otherwise it is BoS (continuation)
- The same logic applies in reverse for bearish breaks below the locked structural low
TIP: For M15-H1 charts, SwingLen = 5 provides a good balance between sensitivity and reliability. For D1 and above, increase to 8-10 to filter out minor swings and focus on significant structural pivots.
Order Block Settings
Order blocks are detected at confirmed pivot points and drawn as rectangular zones extending forward on the chart.
| Parameter | Default | Description |
|---|---|---|
| ShowBullOB | 3 | Number of bullish order blocks to display (0 = disabled, max 10). Oldest blocks are removed when this limit is reached |
| BullOBColor | clrDarkCyan | Color for bullish order block borders and labels |
| ShowBearOB | 3 | Number of bearish order blocks to display (0 = disabled, max 10) |
| BearOBColor | clrTomato | Color for bearish order block borders and labels |
| OBScanBars | 5 | Number of candles before the pivot to scan for the OB candle. The indicator looks for the last opposing candle within this range |
Detection logic:
- At a confirmed pivot low, the indicator scans up to OBScanBars candles before the pivot for the first bearish candle (close < open). The high and low of that candle define the bullish OB zone
- At a confirmed pivot high, the indicator scans for the first bullish candle. Its high and low define the bearish OB zone
- If no opposing candle is found within the scan range, the pivot bar itself is used
Invalidation: A bullish OB is invalidated when a confirmed bar closes below its bottom boundary. A bearish OB is invalidated when a bar closes above its top boundary. Invalidated blocks are grayed out and removed from the active count.
NOTE: Setting ShowBullOB or ShowBearOB to 0 completely disables detection for that side. This is useful if you want to focus only on FVGs or market structure without OB clutter.
Fair Value Gap Settings
Fair Value Gaps are three-bar patterns where the wicks of bar one and bar three do not overlap, creating an untraded price zone.
| Parameter | Default | Description |
|---|---|---|
| ShowBullFVG | 3 | Number of bullish FVGs to display (0 = disabled, max 10) |
| BullFVGColor | clrForestGreen | Color for bullish FVG zone borders |
| ShowBearFVG | 3 | Number of bearish FVGs to display (0 = disabled, max 10) |
| BearFVGColor | clrFireBrick | Color for bearish FVG zone borders |
Detection logic:
- Bullish FVG: The low of the current bar is higher than the high of two bars ago, creating an upward gap
- Bearish FVG: The high of the current bar is lower than the low of two bars ago, creating a downward gap
FVG zones are drawn as dashed rectangular outlines extending forward from the middle bar of the pattern.
Invalidation: A bullish FVG is invalidated when a bar closes below its bottom boundary. A bearish FVG is invalidated when a bar closes above its top boundary. Invalidated FVGs are grayed out and removed.
Signal Engine Configuration
The signal engine generates buy and sell arrows based on multi-condition confluence. These parameters control its behavior.
Core Signal Settings
| Parameter | Default | Description |
|---|---|---|
| EnableSignals | true | Master switch for the signal engine. Set to false to use Smart Money components as pure analysis tools without signals |
| MinConfluence | 2 | Minimum confluence score required to fire a signal (range: 2-5). Higher values produce fewer but more selective signals |
| SignalCooldown | 20 | Minimum number of bars between consecutive signals. Prevents rapid-fire signals during choppy conditions |
Higher Timeframe Filter
| Parameter | Default | Description |
|---|---|---|
| UseHTF | true | Enable the higher timeframe EMA trend filter. When enabled, the dashboard shows whether the HTF trend aligns with or diverges from the chart trend |
| HTFTF | PERIOD_D1 | The timeframe used for higher timeframe trend evaluation |
| HTFEmaLen | 50 | EMA period on the higher timeframe. Price above this EMA = bullish HTF, below = bearish HTF |
How the HTF filter works: The indicator calculates an EMA of HTFEmaLen periods on the HTFTF timeframe. If the current price is above this EMA, the HTF is classified as bullish. If below, bearish. The dashboard displays "Aligned" (green) when the HTF agrees with the chart trend direction and "Divergent" (red) when they conflict.
TIP: For chart timeframes of M15-H1, use HTFTF = D1 with HTFEmaLen = 50. For H4 charts, consider HTFTF = W1. The HTF filter provides directional context but does not directly gate signal generation -- it is displayed in the dashboard for discretionary use.
Risk Management
Smart Liquidity Matrix calculates stop loss and take profit levels automatically for each signal based on the structural context of the entry.
| Parameter | Default | Description |
|---|---|---|
| ShowSLTP | true | Display SL/TP/Entry lines on the chart when a trade is active |
| RRRatio | 2.0 | Risk-reward ratio for TP2 (range: 1.0-5.0). TP1 is always at 1:1 |
| SLPadding | 0.2 | ATR multiplier for padding below/above the pivot used as SL anchor |
Stop Loss Validation Logic
The stop loss is not placed at a fixed distance from entry. Instead, it uses the structural pivot as an anchor:
- For BUY signals: SL is placed below the most recent pivot low, minus SLPadding x ATR for breathing room
- For SELL signals: SL is placed above the most recent pivot high, plus SLPadding x ATR
- Validation check: If the pivot is on the wrong side of entry (pivot low above entry for a buy, or pivot high below entry for a sell), the indicator falls back to 1.5 ATR from entry
- ATR cap: The maximum SL distance is capped at 2.0 ATR from entry, preventing excessively wide stops on instruments with distant pivots
Take Profit Calculation
| Level | Formula | Example (SL distance = 50 pips) |
|---|---|---|
| TP1 | Entry + 1 x risk | 50 pips from entry |
| TP2 | Entry + RRRatio x risk | 100 pips from entry (at RRRatio = 2.0) |
The "risk" is the distance from entry to SL. A trader can scale out at TP1 (close half the position and move SL to breakeven) and let the remainder run to TP2.
IMPORTANT: The stop loss validation ensures that the SL is always on the correct side of entry. A buy signal will never have a stop loss above the entry price, and a sell signal will never have a stop loss below entry. This is enforced programmatically in the signal engine.
Liquidity and Equal Levels Settings
Equal highs, equal lows, and liquidity sweeps are key components of the Smart Money framework. These parameters control their detection and display.
| Parameter | Default | Description |
|---|---|---|
| ShowEqLevels | true | Display Equal Highs and Equal Lows lines on the chart |
| EqHighColor | clrTomato | Color for equal high lines and labels |
| EqLowColor | clrDarkCyan | Color for equal low lines and labels |
| ShowLiqSweep | true | Highlight liquidity sweep events with text labels |
| LiqSweepColor | clrMagenta | Color for sweep labels |
Equal Levels Detection: When the two most recent swing highs are within 0.1 ATR of each other, the indicator draws a dotted horizontal line at their average price, labeled "EQH." The same logic applies to equal lows, labeled "EQL." These lines represent liquidity pools where stop orders cluster above (equal highs) or below (equal lows) the level.
Liquidity Sweep Detection: A sweep occurs when price briefly exceeds an equal level or previous period high/low but closes back on the original side. An upside sweep is detected when the bar's high exceeds the level but the close is below it. A downside sweep is the mirror. When detected, the indicator places a "Sweep" label at the sweep point and fires an alert if alerts are enabled.
Previous Period Levels
| Parameter | Default | Description |
|---|---|---|
| PrevPeriodTF | PERIOD_D1 | Timeframe for previous period high/low calculation |
| ShowPPH | true | Show previous period high line |
| PPHColor | clrTomato | Color for previous period high |
| ShowPPL | true | Show previous period low line |
| PPLColor | clrDarkCyan | Color for previous period low |
| ShowEquilibrium | true | Show 50% equilibrium level between swing high and swing low |
The previous period levels are drawn as horizontal lines extending across the chart. They use the completed bar (bar index 1) of the configured timeframe, so on a D1 setting they represent yesterday's high and low. The equilibrium line is drawn at the midpoint between the current swing high and swing low, representing the 50% retracement level.
NOTE: Previous period levels serve as key reference points for institutional trading. Sweeps of the previous day's high or low often precede reversals, as institutions use these levels to collect stop orders before initiating directional moves.
Dashboard Guide
The premium dashboard is a five-section on-chart panel that provides a comprehensive real-time overview of indicator state without requiring visual chart interpretation.
Dashboard Settings
| Parameter | Default | Description |
|---|---|---|
| ShowDashboard | true | Show or hide the dashboard panel |
| DashPosition | Top Left | Dashboard placement. Options: Top Right, Top Left, Bottom Right, Bottom Left, Middle Right, Middle Left |
Section 1: Market
| Row | Description |
|---|---|
| Price | Current close price with daily change percentage (green = positive, red = negative) |
| Type | Instrument type and account currency |
Section 2: Trend Analysis
| Row | Description |
|---|---|
| Chart Trend | Market structure direction (BULLISH / BEARISH / NEUTRAL) with strength assessment (Strong / Weak / Flat based on EMA 20 vs EMA 50) |
| HTF Trend | Higher timeframe EMA trend (BULLISH / BEARISH / OFF) with alignment status (Aligned / Divergent) |
| RSI (14) | Current RSI value with zone label (Overbought / Oversold / Bullish / Bearish / Neutral) |
| ATR (14) | Current ATR value with volatility classification (HIGH / Normal / Low) |
Section 3: Confluence Map
| Row | Description |
|---|---|
| Order Blocks | Count of active bullish and bearish OBs (e.g., "2 Bull" and "1 Bear") |
| Fair Value Gaps | Count of active bullish and bearish FVGs |
| Equal Levels | Shows "EQH" and/or "EQL" when equal highs/lows are detected, with "Liquidity" tag |
| Volume | Volume status relative to 20-bar SMA (HIGH / Above Avg / Below Avg) with multiplier ratio (e.g., "1.8x") |
Section 4: Active Signal
| Row | Description |
|---|---|
| Direction | BUY (green), SELL (red), or WAITING (gray), with star rating and bars-since-signal count |
| Entry Price | Signal entry price with live P&L percentage |
| Stop Loss | SL price (red) with distance as percentage of entry |
| TP1 (1:1) | TP1 price (green) with percentage gain |
| TP2 (1:R) | TP2 price (green) with percentage gain, where R = configured RRRatio |
Section 5: Signal Scanner
A 3x3 grid showing EMA 20/50 trend direction for all 9 standard timeframes:
| Row | Timeframes |
|---|---|
| Row 1 | M1, M5, M15 |
| Row 2 | M30, H1, H4 |
| Row 3 | D1, W1, MN |
Each cell displays "BUY" (green) or "SELL" (red) based on whether EMA 20 is above or below EMA 50 on that timeframe.
The dashboard footer displays the Forexobroker website URL and a "Non-Repainting" confirmation label.
TIP: If the dashboard overlaps with price action, change DashPosition to a different corner or side. On lower timeframes with frequent price movement, Top Left or Middle Left keeps the dashboard away from the most recent candles.
Alert Configuration
Smart Liquidity Matrix supports three alert delivery channels and 11 distinct alert events.
Alert Channels
| Parameter | Default | Description |
|---|---|---|
| EnableAlerts | true | Master switch for all alerts (popup + sound) |
| EnablePush | true | Send push notifications to the MetaTrader mobile app |
| EnableEmail | false | Send email notifications |
Alert Events
The indicator fires alerts for the following events (live bars only, one alert per event per bar):
| Alert Event | Example Message | ||
|---|---|---|---|
| Buy Signal | `Smart Liquidity Matrix: BUY signal on EURUSD H1 \ | Score: 3/5 \ | Price: 1.08542` |
| Sell Signal | `Smart Liquidity Matrix: SELL signal on EURUSD H1 \ | Score: 3/5 \ | Price: 1.08542` |
| Bullish BoS | SLM: Bullish BoS on EURUSD H1 | ||
| Bearish BoS | SLM: Bearish BoS on EURUSD H1 | ||
| Bullish CHoCH | SLM: Bullish CHoCH on EURUSD H1 | ||
| Bearish CHoCH | SLM: Bearish CHoCH on EURUSD H1 | ||
| Upside Sweep | SLM: Upside liquidity sweep on EURUSD H1 | ||
| Downside Sweep | SLM: Downside liquidity sweep on EURUSD H1 | ||
| TP1 Hit | Fires when price reaches the first take profit level | ||
| TP2 Hit | Fires when price reaches the second take profit level | ||
| SL Hit | Fires when the stop loss is reached |
Webhook JSON Example
For third-party platforms that accept webhook payloads, the alert messages can be parsed from the standard alert text. A typical webhook integration would extract:
{ "indicator": "Smart Liquidity Matrix", "signal": "BUY", "symbol": "EURUSD", "timeframe": "H1", "score": "3/5", "price": 1.08542 }
Enabling Push Notifications
- Install the MetaTrader mobile app on your phone (iOS or Android)
- Open the app and navigate to Settings > Messages
- Copy your MetaQuotes ID
- In the desktop MetaTrader, go to Tools > Options > Notifications
- Enter your MetaQuotes ID and enable notifications
- Ensure EnablePush = true in the indicator settings
Enabling Email Notifications
- In MetaTrader, go to Tools > Options > Email
- Check Enable
- Enter your SMTP server, port, login, password, and destination email address
- Click Test to verify the configuration
- Set EnableEmail = true in the indicator settings
Lite Mode
The LiteMode parameter (default: false) reduces the visual complexity of the indicator for cleaner chart display, especially useful on lower timeframes where many elements can overlap.
When Lite Mode is enabled:
- Order block borders are drawn with 1-pixel width instead of 2
- Equal high/low lines use only the dotted style without the thick background line
- Previous period level lines use dashed style with 1-pixel width instead of solid with 2-pixel width
- Structure lines are drawn at 1-pixel width
- All core detection and signal logic remains unchanged -- only the visual weight of drawn objects is reduced
TIP: Enable Lite Mode on M5 and M15 charts where order blocks, FVGs, and structure lines can create visual clutter. Disable it on H4 and D1 where fewer elements appear and the thicker lines improve visibility.
Troubleshooting and FAQ
Q: Does the indicator repaint?
A: No. All signals, order blocks, FVGs, and structure lines are calculated on confirmed (closed) bars only. Once an element appears on the chart, it is permanent. The indicator evaluates bar data at shift = 1 (the most recently completed bar) and never modifies objects placed on earlier bars. On first load, a history scan processes all available bars to reconstruct the state, which produces the same results as if the indicator had been running live throughout the entire chart history.
Q: What markets does it work on?
A: Smart Liquidity Matrix works on any instrument available in MetaTrader: Forex pairs, Crypto CFDs, Stocks, Indices, Commodities, and Metals. The indicator uses ATR-based calculations that automatically adapt to each instrument's volatility and price scale. No manual adjustment is needed when switching between instruments.
Q: What timeframes work best?
A: The indicator is functional on all timeframes from M1 to MN. For the signal engine, M15, H1, and H4 provide the best balance between signal frequency and signal quality. For the visual Smart Money components (order blocks, FVGs, structure), H1 and H4 produce the most clearly defined zones. Lower timeframes (M5, M15) may benefit from Lite Mode and reduced OB/FVG counts to avoid chart clutter.
Q: No signals are appearing on my chart.
A: Check the following in order:
- Ensure EnableSignals = true in the settings
- The signal engine requires EMA 20/50 alignment plus a pivot zone retest -- these conditions may not have occurred in the visible chart range. Scroll back in history to check for signals on earlier bars
- Verify the chart has sufficient historical data. The indicator requires at least 60 bars plus the warmup period for EMA and ATR calculations. If the chart is mostly empty, increase the Max Bars in Chart setting in MetaTrader's Options
- The SignalCooldown parameter (default: 20) prevents signals for 20 bars after each signal. On higher timeframes, this can mean several days between signals
- The one-trade-at-a-time rule means a new signal cannot fire until the current trade closes via SL, TP, or EMA crossover reversal
Q: Why do some timeframes show signals but others don't?
A: This is normal and by design. The signal engine requires ALL of the following conditions to align simultaneously on a confirmed (closed) bar:
- EMA Trend: EMA(20) must be clearly above EMA(50) for BUY, or below for SELL. On timeframes where the market is ranging or the EMAs are flat/crossing, no signal can fire.
- Pivot Zone Retest: Price must pull back to within 0.3 x ATR of the last swing low (for BUY) or swing high (for SELL). In strong momentum moves with no pullback, no entry zone is reached.
- Confirming Candle: The bar must close bullish (Close > Open) for BUY or bearish (Close < Open) for SELL.
- RSI Filter: RSI(14) must not be overbought (< 70 for BUY) or oversold (> 30 for SELL).
- No Active Trade: Only one trade is tracked at a time. A new signal cannot fire until the previous trade closes via SL hit, TP hit, or EMA trend reversal.
Different timeframes have different market conditions. A 15-minute chart might show a clear downtrend with SELL signals while the 4-hour chart is still ranging with no signals. Use the Signal Scanner in the dashboard to see which timeframes currently have active signals without switching charts manually.
Q: Order blocks appear but are immediately gray.
A: Gray order blocks have been invalidated. A bullish OB is invalidated when a bar closes below its bottom boundary. Check the historical bars after the OB was created -- if price moved through the zone, invalidation is correct. Increase SwingLen to detect OBs at more significant pivots that are less likely to be immediately invalidated.
Q: The dashboard is not visible or is off-screen.
A: Try changing DashPosition to Top Left . The dashboard computes its position from chart dimensions and adjusts automatically on resize. If the chart window is very small, the dashboard may not fit. Resize the chart to at least 400 pixels wide and 600 pixels tall. You can also temporarily disable the dashboard with ShowDashboard = false to verify that the indicator itself is running correctly.
Q: Can I use this indicator for automated trading (EA)?
A: Smart Liquidity Matrix is a custom indicator, not an Expert Advisor. It does not execute trades. However, you can use the signal arrows and SL/TP levels as the basis for a separate EA. The indicator writes to two buffers: buffer 0 for buy signals and buffer 1 for sell signals. An EA can read these buffers using iCustom() to detect signals programmatically.
Q: Why does the scanner show different results than expected?
A: The scanner uses EMA 20/50 crossover status on confirmed bars (bar index 1) for each timeframe. If you are looking at the current forming bar on one of those timeframes, the EMA relationship may change before the bar closes. The scanner deliberately uses bar 1 (confirmed) data for consistency with the indicator's non-repainting architecture.
Download the indicator:
- MetaTrader 5: Smart Liquidity Matrix MT5
- MetaTrader 4: Smart Liquidity Matrix MT4
CONTACT & SUPPORT
- Email: info@forexobroker.com
- Questions: Use the Comments section on the product page or send a private message
- Bug Reports: Please include your broker name, account type, and a screenshot
-
✅ All MQL Tools: https://www.mql5.com/en/users/forexobroker/ ✅
--------------------------------------------------------------------------------------------------------------
🏦 **Broker I use**: https://icmarkets.com/?camp=55869
🏦 **Broker For EU Traders I use 1**: https://www.ictrading.com?camp=91414
🏦 **Broker I use 2**: https://one.exnessonelink.com/boarding/sign-up/a/c_thuv62ocfq
💻 **VPS**: https://chocoping.com/processing/aff.php?aff=738
💼 **Companies I use for getting funded**:
Fundednext: https://fundednext.com/?fpr=kestutis39
The5ers: https://www.the5ers.com/?afmc=16kl
FTMO: https://trader.ftmo.com/?affiliates=nRAyOhmFRnEnFdOpdLeh


")
