")
DIDI ALERT – ATM Systems Needle Detector (English Version)

![]()
User manual
"DIDI ALERT - ATM Systems Needle Detector"
ATTENTION - READ THE MANUAL, EVEN IF YOU DOWNLOADED THE TRIAL VERSION!!!!
Dear user, the proper functioning of this application depends entirely on you! Before using it, please read the manual carefully, as EVERYTHING is explained in detail here, and avoid many problems!
This manual is complete and is designed to answer all the user's questions, as well as helping with settings and everything else the user needs, so READ IT COMPLETELY!
What is "DIDI ALERT - ATM Systems Needle Detector"
"DIDI ALERT" is a SOLUTION TO YOUR PROBLEMS OF INCONSISTENCY AND LOSS IN THE FINANCIAL MARKET, it is an advanced Metatrader 5 utility, developed in MQL5 and optimized by GPT-4 Artificial Intelligence. It performs real-time analysis of up to 100 symbols at three different chart times as defined in the Market Watch Window list. This provides remarkable efficiency and speeds up the process for traders who follow the methodology known as "AGULHADAS DO DIDI AGUIAR", allowing them to execute trading operations without the need to analyze each situation individually, which normally requires time and experience.
What's more, "DIDI ALERT" expands your possibilities of finding ideal scenarios for negotiations. Imagine the amount of trading opportunities that become available in seconds when up to 300 graphical windows (100 symbols times 3 timeframes) are analyzed instantly. The results are displayed in a graphical dashboard, making the search for opportunities not only faster, but also more intuitive.
Imagine how many trading opportunities will open up with using this powerful tool!
Through a lot of study, time and dedication of the ATM Systems team in the creation, development and programming aided by GPT-4 Artificial Intelligence to optimize and refine each line of our utility, we are very proud to present "DIDI ALERT - Needle Detector ".
What are Agulhadas (Needles)?
The term "Agulhadas" (Needles) belongs to the strategy of "Agulhadas do Didi Aguiar" (Didi's Needle Strategy)," a graphical analysis method created by Brazilian trader Odir Aguiar, known as Didi Aguiar. He developed an indicator called the Didi Index, made up of three moving averages (3, 8, and 20 periods) to identify entry and exit points in the financial market. Needlepoint occurs when the 3-period and 20-period moving averages cross above or very close to the 8-period moving average, similar to how a needle sews fabric and its threads intersect (when using the Didi Index) or when they pass through the same body as a CANDLE (when using the moving averages directly on the chart, as if it were a line passing through the eye of a needle). In our trading layout, we will be using the Didi Index indicator. This movement indicates a possible change in trend, which can be bullish or bearish, depending on the order of the moving averages. From this point onwards we will be calling the needles "agulhadas" to maintain the original term in Portuguese.
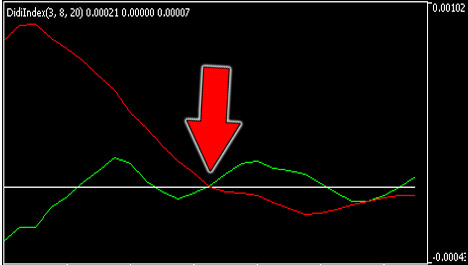
Agulhadas on DidiIndex
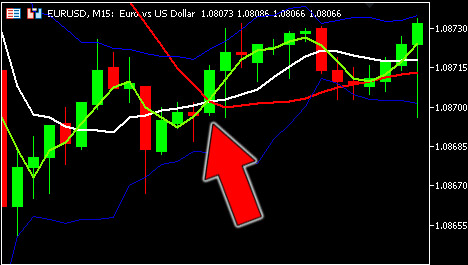
Needle Moving Averages directly on the chart
Didi Aguiar is an experienced investor with a lot of experience in this area and who has been in the financial market for over 40 years. He is passionate about surfing and the beach, hates the cold and winter and travels to other countries to avoid this season of the year and says he doesn't care much about the fundamentals of companies, but rather about discipline and attitude when buying and selling.
EXPERIENCE is what we seek most as a reference in this area and in many others IN OUR LIFE, so let's use DIDI INDEX!
Thank you very much Didi Aguiar for this powerful indicator that you have give us, which is the Didi Index! God bless you greatly .
How does "DIDI ALERT - ATM Systems Needle Detector" work?
"DIDI ALERT" is a revolutionary tool developed for MetaTrader 5 (MT5) by ATM Systems, designed to provide accurate and fast analysis to traders. Using a language optimized by GPT4 Artificial Intelligence, this utility is capable of processing a vast amount of information from DIDI INDEX, ADX and BOLLINGER BANDS indicators.
In a matter of seconds, "DIDI ALERT" performs a real-time analysis on assets or symbols previously selected in the Market Observations Window, covering three different graphic times (timeframes). The results of these analyzes are presented clearly and intuitively in a graphical panel, allowing quick and effective visualization of the information.
In addition, "DIDI ALERT" is used to identify trade entry opportunities according to Didi Aguiar's "STRATEGY OF THROWS", focusing on providing accurate, real-time analysis to assist investors in this specific aspect.
With all this, "DIDI ALERT" is able to analyze up to 300 chart windows in a few seconds, thus opening up countless trading opportunities, both Scalper, Day trade and Swing Trade and more.
The analyzes carried out on the DIDI INDEX, ADX and BOLLINGER BANDS indicators are as follows:
Needle - whether a BUY or SELL bullishness has occurred in the Didi Index; Trend - whether an upward trend has been detected above level 32 in the ADX; Opening - whether there is a significant opening above and below the BOLLINGER BANDS;
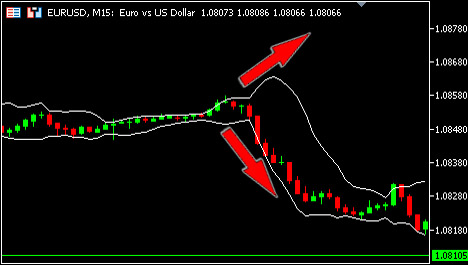
Buying or Selling Needle
According to Didi Aguiar's Needle Strategy, when there is only one needle, either Buy or Sell, but there is still no Bollinger Gap or Trend above level 32 on the ADX, this is an ALERT SIGNAL because in the next few candles the missing conditions (Bollinger and Trend) may form, thus signaling a trade entry
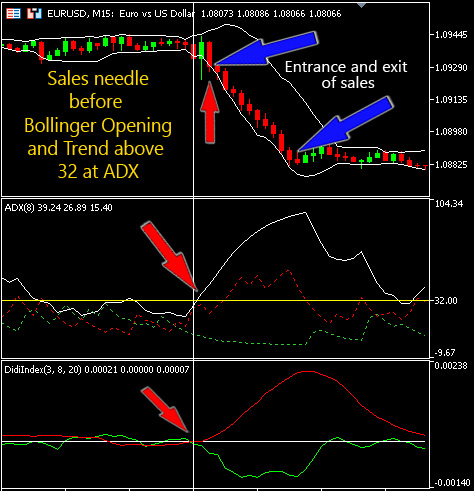
In this movement on the M15 we would get almost 400 points!
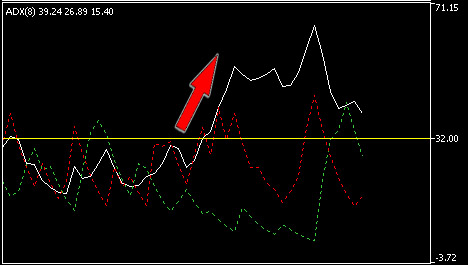
Trend in ADX above level 32
Our "DIDI ALERT" utility analyzes the trend line of the ADX Indicator (Average Directional Movement Index) and every time it is above level 32 and growing it will display "YES" on the main Panel.
Opening Bollinger Bands
Here we analyze whether there is a significant or expressive opening of the Bollinger Bands, it will only be considered if both (upper and lower) are in a significant opening, and then it will display "YES" in the Main Panel.
Complete Needle
When the Needle, Trend and Opening fields are "positive" simultaneously, i.e. the combination of a "BUY" or "SELL" Needle, a "YES" for ADX Trend and a "YES" for Bollinger Bands Open on the same asset and same timeframe, then we have a Complete Needle that will display a highlight on that set in the Main Panel.
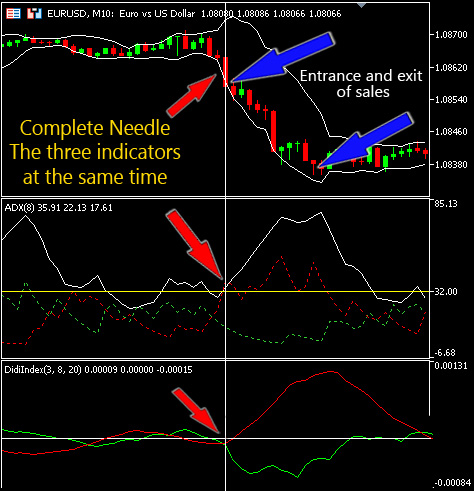
In this movement in M10 we would get at least 200 points!
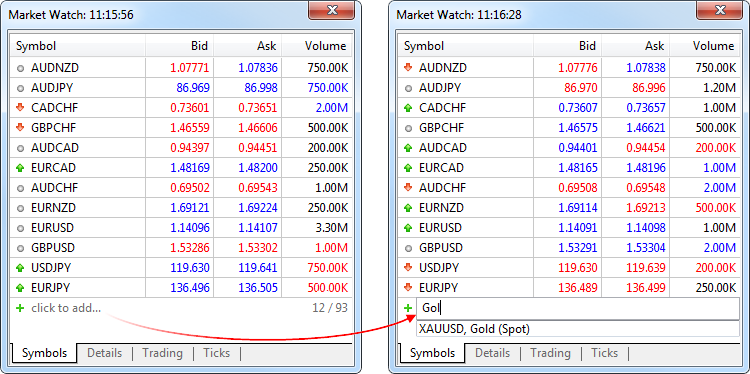
Observed Assets
If this window isn't showing up, go to the Menu bar > View > Market Watch or use the shortcut keys Ctrl + M, then just below the last asset there is "+ Click to add" just click and add the ones you want.
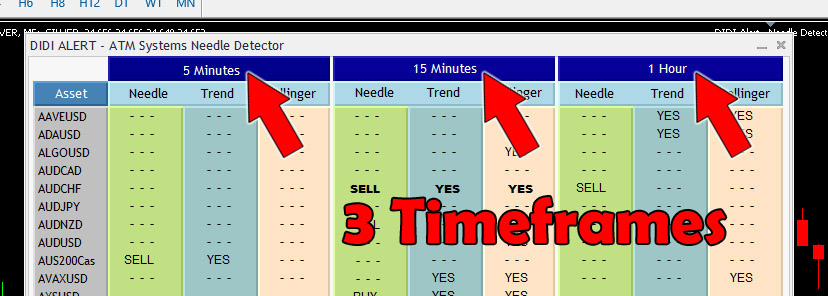
Three simultaneous analysis times (Timeframes)
In addition to the 100 assets or symbols under observation , it is also possible to choose 03 three timeframes for these analyzes to be carried out, from the M5 (5 minutes) to D1 (1 day), resulting in up to 300 graphical windows analyzed in a few seconds. ..
Intuitive Graphical Panel - Displaying the results
If not, there will be no change in the panel, the characters "- - -" will remain. If a needle is detected, "BUY" or "SELL" may be displayed in the respective columns. If a Trend is detected in the ADX or Bollinger Bands Opening, "YES" will appear in the respective columns. In the event of a Complete Needle, there will be a visual highlight (BOLD) on that specific set.

Notifications, Alerts, Needle Log and Navigation
The "DIDI ALERT - Needle Detector" has an advanced system of Alerts, visual and audible notifications that helps the user not to miss opportunities.
In the "Input Parameters" tab it is possible to activate and deactivate several warning options:
Enable/Disable alert sound: Sound notification.
Push Notifications on mobile: Push notification to your cell phone.
E-Mail Notifications: Notification via e-mail.
Needle log : Records and displays a list of the latest Buy, Sell and Complete Agulhadas.
Preparing the work environment for "DIDI ALERT - ATM Systems Needle Detector"
Before running the utility for the first time, the user should prepare the MT5 environment for better performance and work, as it is through this layout that the user will make the analysis and trade decision:
- Define the symbols or assets in the "Market Observations" Window that you want to be analyzed (Up to 100 items, above that the program will be closed to avoid crashes - skip this item if you are in the trial version )
- Configure the window that we will call BASIC , where "DIDI ALERT" will be loaded and the graphical panel with the results of the analysis will be displayed, open a graphical window with any asset and leave only the graphical without any other indicator, oscillator, volume, etc., delete everything there, leaving only the price chart, leaving it all "Clean".
- Configure another window that we will call DEFAULT (default) , open a chart window with any asset, delete everything there, leaving only the price chart, it will be used as a default to open new chart windows for verification, follow the following steps, the fields that are not informed must remain unchanged:
3.1
Enter the "Custom" Bollinger Bands as follows:
In the menu bar, click Insert > Indicators > Customize > BB With the following values:
Input Parameters: Period 8, Shift 0, Deviation 2 Colors:
Bands Middle None, Bands Upper White, Bands Lower White.
3.2
Enter the ADX Indicator (Average Directional Movement Index) with the following values:
Parameters: Period 8, Style White and continuous line, +DI Limegreen, -DI Red
Levels: Add a level value 32.
3.3
Insert the Didi Index Indicator
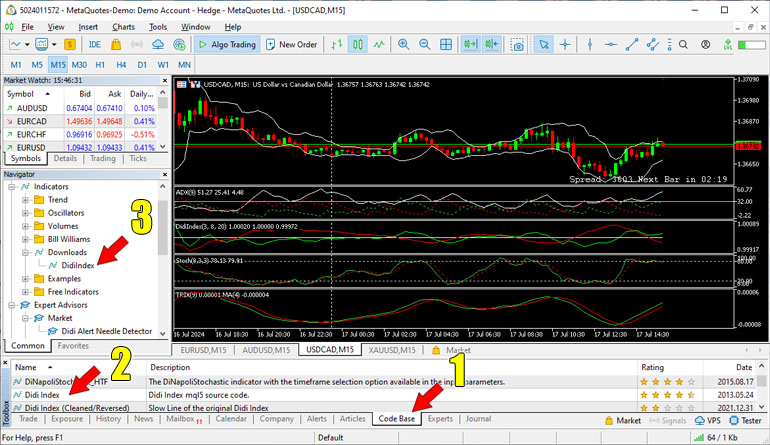
This indicator must be downloaded from the Library tab (1)* of the toolbox (Ctrl +T) find
"Didi Index | Didi index source code in MQL5" (2)* right click and download (you can look
for it to be found in all Metatrader 5 without exception) then go to the browser window (3)*
Indicators > Downloads > DidiIndex and double click Modify the following values:
Colors: Fast Line - Limegreen and Slow Line -Red. *see demonstrative image below
3.4
Enter the Stochastic Indicator with the following values:
Parameters: Period %K 8, Period %D 3, Delay 3, Simple Method.
3.5
Enter the TRIX (Triple Exponential Average) Indicator with the following values:
Parameters: Period 9, Apply to: Close, Style: Limegreen
Insert a Moving Average into the TRIX window. Attention, through the NAVIGATOR window
within Indicators, in the Trend folder, click and drag Moving Average to the TRIX window with
the following values:
Parameters: Period 4, Offset 0, Simple Method, Apply to: "Previous indicator data", Red Style
4. After finishing the configuration step, save as a template: right click on a free area from the chart
window >> Templates >> Save Template, name it as default and click on Save, now every new chart
window that is opened will be initialized with this new Layout, REPEAT the process AGAIN and now
save with the name needle, this will be used in the Strategy Tester.
The screen should look like this (red highlight):
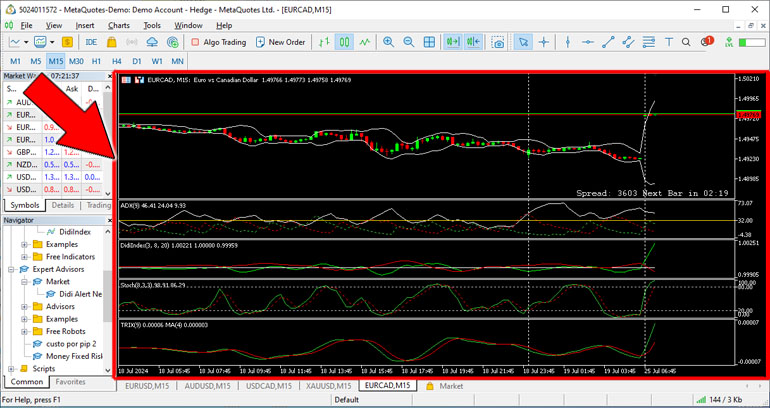
If something is different, close the chart window and start again observing each step, it is very important that it is carried out correctly because a wrong parameter value and we will obtain erroneous results, leading to mistakes or losing opportunities to enter the trade.
"INPUT PARAMETERS" tab - What do we have here?
In this section will present the various configuration options that our utility has available, the configuration groups are separated into:
General Settings:
Magic number: The user must enter the Detector's magic number, which is a unique identifier that allows the Detector to recognize its own operations and avoid errors with other EAs. The default value is 1, but the user can change it if they wish.
Language: The user can choose between English (EN) and Brazilian Portuguese (PTBR).
Moving Average Settings:
Enter the parameters of the moving averages that the Detector will use to analyze the market. Moving averages are indicators that show the trend of prices over time. The Detector uses two moving averages: a fast one and a slow one. The fast average is more sensitive to price changes, while the slow average is more stable. Enter the period and offset of each moving average. The period is the number of bars used to calculate the average. The offset is the number of bars that are shifted to the right or left. This section contains some conditions that must be met for the "DIDI ALERT" to work. It checks that the values of the fast average and slow average parameters are within acceptable limits. If not, it prints an error message and prevents the Detector from running. The conditions are as follows:
- Fast Average Period must be an integer greater than or equal to 2. This value represents the number of periods used to calculate the fast moving average.
- Fast Moving Average Shift must be an integer greater than or equal to 0. This value represents the number of periods that the fast moving average is shifted to the right.
- Slow Moving Average Period must be an integer greater than or equal to 15. This value represents the number of periods used to calculate the slow moving average.
- Slow Moving Average Shift must be an integer greater than or equal to 0. This value represents the number of periods that the slow moving average is shifted to the right.
- Fast Average Offset must be less than the Slow Average Offset value. This ensures that the fast moving average is closer to the current price than the slow moving average.
Timeframe Settings:
Enter the three time periods that the Detector uses to analyze the market. Timeframes are units of time that divide the price chart into bars or candles. Each bar or candle represents the opening, closing, high and low price of a given period of time. The Detector uses three time periods: a first, a second and a third. The first time period is the shortest and the third is the longest. The user must choose one of the values that ranges from M5 (5 minutes) to D1 (1 day)
Timeframes must be configured following the rules below:
- For the Timeframe 1 field, choose one of the available values that is equal to or greater than M5 . This field represents the first chart time.
- For the Timeframe 2 field, choose one of the available values that is equal to or greater than M6 . This field represents the second graphic time.
- For the Timeframe 3 field, choose one of the available values that is equal to or less than D1 . This field represents third graphic time.
- Make sure that the values of Timeframes 1, 2 and 3 are different and ordered in ascending order, that is, Timeframe 1 is the smallest, Timeframe 2 is the intermediate and Timeframe 3 is the largest. Or an error warning window will be displayed.
About the Verification Pause
The verification pause will occur based on timeframe 1, in case of Complete Agulhadas in timeframes 2 and 3 the sound warning and PUSH and Email notifications (if activated) will be issued while within this verification cycle.
What is verification pause? (Not to be confused with notification interval)
In order to avoid unnecessary use of the processor and not cause slowdowns or crashes, "DIDI ALERT" uses a preset time for the system to carry out the analysis in search of the conditions for a COMPLETE NEEDLE, which we call verification pauses.
Verification Pause
Through analysis, testing and verification, the ATM Systems team found the pause values that demonstrated the best sensitivity and detection accuracy.
The predefined detection pauses are:
| Período | Pausa de verificação |
| 5 minutos (M5) | 1 minuto |
| 2 horas (H2) | 5 minutos |
| 4 horas (H4) | 10 minutos |
| 12 horas (H12) | 30 minutos |
| 1 dia (D1) | 60 minutos ou 1 hora |
For example: If the Timeframe 1 value of 4 hours (H4) is chosen, the check will occur every 10 minutes.
Long Asset Name Configurations:
Enable and Disable "long asset names": This option has the function of displaying long asset names, in case your broker uses long names such as DERIV with its various "synthetic assets", with more than 20 characters, making the visualization and operation of Didi Alert not impaired and facilitating identification for the user.
Color Settings
Background and text colors: Enter the background and text colors that the Detector uses to display information on the screen. Detector displays information in a table with multiple columns and rows. Each column and row has a specific background color and text color.
Notifications and Alerts
Enable/Disable alert sound:
Enable/Disable alert sound: Inform whether the Detector should emit an alert sound when it detects an opportunity to enter the market. The alert sound is an audible signal that draws the user's attention to the screen. The Detector emits the alert sound if the logical value is true, or does not emit it if the value is false. The default value is true.
Enable/Disable Push and E-Mail Notifications:
Push notifications are messages sent to the cell phone of the user who has installed Metatrader Mobile. Email notifications are messages sent to the user's email. This option must be properly configured in the Metatrader 5 options. For more information and help, see the necessary documentation on the mql5.com website, Configuring the MetaTrader 5 platform .
Push Notifications on mobile: DIDI Alert sends notifications via push if the value is true, or does not send if the value is false. The default value is false.
E-Mail Notifications*: DIDI Alert sends notifications via email if the value is true, or does not send if the value is false. The default value is false.
Needle notifications : Will display the latest Agulhadas (simple and complete) as a Needle Log in the Experts tab if the value is true, or not if the value is false. The default value is false.
Interval for PUSH/Email Notifications: Enter the time interval that the Detector must wait between sending notifications, by default this value cannot be equal to or greater than timeframe 1 or it will report an error and a warning window will appear, to prevent the Detector from sending repeated or excessive notifications, find a balance between the sending interval and the chosen timeframe. For example, if longer timeframes such as H8 H12 and D1 are chosen, an interval of 1 or 5 minutes is not necessary!
Available values: 1, 5, 10, 15, 30 minutes, 1, 2 and 4 hours.
DIDI Alert does not accept the value of the "Notification Interval" to be greater than or equal to the chosen Timeframe 1, as this will cause trading entry opportunities to be missed!
*ATTENTION: As the system for sending notifications via Email uses your Email's messaging server, we recommend using ONLY for longer timeframes, for example above M10, as some servers consider a very large flow in a short time as SPAM and can block your account! Due to internal settings, Gmail does not allow it to be used by the Metatrader 5 Platform to send notifications, we recommend Microsoft servers or another server of your choice. IMPORTANT WARNING
Do not inadvertently modify the information in the "INPUT PARAMETERS" tab, especially in the "Moving average settings" group of options, as this will result in "DIDI ALERT" malfunctioning, displaying false results.
Once the user has found the best configuration to work with "DIDI ALERT - Needle Detector from ATM Systems" they can use the feature available in the tab itself to save their preferences and use it again without having to start from scratch, by simply clicking on the Save button, but we at ATM Systems have developed it in such a way that excessive modifications are not necessary, as the utility is ready to work with the minimum changes required... There is also the possibility of restoring the default settings within the aforementioned tab, simply by using the "Reset" button.
By default on the MetaTrader 5 platform, changes made to the settings of Expert Advisors Utilities, etc., through the "Input Parameters" tab after initialization may have no effect or even cause the window or the MT5 tool in question to crash. Therefore, do not change these values while "DIDI ALERT - ATM Systems Needle Detector" is running.
If this has happened, go to the "Errors presented and possible solutions" section in the "Input Parameters Tab" paragraph.
Using the demo version of "DIDI ALERT - ATM Systems Needle Detector"
Limitations of the MT5 Strategy Tester
In test demo mode, ALL programs are run in the environment of the STRATEGY TESTER and there are some details that we have to note:
- Limitations of the Strategy Tester: The MT5 Strategy Tester simulates market behavior and trading operations, but does not completely replicate the normal execution environment. Some features and functionality may not be available or may function differently during testing .
- Limited Interactivity: When running a test in Strategy Tester, user interactivity is limited. This means that certain operations that depend on user interaction, such as clicking buttons or interacting with panels , may not work as expected.
- Differences in Control Flow: The control flow during running a test in Strategy Tester may be different from the real-time control flow. This can affect the way operations are performed and how events are handled, which can impact the functioning of buttons and panels, sound alerts, sending notifications, etc.
- Historical Data: The MT5 Strategy Tester, by default by the Metatrader development team itself, carries out its tests with summarized HISTORICAL DATA and not in REAL TIME !
Due to these limitations. the FUTURE BUYER's experience is impacted, leading him to believe that the programs themselves are bugged, of low quality or of questionable functioning, an example of the limitations and restricted functionalities of the Strategy Tester is with the Market Watch Window , as explained previously, Didi Alert - Detector de Agulhadas uses these assets, however in the strategy tester this list is not loaded, leading our team's programming sector to create an alternative list of the most common Forex assets used in the majority of brokers to overcome this problem and demonstrate the program's functioning, even if limited.
About Demo Version and your language
When using Didi Alert in the Demo version, the English user will notice that the result in the intuitive graphical panel is being displayed in Portuguese, but on the home page it said that our solution was bilingual, Brazilian Portuguese and English, however due to the limitations explained previously ONLY IN THE DEMO VERSION the results of the analyzes will be displayed in Brazilian Portuguese, IN THE PAID VERSION the User can configure between the two options.
To facilitate use, we will be displaying a translation table for using the Demo version:
| Portuguese | English |
|---|---|
| Hora | Hour |
| Minutos | Minutes |
| COMPRA | BUY |
| VENDA | SELL |
| SIM | YES |
| NÃO | NO |
Running the Demo version
ATTENTION!!! If you didn't want to read the manual and skipped the section [Preparing the work environment for "DIDI ALERT - Agulhadas Detector from ATM Systems"] Stop reading immediately, because at this point we need the AGULHADA layout configured and ready To proceed, go back, read and configure!
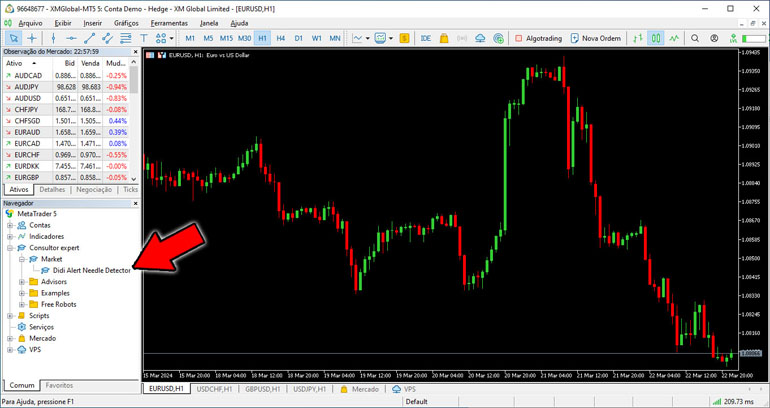
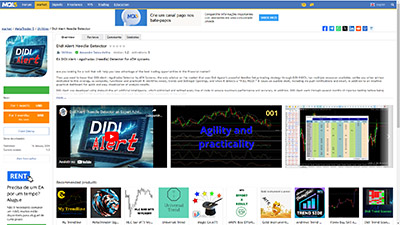
After downloading the DEMO version from the Market on the mql5.com website, the utility will appear in the structure of the NAVIGATOR window of your METATRADER 5 like this: Metatrader 5 >> Expert Consultant >> Market >> Didi Alert Needle Detector, below is the image to help you find your way around:
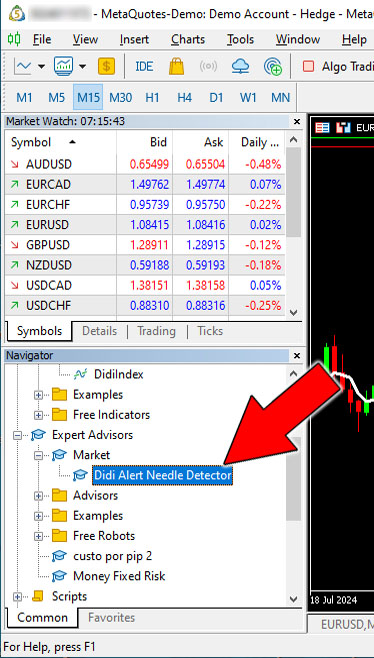
If it is not appearing, you can activate it using the shortcut keys Ctrl + N or Menu bar > View > Browser which will correct this, then double click on "DIDI ALERT - Needle Detector" as shown in the image above and it will open automatically the utility's presentation window with the Common tabs containing the description and the BUY, TEST options and the warning that it is the DEMO version and also the Input Parameters tab which in this mode CANNOT BE CHANGED but only viewed.
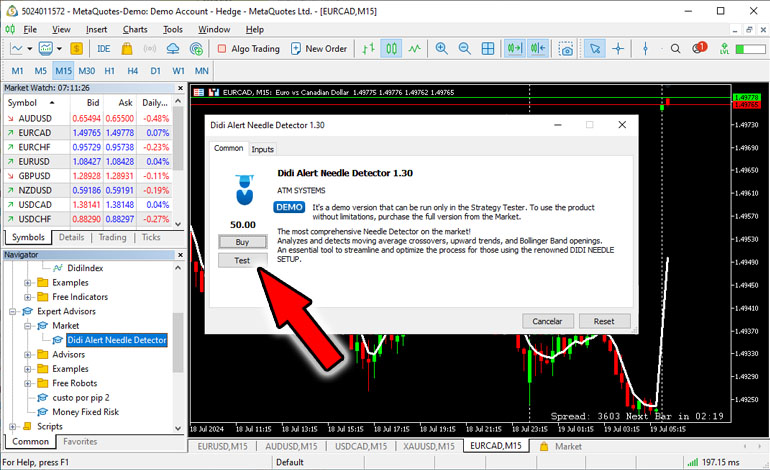
Our Utility is already pre-configured and without the need for changes, including, as explained previously, several functionalities will not be operational in test mode, but the main part of the tool's operation, which are the analyzes and display on the panel, are enough to ensure that understand how it works and the user will be able to see the powerful tool they have in their hands!
Strategy Tester Configuration Tab
Click on the Test button and the configuration tab will open within the MT5 Strategy Tester window, find and define this data >> Date*: "Last month", Optimization: " Disabled" and activate the "visual mode with display of graphs, indicators and trading", then it should look like the image below:
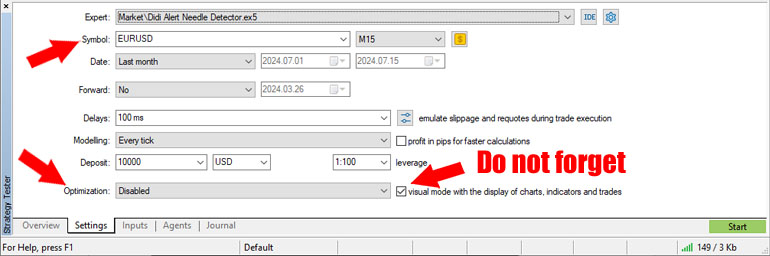
*The user can then change this value to analyze other periods, for example from January to February (of the current year or no), always remembering that the longer the period, the longer it will take on the initial LOADING screen.
Click on the Start button and the Strategy tester application will open, wait while the data of the pre-selected assets (in the case of testing mode) is loaded, depending on your connection speed and your equipment it may take a while, but be patient!
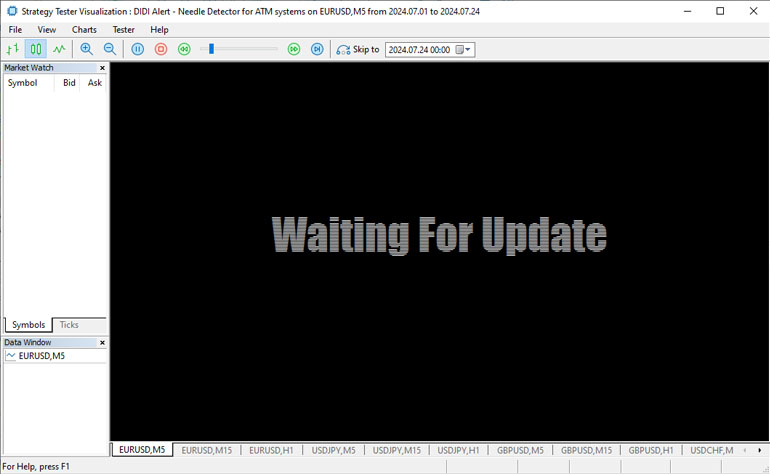
"The analyzes will begin and the results will be presented on the graphic panel in their corresponding positions, this part has already been explained in detail in the section How the "DIDI ALERT - Needle Detector from ATM Systems"
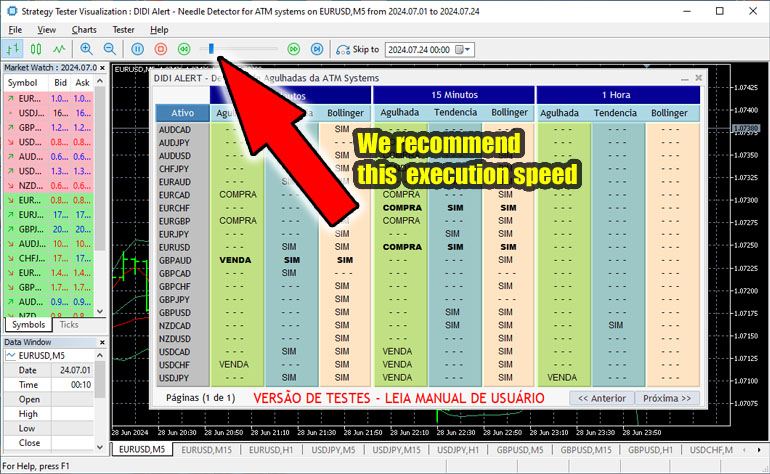
Execution speed control
ATTENTION!!! If the slider bar is not adjusted correctly, testing and analysis will not be possible! Read below and don't skip this step...
There is a slider you can use to adjust the speed of the weather simulation. This directly affects how quickly you receive analytics responses. If the simulation is too fast, you can pause or stop the execution using the appropriate buttons. Then adjust the speed until you find the ideal pace and restart the utility.
Make sure to adjust the window view so that the Chart panel is fully displayed, it is recommended to adjust the execution speed, at the point as shown in the image below, before making the final settings on the strategy tester screen and then it can gradually increase until it reaches a speed of balance between the movement of the graph and the detections.
However, it is important to remember that the ability to control the speed of the simulation is not available in real mode for obvious reasons.
Using the slider mentioned above, adjust the execution time so that it is long enough for you to analyze the charts and see how many trading opportunities will open up before your eyes!
ATTENTION - While the assets and their respective data are being loaded, DO NOT CLICK ON ANYTHING! Or it will cause a serious problem and you will have to start over again.
A needle stick has been detected! And now, what to do?
When pinpointing or complete pinpointing occurs:
- Pause the strategy tester;
- Identify the asset/symbol and the timeframe in which the detection occurred;
- Click on the tab corresponding to the asset/symbol in question;

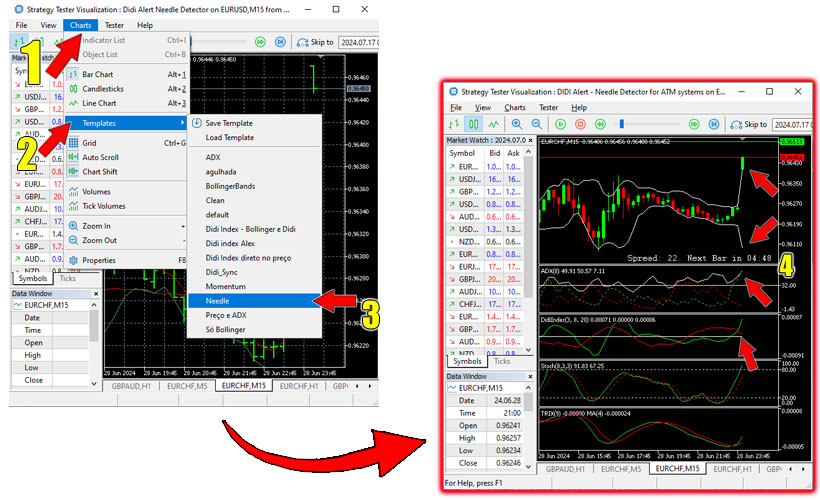
Now let's apply the NEEDLED template.
To apply the NEEDLED template, which is extremely necessary for analysis, follow the following steps:
- Click on Menu bar >> Graphics;
- Then click on Templates;
- Followed by needled;
- After that, the layout is applied IN THIS TAB* and you can start analyzing the conditions to see if it is a good trading entry according to Didi Aguiar's Agulhadas Strategy!
Sometimes, even after selecting the AGULHADA template, the layout does not change, so just press play and pause again and it will change...
At this point, the user will discover the high assertiveness of our solution, which exponentially accelerates discovery and increases the chances of success.
Imagine then, accessing this powerful analysis tool with all the features of the paid version, the proportion of exceptional opportunities that will arise.
Even so, never forget that there IS NO infallible strategy and that the Financial Market DOES NOT OBEY ANYONE!
DIDI ALERT does not guarantee or promise profits, but it is the fastest way to find opportunities and will depend exclusively user knowledge about Didi Aguiar's Agulhadas strategy and its correct technical analysis...
REMINDER: These steps must be repeated every time you open the Strategy Tester. In the paid version, you only need to complete the initial configuration in the "Preparing the Work Environment" section if you haven't already done so.
Using the paid version of "DIDI ALERT - ATM Systems Needle Detector
Go back to the first window we created and called BASIC, the clean one with just the candles, if you forgot or skipped this part, go back to item number 2 in the previous section called Preparing the Work Environment for "DIDI ALERT - Needle Detector from ATM Systems" and carry out what was instructed, then return to the next step described below.
Locate "DIDI ALERT" , it is located in the window structure Browser >> Metatrader 5 >> Expert Consultant >> Market >> Didi Alert Needle detector. If it is not appearing, you can activate it using the shortcut keys Ctrl + N or Menu bar > View > Browser .
Double click on "DIDI ALERT - Needle Detector" , then the initialization window will open with the COMMON tabs where the name, description of the utility and also the " Input Parameters" tab are displayed, we recommend that IN THIS FIRST EXECUTION do not change anything, so that the user gets to know the new tool and only after seeing it in operation and understanding it, come back to make the desired changes. Click OK to start our utility.
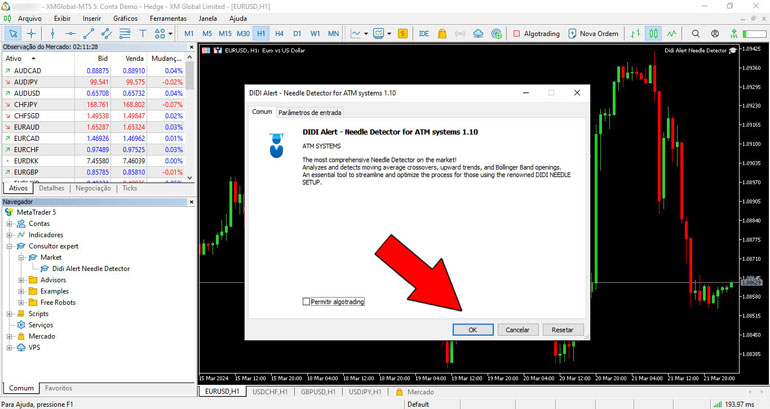
The Graphical Panel will then be displayed and a warning with the progress of the process, as can be seen in the following image:
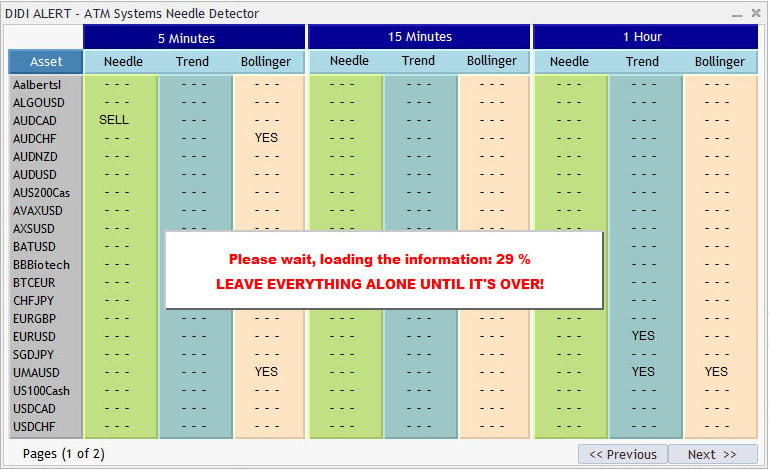
Wait for the data loading process to finish, then the graphical panel will be displayed with the names of the assets or symbols previously chosen from the list in the "Market Observations" Window and the analysis results.
ATTENTION - While the assets and their respective data are being loaded, DO NOT CLICK ON ANYTHING! Or it will cause a serious problem and you will have to start over again.
The explanation of how the analysis results are displayed was explained in the section How "DIDI ALERT - Needle Detector" works.
Example of the intuitive Graphical Panel with its analyzes performed and results displayed:
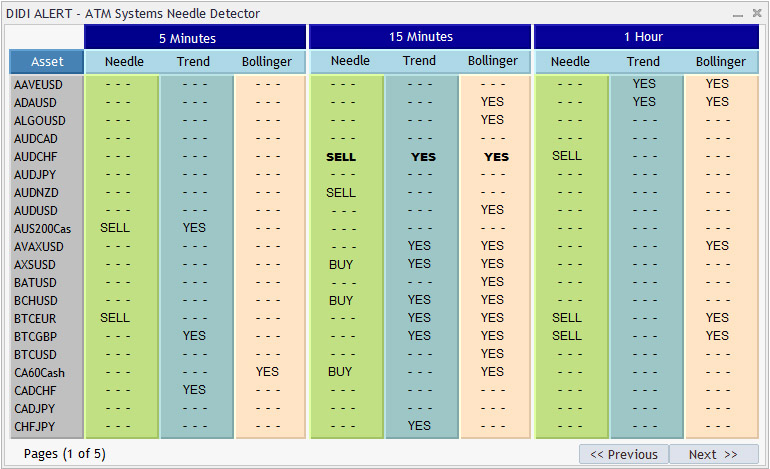
After opening "DIDI Alert", loading data and information, the app will already be monitoring the conditions of symbols or assets,
Attention Detection occurs in real time and a greater price variation is enough for the candle to change its size and in a matter of a short time both the Agulhada and the Bollinger Opening undergo a rapid change and are no longer positively detected, thus deactivating visual warnings on the Chart Panel, so we must be attentive during use so as not to miss trade opportunities, but to help the Trader, in addition to the sound and visual notifications, we have added a function in the settings which, as explained previously, is called " Needle log" that maintains a log of agulhadas and if the user wishes, they can activate it to record and display the latest agulhadas!
A agulhada has been detected! And now, what to do?
When agulhada or complete agulhada occurs:
- Identify the asset or symbol and the timeframe on which it occurred
- If the Chart Window is not open, go to the Market Observations window > right-click mouse > Graph Window
- Go to the tab of the respective Chart Window and check whether the necessary conditions have been met or are forming and whether according to your technical analysis it is time to make a trade entry! Look at the image below:
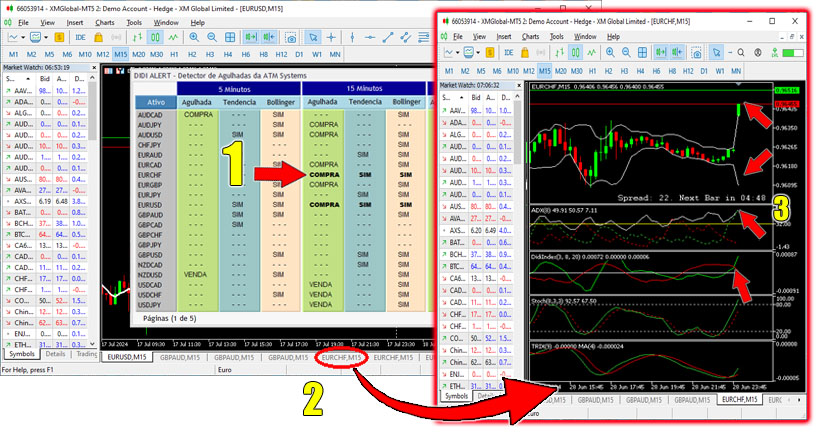
Be surprised by the number of notifications you will receive and prepare for countless trading opportunities!
Optimizing the work environment
The programming class used to create the Graphical Panel is still very limited in the mql5 version and ends up causing a certain type of detail that can hinder the visualization of the panel a little.
The annoying point is when we switch between the chart windows to confirm the conditions of a possible trade and return to the main window, the panel automatically minimizes, having to be maximized again.
We believe that the MQL5.COM development team will soon be correcting this, while this does not happen and to avoid this condition the user can deactivate the window's anchoring function and move it freely, meaning that the panel is no longer minimized.
This function can be accessed via the shortcut key Alt+D or right-click on the graph window and choose Anchored.
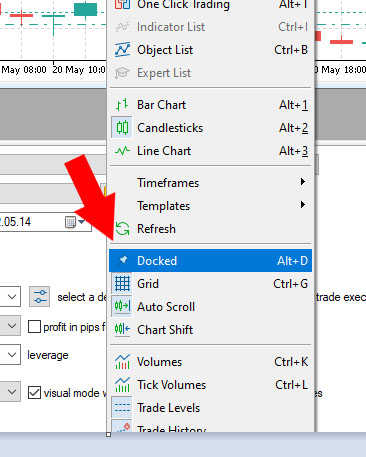
Ready! This way, the user can resize this undocked window so that only the panel is visible and simply move it to make it easier to see the panel and other graph windows.
Then it will look like this:
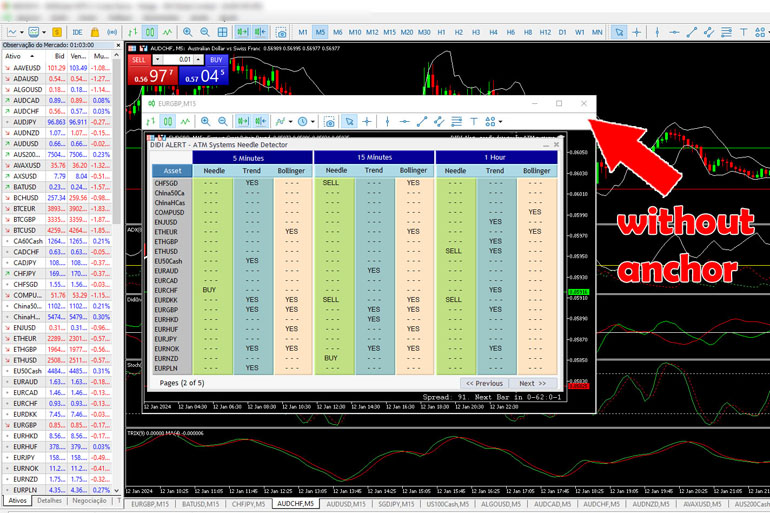
If you have two monitors configured as an extended desktop, you can drag the undocked window to one screen and the MT5 with all the graphics to another screen and it will be perfect! 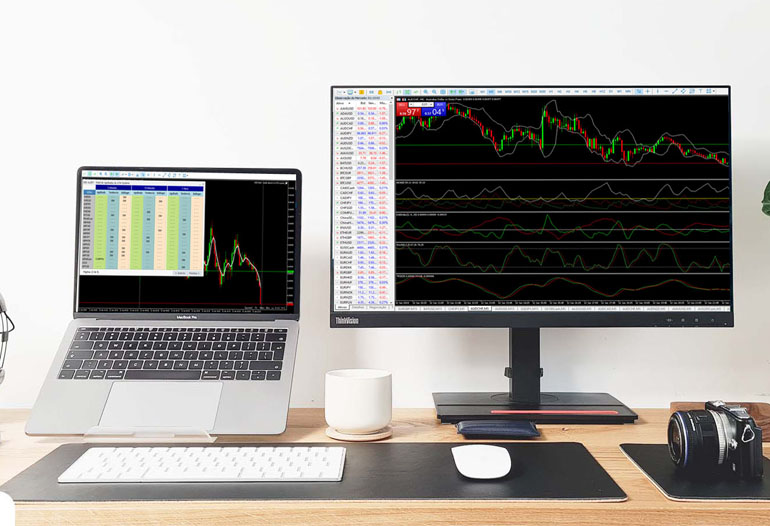
Agulhadas Setup Strategy
We have brought enough information here for the user to work with the proposed utility, but regarding the complete methodology of Setup das Agulhadas we have several videos on YouTube, just search for DIDI INDEX or DIDI AGULHADAS and you will find several options, including videos by Didi Aguiar himself explaining it in detail with the possibility of also adding subtitles in your own language, so we will not address this issue here.
Errors presented and possible solutions
"DIDI ALERT - ATM Systems Needle Detector" is a SOLUTION that is almost 100% free of errors and problems, it has been tested and reviewed very carefully and the errors presented are MOSTLY summed up in USER MISCONDUCT , error when configuring or attempt to change settings during its execution, see the section "INPUT PARAMETERS - What do we have here?" at the beginning of this Manual.
Error when executing "DIDI ALERT" in the test version (Strategy Tester)
When using the demo version of our utility, it should be noted that it cannot be used in brokers that change the name of assets and use non-standard names and this causes a specific error that can be seen below: 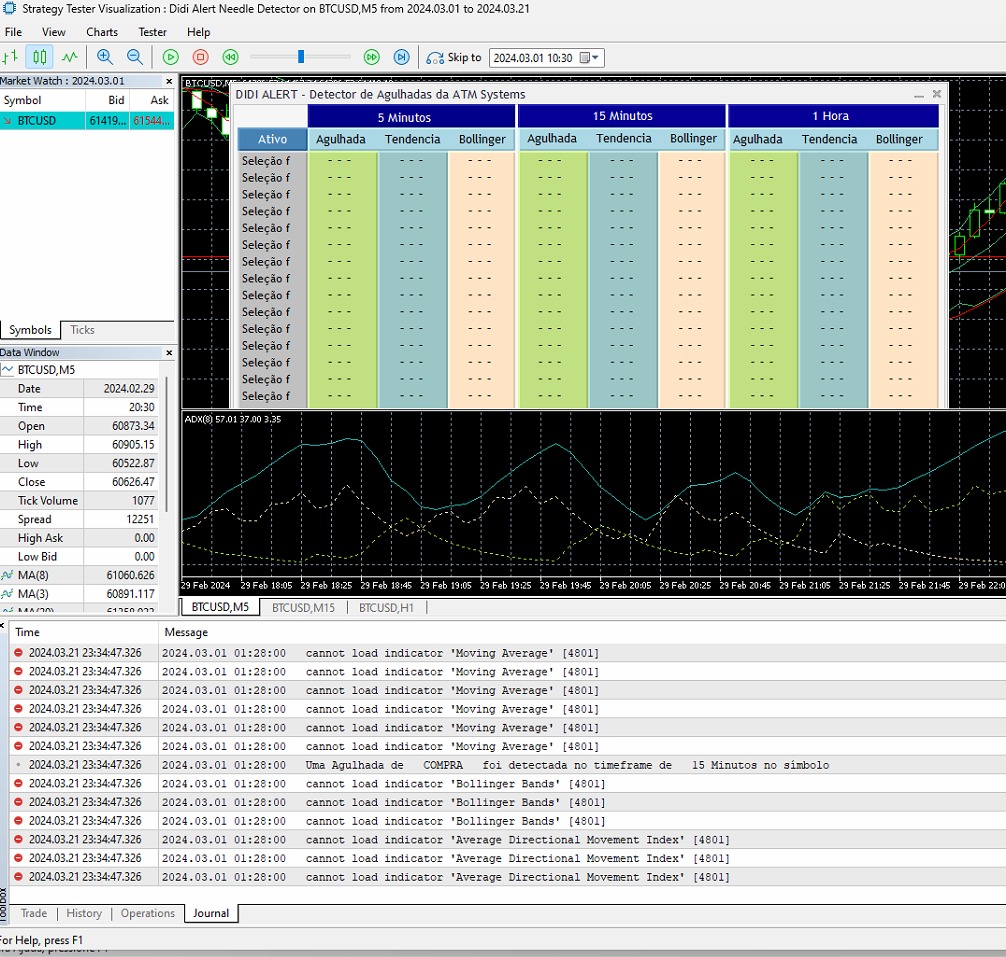
The error presented here is [4801] ERR_INDICATOR_UNKNOWN_SYMBOL which means Unknown asset, why did this occur? Because the broker uses the names of Forex pairs like EURUSD.c, EURCAD.c, that is, anything that uses changes in asset names will not work correctly, but ONLY in the demo version within the STRATEGY TESTER.
If this is your case, use another broker, I will leave a link below to a broker that does not have this type of problem and also has a promotion valid only for NEW USERS who sign up and will earn R$30.00 dollars in account to carry out the trades and any profit above that, you can withdraw! (If you pay attention to the broker's rules).
Click here and create your account >> Create account at Corretora XM with US$30.00 bonus
Errors when first running "DIDI Alert"
Errors rarely occur, if it happens the first time you run DIDI Alert, there is an error loading an indicator or something similar, remove it and run it again.
Errors due to incorrect user configuration
Look at the following image:
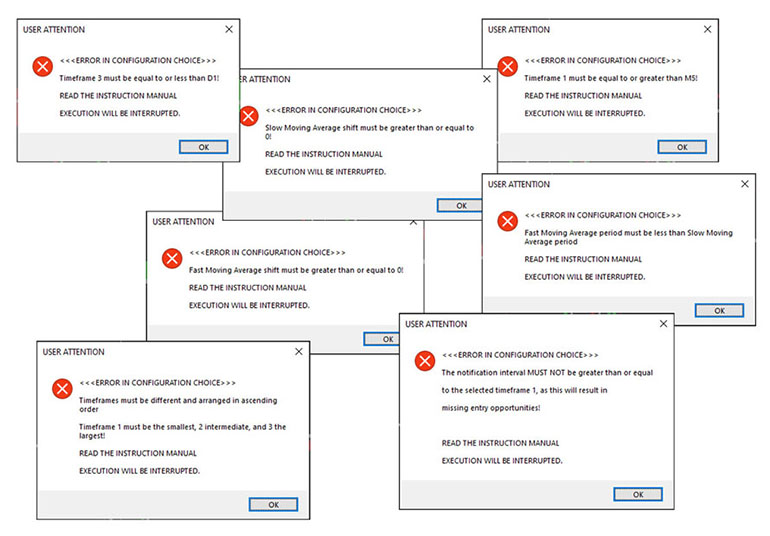
ALL THESE ERRORS ARE DUE TO WRONG CONFIGURATION IN THE "INPUT PARAMETERS" TAB CAUSED BY THE USER!
Errors sending messages via PUSH and Email
If errors occur when sending PUSH and/or Email messages, a number will be displayed in the "Experts" tab, below are the respective error codes:
4515 - ERR_NOTIFICATION_SEND_FAILED, (Send failed - mql5.com server error) 4516 - ERR_NOTIFICATION_WRONG_PARAMETER, (Incorrect parameter - see configuration) 4517 - ERR_NOTIFICATION_WRONG_SETTINGS, (Incorrect settings - see configuration) 4518 - ERR_NOTIFICATION_TOO_FREQUENT. (Excessive sending of messages - choose a longer interval)
Before calling support, correctly check the settings explained on the MetaTrader 5 Platform Configuration page
Error in the "Input Parameters Tab" Crash due to changing values in the tab during DIDI Alert execution
By default of the MetaTrader 5 platform, changes made to the settings of Expert Advisors Utilities and others in the "Input Parameters" tab must be made during the first time it is opened, as after the first initialization of the same, they may have no effect or even cause the window or MT5 tool in question.
Therefore , do not change these values while running "DIDI ALERT - ATM Systems Needle Detector"
If you have already initialized "DIDI ALERT- Needle Detector" and want to change something, follow the steps below:
1. Remove "DIDI ALERT" from the chart:
- Right click on the chart where it is currently active.
- Choose "List of Expert Advisors (Robots)"
- Select "DIDI ALERT"
- Click "Remove"
2. Reopen "DIDI ALERT" on the chart:
- Run the utility again.
3. Adjust the settings again:
When the Utility opens, the Common tab and the "Input Parameters" tab will appear, so now you can configure the "DIDI ALERT" options with the new desired settings.
Crashing or excessive slowness when running DIDI Alert
If the user tried the "Didi Alert" utility with the Market closed or very still, there will be excessive slowness or even a crash as it needs tick movements to fuel its operation, come back again when the market is open or with adequate movement.
Important notes:
- This is a trading opportunity tracker, the buyer must be aware that the user manual contains the entire explanation of how to use the DIDI Alert program, with all the information and everything necessary to be used correctly, but remember that we do not cover or teach the needle strategy, as there are thousands of utilities on the MARKET that also follow this same principle, they teach how to use the tool, but the strategy is something else, there are several videos on YouTube explaining how this strategy works.
- Always use Stop Loss (SL) for your own safety and preservation of your assets, always manage your account risk.
- The DIDI ALERT Needle Tracker Detector does not make purchases or sales and also does not have an automatic Stop Loss (SL) or Take Profit (TP), as operations must be carried out manually.
- The Agulhadas Strategy only works with an Uptrend (LTA) or Downtrend (LTB) . If it is executed when the market is closed or almost stopped, it will not work correctly and may be very slow or even crash...
Important:
Didi Alert, created by ATM Systems, is based on the "Didi Index" indicator from trader Didi Aguiar's "Estratégia das Agulhadas". It is important to highlight that there is no connection between Didi Alert from ATM Systems and Mr. Didi Aguiar or his team.
Links
Link to our solution for you on the Market https://www.mql5.com/en/market/product/110070

Link to explanatory video of our solution on Youtube https://www.youtube.com/watch?v=L3fkWWIR-uA


