
Mastering XAUUSD Daily: What Smart Traders Are Watching Today, March 16,2026

“In fast markets, discipline slows you down enough to think clearly.”
We'll examine what the chart actually conveys today, including where buyers and sellers are active, which levels are crucial, and how momentum is shifting in real time.
Before we begin, I would like to share with you the best ways to use MQL4 and MQL5 to transform your trading strategies into extremely profitable machines. In order to teach traders how to construct MT4 and MT5 trading algorithms from the bottom up, I have created basic instructions.
📘LEARN HOW TO DEVELOP THE PERFECT TRADING ALGORITHM FOR MT4
📘LEARN HOW TO DEVELOP THE PERFECT TRADING ALGORITHM FOR MT5
A powerful system/ trader assistant tool designed to enhance analysis, improve timing, and give traders a structured approach to market execution.
Market Overview
Gold (XAUUSD) is navigating a critical consolidation phase on March 16, 2026, currently trading at approximately $5,018.86 per ounce after retreating from the crisis-driven highs above $5,390 seen in early March. The precious metal is showing signs of stabilization following the dramatic geopolitical premium that dominated markets earlier in the month, with prices now settling into a more technical trading pattern.
Today's session opened at $5,080.70 and has seen prices range between $5,009.51 and $5,129.13, reflecting moderate intraday volatility as markets digest recent events and await this week's critical Federal Reserve interest rate decision. According to current forecasts, gold is expected to remain in consolidation within the $5,052.87–$5,208.41 range on March 16, with price potentially moving in either direction.
Current Market Context
The past two weeks have seen a significant retracement from the March 3rd crisis high of $5,390+, where geopolitical tensions (the death of Iran's Supreme Leader) created an extreme safe-haven bid. Since then, tentative diplomatic progress has allowed some of that crisis premium to dissipate, bringing gold back toward more sustainable technical levels.
Key Price Levels (March 16, 2026):
- Current Price: $5,018.86
- Opening Price: $5,080.70
- Today's Range: $5,009.51 - $5,129.13
- Previous Close: $5,079.20
- All-Time High: $5,595.46 (January 29, 2026)
- Year-to-Date Change: +20.41%
- 52-Week Range: $2,956.60 - $5,595.46
Recent price action has confirmed a break below the support zone around $5,070–$5,080, with the next logical target being the psychological $5,000 level. Support levels often accumulate large numbers of stop-loss orders from traders holding long positions, and when these levels break, the market tends to accelerate as liquidity becomes available.
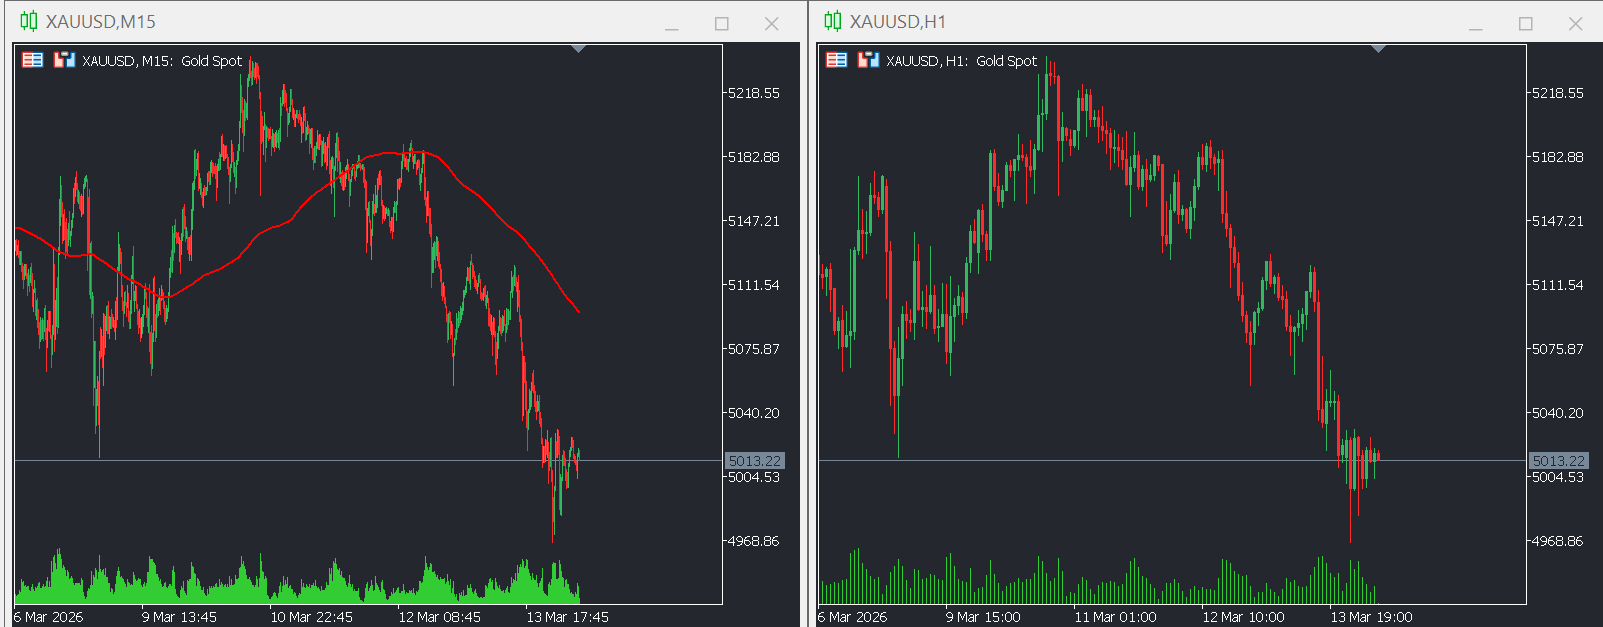
H1 Timeframe Analysis: The Intermediate Picture
Market Structure & Post-Crisis Consolidation
On the hourly (H1) chart, XAUUSD is displaying classic post-crisis consolidation characteristics. After the extreme volatility of early March, the market has settled into a more methodical pattern, with clear support and resistance levels emerging.
H1 Bias: Neutral to Slightly Bearish (Short-term)
The market structure shows:
- Consolidation range: $5,052.87 - $5,208.41 (expected trading zone)
- Recent breakdown: Below $5,070-$5,080 support zone
- Lower highs formation: Each rally attempt failing at lower levels
- Weakening momentum: Unable to sustain moves above $5,100
According to technical analysis, a Bullish Engulfing candlestick pattern has formed near the support at $5,107.72, indicating renewed buying interest from the $5,052.87 level and signaling a potential upward move. However, this must be confirmed with volume and follow-through.
Critical Chart Patterns
Consolidation Rectangle: The market is forming a consolidation rectangle between approximately $5,050 and $5,210, representing a pause after the dramatic moves earlier in the month. This pattern typically resolves with a breakout in either direction:
- Bullish break (above $5,210): Would target $5,350+
- Bearish break (below $5,050): Would target $4,900-$5,000
Support Break and Liquidity Hunt: The recent break below $5,070-$5,080 represents a liquidity hunt where stop-losses were triggered. This is a common market behavior where:
- Price breaks obvious support
- Stops are triggered, creating momentum
- Market either continues lower OR reverses after liquidity is taken
The key question: Is this a genuine breakdown or a false break (stop hunt) before reversal?
Technical Indicators on H1
RSI (Relative Strength Index): RSI is holding near 43 in neutral territory, suggesting the price may rise or fall. This reading indicates:
- No extreme overbought or oversold conditions
- Market is balanced between buyers and sellers
- Need for catalyst to determine direction
- RSI below 50 suggests slight bearish bias
MACD (Moving Average Convergence Divergence): MACD is rising in the negative zone, with values approaching the zero line. This means the asset is trading in consolidation and:
- Bearish momentum is weakening
- Potential for bullish crossover if buying pressure increases
- Consolidation rather than trending market
- Watch for histogram bars to expand for directional clues
MFI (Money Flow Index): MFI is turning up from the lower boundary, signaling increasing liquidity inflows. This volume-weighted indicator suggests:
- Smart money may be accumulating at these levels
- Buying pressure beginning to return
- Potential support for bounce scenario
- Divergence from price would be bullish signal
VWAP & Moving Averages: VWAP and SMA20 are above the market price, which suggests continued selling pressure. However, this also means:
- Price below short-term average = potential buying opportunity
- Resistance overhead must be overcome
- Reversion to mean (VWAP) could drive bounce
- Longer-term averages still supportive below
Key Support and Resistance Levels (H1)
Immediate Resistance:
- $5,080 - $5,100: First resistance (broken support becomes resistance)
- $5,107.72: Key resistance where Bullish Engulfing formed
- $5,130 - $5,150: Secondary resistance
- $5,208.41: Upper consolidation boundary
- $5,266.41: Major resistance if breakout occurs
Critical Support Zones:
- $5,052.87: Immediate support (lower consolidation boundary)
- $5,000: Psychological support (critical)
- $4,996.26: Major support level
- $4,937.88: Deeper support
- $4,881.57: Significant support
- $4,821.84: Major support zone
H1 Price Action Dynamics
The current price action suggests a market at a crossroads:
Scenario A - Bullish Reversal (40% probability):
- Bullish Engulfing at $5,107.72 holds
- MFI confirming accumulation
- Price reclaims $5,080-$5,100
- Targets: $5,208, $5,266, $5,350+
Scenario B - Continued Consolidation (40% probability):
- Range-bound between $5,050-$5,150
- Choppy, directionless trading
- Awaiting Fed decision for catalyst
- Low volatility, mean reversion trades
Scenario C - Breakdown Continuation (20% probability):
- Failure to hold $5,050
- Acceleration to $5,000
- Potential test of $4,996 and lower
- Requires strong fundamental catalyst
M15 Timeframe Analysis: Precision Trading Perspective
Intraday Price Dynamics
On the 15-minute (M15) chart, the price action reveals the tactical battle at current levels. The M15 timeframe shows the recent support break and subsequent price behavior that will determine the next move.
M15 Bias: Bearish Structure with Potential Reversal
The M15 chart characteristics include:
- Recent break: Below 5070-5080 zone confirmed
- Lower lows: Making lower swing lows on pullbacks
- Liquidity sweep: Stops taken below support
- Reversal attempt: Bullish candles trying to reclaim 5070
M15 Technical Setup
Smart Money Concepts (SMC) Analysis:
The recent price action has created distinct institutional zones:
Supply Zones (Order Blocks):
- $5,100 - $5,120: Fresh supply (previous support)
- $5,150 - $5,180: Secondary supply
- $5,200 - $5,230: Major supply zone
- $5,266 - $5,290: Significant resistance
Demand Zones:
- $5,050 - $5,070: Current battleground
- $5,020 - $5,040: Immediate demand
- $5,000 - $5,015: Psychological demand (strong)
- $4,980 - $5,000: Major demand zone
- $4,950 - $4,970: Deeper demand
Fair Value Gaps (FVG): Recent volatility has created several FVGs:
- Gap around $5,060-$5,075 (currently being filled)
- Gap around $5,030-$5,045 (potential support)
- Gap around $5,100-$5,120 (resistance if rally)
M15 Momentum Indicators
RSI on M15: The M15 RSI is likely oscillating between 35-50, showing:
- Bearish bias but not oversold
- Room for further downside
- Or potential for bounce if finds footing
- Watch for bullish divergence
Stochastic Oscillator: Stochastic readings indicate:
- Recently reached oversold territory
- Beginning to turn higher
- Potential for short-term bounce
- Confirming with price action is key
Moving Average Alignment: Short-term moving averages showing:
- Price below 5 EMA and 10 EMA (bearish)
- EMAs pointing downward (bearish trend)
- 20 EMA providing resistance overhead
- Need crossover for bullish confirmation
M15 Key Levels for Intraday Trading
Micro Resistance:
- $5,030 - $5,040: Immediate resistance
- $5,050 - $5,060: Near-term resistance
- $5,070 - $5,080: Key resistance (broken support)
- $5,100 - $5,110: Major resistance
Micro Support:
- $5,010 - $5,020: Immediate support
- $5,000 - $5,010: Psychological support (critical)
- $4,990 - $5,000: Major support zone
- $4,975 - $4,985: Deeper support
M15 Trading Opportunities
Scenario 1: Bounce Play from Support (Probability: 45%)
- Setup: Hold above $5,000, bullish reversal pattern forms
- Entry: $5,005-$5,020 (on confirmation)
- Targets:
- Target 1: $5,050 (risk-reward 2:1)
- Target 2: $5,080 (risk-reward 3:1)
- Target 3: $5,110 (risk-reward 4:1)
- Stop Loss: $4,985 (below psychological support)
- Rationale: Buying oversold conditions at major level
Scenario 2: Breakdown Continuation (Probability: 35%)
- Setup: Failure to hold $5,000, acceleration lower
- Entry: $4,995-$5,005 (on break with volume)
- Targets:
- Target 1: $4,970 (risk-reward 2:1)
- Target 2: $4,940 (risk-reward 3:1)
- Target 3: $4,900 (risk-reward 5:1)
- Stop Loss: $5,025 (above breakdown zone)
- Rationale: Following momentum on psychological level break
Scenario 3: Range Trading (Probability: 35%)
- Setup: Price consolidates $5,010-$5,070
- Buy: $5,012-$5,020 (at support)
- Sell: $5,060-$5,070 (at resistance)
- Targets: 30-50 pip moves
- Stops: 25-30 pips outside range
- Rationale: Trading the established range
Scenario 4: False Break Reversal (Probability: 25%)
- Setup: Break below $5,000 quickly reverses (stop hunt)
- Entry: $5,005-$5,015 (after false break recovery)
- Targets:
- Target 1: $5,060 (risk-reward 2.5:1)
- Target 2: $5,100 (risk-reward 4:1)
- Stop Loss: $4,980 (below false break low)
- Rationale: Stop hunt reversal - high risk/reward
Multi-Timeframe Synthesis: H1 + M15 Integration
Strategic Framework for Current Market
Optimal trading combines H1 directional bias with M15 execution precision:
Current Market Alignment:
- H1 Direction: Consolidation with slight bearish bias
- M15 Execution: Testing critical support at $5,000
- Alignment: Both timeframes at critical decision point
Integrated Trading Approach:
For Long Positions (Conditional):
- H1 requires: Hold above $5,050, reclaim $5,080
- M15 requires: Bullish reversal at $5,000-$5,020
- Entry: Preferably after false break or clear reversal
- Stops: Below $4,985 or $4,950 depending on entry
- Targets: $5,080, $5,150, $5,208
- Position size: Standard (1-1.5% risk) - volatility normalized
For Short Positions (Higher Probability Currently):
- H1 confirms: Failure at $5,070-$5,080 resistance
- M15 confirms: Break below $5,000 with momentum
- Entry: $4,995-$5,005 on confirmed break
- Stops: Above $5,025-$5,030
- Targets: $4,970, $4,940, $4,900
- Position size: Standard (1-1.5% risk)
For Range Traders:
- Current range: $5,010-$5,070 (tight)
- Strategy: Buy support, sell resistance
- Risk: Breakout could happen with Fed decision
- Sizing: Small positions, quick profits
Risk Management Protocol
Position Sizing:
- Normal volatility has returned: 1-1.5% risk per trade
- Tighter stops possible: 40-60 pips typical
- Scale into positions at key levels
- Maximum exposure: 3% across all gold positions
Stop Loss Placement:
- Day trades: Below M15 swing lows + 20-30 pip buffer
- Swing trades: Below H1 support + 40-50 pip buffer
- Always use stops - Fed event risk this week
Take Profit Strategy:
- Scale out: 40% at first target, 35% at second, 25% runner
- Trail stops: Using M15 or H1 swing points
- Book profits before Fed: Consider flat before major news
Fundamental Catalysts for the Week
Federal Reserve Decision (Critical Event)
The most important event this week is the Federal Reserve interest rate decision. Markets are currently pricing in:
- Unchanged rates at 3.50-3.75%: High probability
- Policy statement and forward guidance: Key focus
- Powell press conference: Market-moving potential
Recent soft US economic data has reinforced expectations for a more accommodative Fed stance:
- December retail sales stalling unexpectedly
- GDP control group slipping 0.1%
- Job openings falling to lowest since 2020
- Private payroll growth undershooting forecasts
These releases have lowered rate expectations and strengthened the case for policy easing later in 2026, providing a firmer fundamental backdrop for non-yielding bullion.
Economic Data This Week
Moderate volatility is expected amid several key releases:
- February Producer Price Index (PPI): Inflation data
- US Initial Jobless Claims: Labor market strength
- Other macroeconomic indicators: Economic health
These data points will influence the Fed's decision-making and market expectations for future policy.
Geopolitical Situation
The geopolitical landscape has stabilized somewhat from early March:
- US-Iran tensions: Persist despite tentative diplomatic progress
- Maritime security: Warnings to US-flagged vessels near Iranian waters
- Middle East risk premium: Diminished but not eliminated
Investors are actively cutting exposure to assets directly linked to the Middle East, triggering sharp declines in Gulf equity markets and driving up marine insurance premiums. However, the extreme crisis premium seen at $5,390+ has dissipated.
Central Bank Demand
Official-sector demand remains a key structural support:
- PBOC (China): Extending gold purchases for 15th consecutive month in January
- De-dollarization trend: Continues among emerging market central banks
- Strategic reserves: Providing price floor
This institutional demand creates strong structural support and limits downside potential.
Technical Indicators Summary
Overall Signal: NEUTRAL/HOLD (Consolidation Phase)
| Indicator | H1 Timeframe | M15 Timeframe | Signal | Weight |
|---|---|---|---|---|
| Trend | Consolidation | Bearish short-term | Neutral | High |
| RSI | 43 (Neutral) | 40-45 (Slightly bearish) | Hold | High |
| MACD | Rising in negative | Turning | Neutral | Medium |
| MFI | Turning up | Improving | Slight Buy | Medium |
| VWAP/SMA20 | Above price | Above price | Sell | Medium |
| Longer MAs | Below price | Below price | Buy | High |
| Patterns | Bullish Engulfing | Support break | Mixed | High |
| Volume | Moderate | Normal | Neutral | Medium |
| Support/Resistance | At critical $5,000 | Testing support | Critical | Very High |
| OVERALL | NEUTRAL | SLIGHT SELL | HOLD/WAIT | HIGH |
Trading Strategies for March 16, 2026
Strategy 1: Breakout Trading (Directional)
Profile: For traders comfortable with event risk (Fed decision this week)
Bullish Breakout Setup:
- Trigger: H1 close above $5,080 with volume
- Entry: $5,082-$5,095 (on breakout or retest)
- Targets:
- Target 1: $5,150 (Take 40% profit)
- Target 2: $5,208 (Take 35% profit)
- Target 3: $5,266+ (Trail 25%)
- Stop Loss: $5,045 (below retest zone)
- Risk-Reward: Minimum 2.5:1
Bearish Breakdown Setup:
- Trigger: H1 close below $5,000 with volume
- Entry: $4,995-$5,005 (on breakdown or retest)
- Targets:
- Target 1: $4,970 (Take 40% profit)
- Target 2: $4,937 (Take 35% profit)
- Target 3: $4,900 (Trail 25%)
- Stop Loss: $5,030 (above retest)
- Risk-Reward: Minimum 2.5:1
Strategy 2: Mean Reversion from Extremes
Profile: For traders betting on consolidation continuation
Setup:
- Philosophy: Price has moved too far from VWAP/SMA20
- Long Entry: If price dips to $4,995-$5,010 (oversold bounce)
- Short Entry: If price rallies to $5,100-$5,120 (resistance rejection)
- Targets: Reversion to $5,050-$5,070 zone
- Stops: 40-50 pips beyond entry
- Position Size: 1.5% risk
- Best if: Range continues ahead of Fed
Strategy 3: Conservative Pre-Fed Positioning
Profile: For risk-averse traders concerned about event volatility
Setup:
- Action: Reduce positions significantly before Fed
- Long bias: Small position at $5,010-$5,020 support
- Size: 0.5-0.75% risk (half normal)
- Targets: $5,060-$5,080 (quick profit before Fed)
- Stop: $4,985 (tight)
- Management: Exit everything 24 hours before Fed decision
- Rationale: Preserve capital, avoid event risk
Strategy 4: Post-Fed Reaction Trading
Profile: For experienced traders comfortable with volatility
Setup:
- Action: Wait for Fed decision and initial reaction
- Approach: Let market show its hand, then follow
- If Dovish (gold positive):
- Enter long on first pullback
- Targets: $5,200-$5,350+
- If Hawkish (gold negative):
- Enter short on rallies into resistance
- Targets: $4,900-$4,800
- Stops: Wider than normal (60-80 pips)
- Rationale: Clear direction after event
Market Outlook: Short, Medium, and Long Term
Immediate Term (This Week): Fed Decision Dominates
Base Case (50% probability): Range-bound consolidation between $4,990-$5,110 until Fed decision. Post-Fed, expect 100-150 pip move in either direction. Neutral Fed statement = consolidation continues. Dovish hints = rally to $5,200+. Hawkish tone = decline to $4,900.
Bull Case (30% probability): Dovish Fed surprise (signaling cuts soon). Gold surges above $5,200, targets $5,350-$5,500. Requires: Rate cut hints, economic concerns acknowledged, dovish forward guidance.
Bear Case (20% probability): Hawkish Fed (higher for longer emphasized). Gold breaks $5,000, falls to $4,900-$4,850. Requires: No cut signals, inflation concerns emphasized, strong data cited.
Trading Implication: Stay nimble. Reduce exposure before Fed. Be ready to act on decision but let initial volatility settle.
Short-Medium Term (March-April): Post-Fed Trend Emerges
According to forecasts, XAUUSD Weekly Forecast March 16 – 20, 2026 suggests an attempt to develop a bearish correction and test the support level near $4,795. Then, gold prices would continue to rise with a target above $5,785.
Most Likely Path:
- Late March: Digest Fed decision, establish new range
- Early April: Test of $5,200-$5,300 or $4,800-$4,900 depending on Fed
- Mid-April: Trend confirmation phase
Key Levels:
- Resistance: $5,150, $5,208, $5,266, $5,350, $5,445
- Support: $5,000, $4,937, $4,881, $4,795, $4,700
Critical Factors:
- Fed policy path clarity
- US economic data trajectory
- Geopolitical developments
- Dollar strength/weakness
Long-Term (Full Year 2026): Bullish Structure Intact
Despite short-term uncertainty, the long-term outlook remains constructive. If the current structure persists, gold may continue to move within the bullish channel and gradually shift towards its upper boundary. In this case, the asset may surge to the $6,500.00–$7,000.00 range by the end of the year.
Year-End 2026 Forecasts: According to analysts, gold will trade in the range of $4,819.00–$10,023.00 for 2026. More realistic scenarios suggest:
- Conservative: $5,500-$6,200
- Base Case: $6,000-$6,800
- Bullish: $6,500-$7,000
- Very Bullish: $7,500-$10,000+
Trading Strategy for 2026: The recommended strategy suggests opening trades within the ascending channel on pullbacks to dynamic support levels, especially in the $4,900.00–$5,000.00 zone, where the channel line passes and the SMA50 is located. When the price settles in this area, open long positions with expectation that the trend will continue. Closest targets are at previous highs and upper boundary of the trading channel. As bullish momentum develops, part of the position can be closed in the $6,000.00–$6,500.00 area, leaving part for possible further upward movement.
Structural Drivers:
- Central Bank Demand: 15th consecutive month of PBOC buying
- Fed Policy Easing: Expected later in 2026
- Geopolitical Uncertainty: Middle East, US-China tensions
- De-dollarization: Continued diversification away from dollar
- Inflation Hedge: Persistent above-target inflation
Potential Risks:
- Stronger Dollar: If US economy outperforms
- Higher for Longer: If inflation proves sticky
- Geopolitical De-escalation: Removes safe-haven premium
- Technical Breakdown: Below $4,700 would be significant
Advanced Technical Analysis
Elliott Wave Count
From the $2,956 low to $5,595 high appears to be a completed five-wave impulse. The current correction from $5,595 could be labeled:
- Wave A: $5,595 → $4,842 (completed)
- Wave B: $4,842 → $5,390 (crisis spike, potentially complete)
- Wave C: $5,390 → ? (in progress, targeting $4,700-$5,000?)
Alternative: If $4,842 was the complete correction, we're now in a new bullish wave targeting $6,000+. Break above $5,400 would confirm this.
Fibonacci Analysis
From $5,595 (ATH) to $4,842 (Low):
- 23.6% Retrace: $5,020 ← Current price very close
- 38.2% Retrace: $5,130 (resistance)
- 50.0% Retrace: $5,218
- 61.8% Retrace: $5,307
Current Position: Price at 23.6% Fibonacci level is significant. This level often acts as first resistance in corrections. Holding here suggests correction may be complete. Breaking below targets 0% retest at $4,842.
Extension Targets (If Rally Resumes):
- 127.2%: $6,553
- 161.8%: $7,034
- 200%: $7,395
Volume Profile & Market Structure
Point of Control (POC): Highest volume trading likely occurred around $5,050-$5,150 recently. This area represents "fair value" and will act as magnet for price.
Value Area:
- Upper: $5,150-$5,200
- Middle: $5,050-$5,100
- Lower: $4,950-$5,000
Current price at lower value area suggests either buying opportunity or breakdown risk.
Volume Characteristics:
- Moderate volume on current levels (not panic, not excitement)
- Higher volume needed to confirm direction
- Fed decision will likely spike volume significantly
Risk Factors & Considerations
Known Risks This Week
- Fed Decision: Biggest risk - can move market 100+ pips instantly
- Economic Data: PPI, jobs data could surprise
- Technical Break: $5,000 or $5,080 breaks change structure
- Geopolitical: Iran situation could re-escalate
- Dollar Surge: USD strength pressures gold
Trading Risks
- Event Volatility: Fed decision creates gap risk
- Whipsaw: False breaks common in consolidation
- Spread Widening: During news, costs increase
- Liquidity: Can thin during key moments
- Overnight Risk: Gaps on news
Mitigation Strategies
For Long Positions:
- Reduce size before Fed
- Use options for protection if available
- Trail stops once in profit
- Book partial profits at resistance
For Short Positions:
- Very tight stops (fighting longer-term trend)
- Only trade with clear confirmation
- Scale out aggressively at targets
- Be ready to flip if wrong
For All Traders:
- Don't overleverage
- Respect the $5,000 psychological level
- Wait for confirmation before big positions
- Consider staying flat through Fed
Final Thoughts & Key Takeaways
Gold finds itself at a critical juncture on March 16, 2026. After the extreme volatility of early March (crisis spike to $5,390+), the market has retraced and is now consolidating near technical support at $5,000-$5,020.
Critical Conclusions:
-
At Critical Support: The $5,000 psychological level is being tested. Hold = potential bounce. Break = acceleration to $4,900 or lower.
-
Fed Decision Dominates: Everything else is secondary to this week's FOMC decision. Markets are at standstill awaiting guidance.
-
Technical Signals Mixed: Bullish Engulfing at support vs. broken support at $5,070. MFI turning up vs. VWAP overhead. Requires patience for clarity.
-
Range-Bound Likely: Until Fed decision, expect $5,000-$5,100 consolidation with potential for false breaks either way.
-
Long-Term Bullish Structure Intact: Despite short-term uncertainty, structural bull market remains in place with targets at $6,500-$7,000 by year-end.
-
Geopolitical Premium Faded: Crisis spike has unwound, bringing price back to technical levels. Baseline geopolitical risk remains but extreme premium gone.
-
Volume Confirming: MFI uptick suggests smart money accumulating at these levels, but needs price confirmation.
-
23.6% Fibonacci Critical: Current price at first Fibonacci retracement level. Common reversal point or breakdown acceleration point.
Trading Wisdom for Current Conditions
Do:
- Wait for Fed decision before major positions
- Use tight stops in current consolidation
- Buy at support ($5,000-$5,020), sell at resistance ($5,080-$5,100)
- Scale into positions rather than all-in
- Book profits at key levels
- Respect the psychological $5,000 level
Don't:
- Overleverage ahead of Fed
- Fight clear breakouts when they occur
- Ignore the importance of $5,000 level
- Chase price without confirmation
- Hold full positions through Fed announcement
- Trade emotionally on Fed day
Price Predictions
Next 24-48 Hours:
- Bullish Above: $5,040
- Bearish Below: $5,000
- Expected Range: $5,000-$5,080
- Most Likely: Consolidation near $5,020
This Week (Post-Fed):
- Dovish Fed: $5,200-$5,350
- Neutral Fed: $5,050-$5,150
- Hawkish Fed: $4,850-$4,990
End of March:
- Bull Case: $5,350-$5,500
- Base Case: $5,100-$5,300
- Bear Case: $4,800-$5,050
Closing Thought
"The market is at a pivot. The Fed will tip it. Be ready to move, but don't jump before the signal."
Gold is coiled at a critical level. The $5,000 support represents not just a psychological barrier, but a technical convergence point where multiple factors align. The Bullish Engulfing pattern suggests buyers are defending this level, but the broken support at $5,070-$5,080 shows sellers are also present.
The Federal Reserve will provide the catalyst that determines direction. Until then, respect the range, manage risk carefully, and stay patient. The setup is there - we just need the trigger.
Those who position correctly for the Fed decision and manage risk appropriately will find opportunities. Those who overcommit or ignore the risks will struggle. Stay disciplined, wait for your pitch, and remember - preservation of capital is paramount.
Disclaimer: This analysis is for educational and informational purposes only and does not constitute financial advice. Trading gold and other financial instruments involves substantial risk of loss. Past performance is not indicative of future results. The Federal Reserve decision this week presents significant event risk that can cause dramatic price movements. Always conduct your own research, understand the risks involved, and consider consulting with a licensed financial advisor before making investment decisions. Never risk more than you can afford to lose.
Published: March 16, 2026
Timeframes Analyzed: H1 (1-Hour), M15 (15-Minute)
Asset: XAUUSD (Gold Spot vs US Dollar)
Current Price: $5,018.86
Market Condition: Consolidation Ahead of Fed Decision
Analysis Type: Technical Analysis with Fundamental Context
⚠️ FED DECISION WEEK NOTICE ⚠️
This week contains a major market-moving event: the Federal Reserve interest rate decision. Expect increased volatility before and especially after the announcement. Consider reducing position sizes, using wider stops, or staying flat through the announcement to avoid adverse price gaps and whipsaw movements. Trading during Fed decision days requires experience with high-volatility conditions.


")
