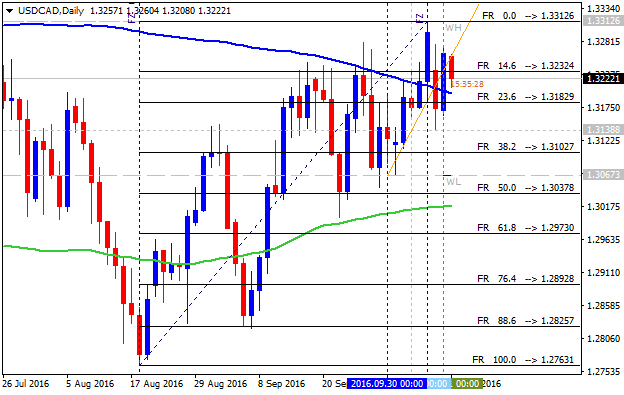
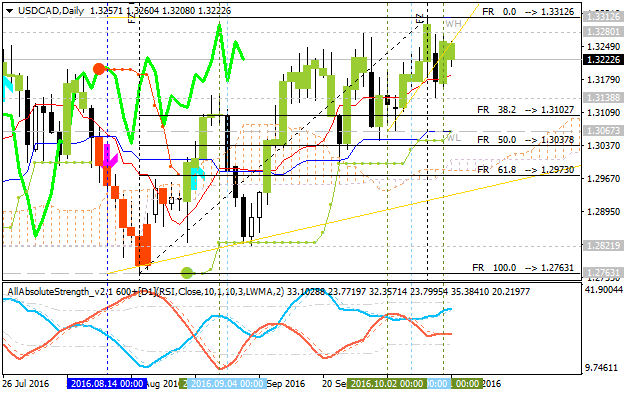
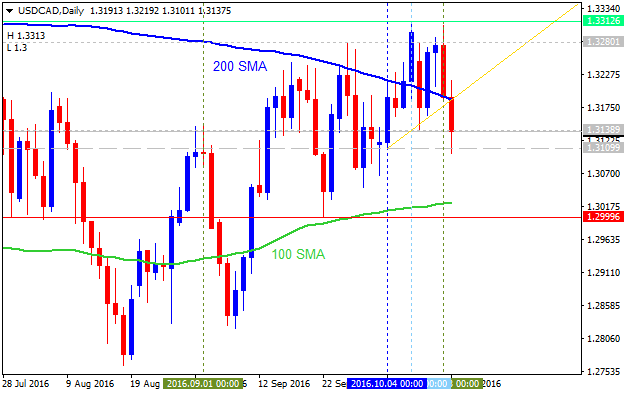
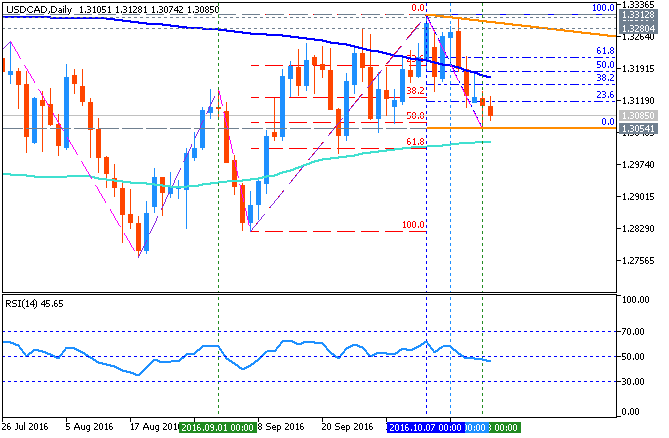
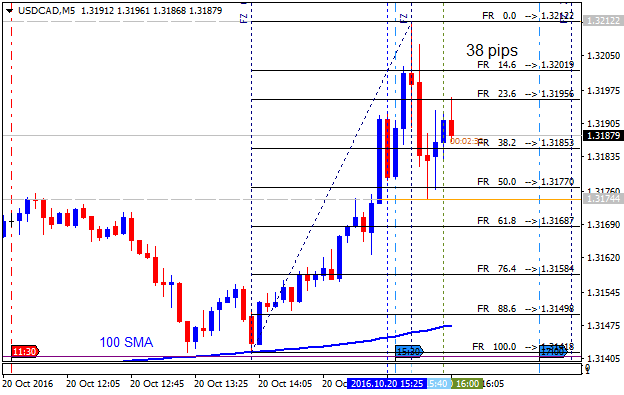
USDCAD Technical Analysis 2016, 09.10 - 30.10: weekly breakout with the bullish reversal

Weekly price
is breaking 1.3280 resistance level to above for the reversal of the
price movement from the bearish to the ranging bullish market condition
to be located inside Ichimoku cloud. Ascending triangle pattern was
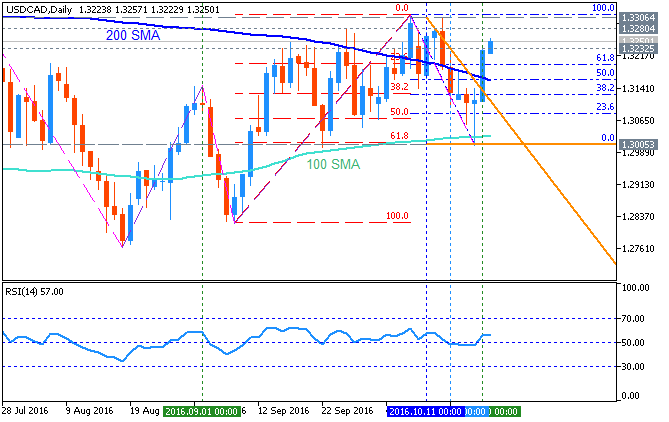
formed by the price to be crossed to above, Absolute
Strength indicator and Trend Strength indicator are estimating the
bullish condition in the near future, and Chinkou Span line of Ichimoku
is indicating the good breakout of the price movement with the possible
bullish reversal.
If W1 price breaks 1.2763
support level on close bar so the primary bearish trend will be resumed.
If W1 price breaks 1.3280
resistance level on close bar from below to above so the reversal of
the price movement to the primary bullish market condition will be
started.
If not so the price will be on ranging within the levels.
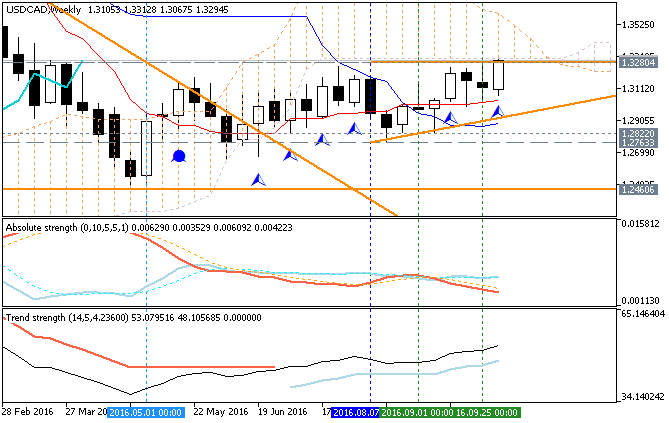
| Resistance | Support |
|---|---|
| 1.3280 | 1.2763 |
| N/A | 1.2460 |
SUMMARY : rally