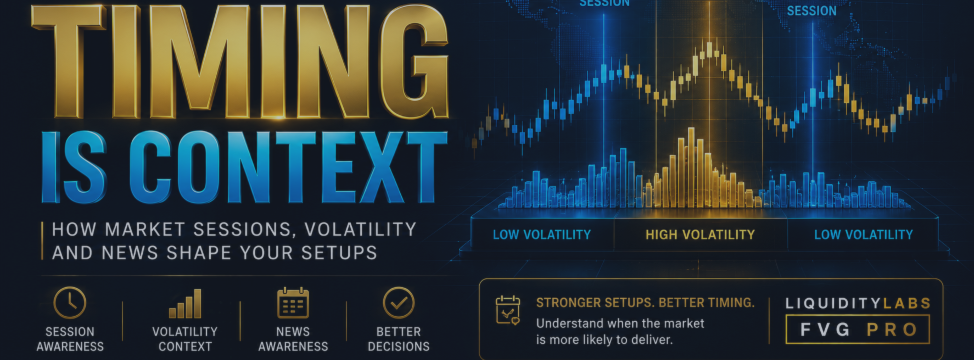
Timing Is Context: Why the Same Trading Setup Can Behave Differently Throughout the Day

Two Fair Value Gaps can look almost identical on a chart.
They can appear in similar structural locations.
They can form after similar directional movement.
They can even receive what appears to be a similar initial reaction.
Yet one develops into a clean directional move while the other becomes trapped inside slow, overlapping price action.
Why?
One possible answer has nothing to do with the shape of the FVG itself.
The market environment surrounding it was different.
Markets do not operate with identical participation, liquidity and volatility throughout every hour of the day.
Understanding when a setup occurs can therefore be an important part of understanding what that setup actually means.
The Chart Hides Time Surprisingly Well
A candlestick chart compresses market activity into visually consistent blocks.
Every candle occupies approximately the same amount of horizontal space.
That can create an illusion that all periods are equivalent.
They are not.
A candle formed during an active trading period may represent a very different environment from a visually similar candle formed during a quiet period.
The price chart shows us what happened.
Time helps explain the environment in which it happened.
That distinction becomes particularly important for traders using concepts such as liquidity, displacement and Fair Value Gaps.
Markets Have a Daily Rhythm
Global financial markets operate across different geographic trading sessions.
Depending on the instrument, participation can change as major financial centers become active and inactive.
This does not mean that price must move at a specific hour.
Nor does it mean that one session is universally "better" than another.
It means the composition and intensity of market activity can change throughout the day.
That change can influence:
-
liquidity,
-
volatility,
-
spreads,
-
execution conditions,
-
directional expansion,
-
consolidation,
-
and the speed at which price moves.
A technical setup should therefore not always be interpreted independently of the environment in which it appears.
Volatility Changes the Character of Price
Volatility is not simply about whether price moves "a lot."
It affects how the market behaves.
During quieter conditions, price may move slowly through overlapping candles.
During more active conditions, price may travel much greater distances in considerably less time.
Neither environment is automatically good or bad.
But they may require different expectations.
Imagine an FVG forming during very low activity.
Price returns to the area and begins oscillating around it.
Now imagine another FVG forming during strong directional expansion.
Price returns briefly, reacts and quickly moves away.
The existence of the FVG alone does not explain the difference.
The surrounding volatility environment contributes additional context.
More Volatility Does Not Automatically Mean Better Trading
It is tempting to assume that greater movement means greater opportunity.
That is not necessarily true.
Higher volatility can create stronger directional expansion.
It can also create:
-
larger price swings,
-
faster invalidations,
-
greater slippage,
-
wider effective risk,
-
violent reversals,
-
and more difficult execution.
The objective is therefore not to search blindly for maximum volatility.
The objective is to understand the volatility environment so that expectations match current market behaviour.
Low Volatility Is Not Automatically Safe
Quiet markets create their own problems.
Small candles and slower movement can appear less dangerous.
But low activity can produce long periods of overlapping price action where directional setups struggle to develop.
A trader may repeatedly see technical structures appear without receiving meaningful follow-through.
This is particularly relevant when interpreting imbalance.
An FVG created inside messy, rotational price action may deserve a different level of attention from one created during clear directional displacement.
Again, the rectangle is only part of the story.
Session Transitions Can Matter
One useful area of study is how price behaves as participation changes between trading sessions.
Markets can transition from relatively quiet conditions into substantially more active ones.
Existing highs and lows may suddenly attract greater attention.
Ranges that persisted for hours can begin expanding.
Previous technical areas can be revisited.
None of these outcomes is guaranteed.
The key concept is that the market environment itself is changing.
A setup appearing immediately before that transition may behave differently from one occurring during a stable period.
Liquidity and Time Are Connected
Liquidity is often discussed exclusively as a price concept.
Previous highs.
Previous lows.
Range boundaries.
Visible extremes.
But liquidity also has a time dimension.
Market participation is not constant.
The number and type of participants active in the market changes.
This can affect how aggressively price responds when important levels are reached.
A previous high being tested during a quiet period may behave differently from the same level being challenged during rapidly increasing participation.
The level has not changed.
The environment has.
Fair Value Gaps Are Historical Evidence
A Fair Value Gap tells us something about how price previously travelled through an area.
It reflects a period of directional imbalance.
But when price eventually returns, the market may no longer be operating under the same conditions.
This is an important observation.
Suppose an imbalance forms during aggressive directional activity.
Hours later, price returns during a much quieter environment.
The historical FVG still exists.
But the current market context has changed.
This is one reason traders should avoid treating old technical structures as though time has frozen around them.
The market that created the area and the market that revisits it can be different.
Scheduled News Changes the Environment
Economic announcements and other scheduled events can dramatically alter short-term market conditions.
Immediately before important news, participation may change.
Some traders reduce exposure.
Liquidity conditions can shift.
Price may become unusually quiet.
Then the release occurs and volatility expands rapidly.
This creates an important distinction:
A technical setup existing near a scheduled event may still be technically valid, but the execution environment can change dramatically.
That does not mean traders should automatically trade or avoid every news event.
It means scheduled information should not be invisible to the decision process.
Technical Analysis Does Not Exist in a Vacuum
A common mistake is treating the chart as a completely self-contained universe.
A trader identifies structure, an FVG and a liquidity level.
Everything looks technically convincing.
But a major scheduled announcement is moments away.
The trader ignores it because "the chart says buy."
Then volatility changes dramatically.
Technical analysis remains useful.
But market context matters.
Knowing that an unusual volatility event may be approaching does not require predicting the announcement.
It simply means acknowledging that the environment is about to change.
Do Not Turn Sessions Into Magic Hours
Once traders begin studying session behaviour, another mistake can appear.
They start treating specific times as automatic signals.
"Price always reverses here."
"This session always sweeps the previous session."
"This hour always creates the real move."
Markets do not operate with that level of certainty.
Historical tendencies can be useful areas of research.
They are not laws.
Session awareness should provide context, not superstition.
A particular time does not eliminate the need to observe structure and current price behaviour.
The Same Setup Can Require Different Expectations
Suppose you identify a technically attractive bullish setup.
During active conditions, you may reasonably expect the market to reveal whether the thesis is working relatively quickly.
During quieter conditions, the same structure may develop more slowly.
This affects expectations.
A trader expecting rapid displacement during a quiet market may become impatient and interfere unnecessarily.
Another trader expecting slow behaviour during an explosive environment may underestimate risk.
Understanding the current environment helps align expectations with what the market is actually capable of producing.
Think in Regimes, Not Just Signals
A useful way to improve technical analysis is to classify the environment before evaluating the setup.
For example:
Quiet / rotational
Price is overlapping and directional commitment appears limited.
Building activity
Movement is beginning to expand and participation appears to be increasing.
Directional expansion
Price is moving decisively with comparatively strong displacement.
High-volatility transition
Price is moving rapidly and conditions may be unstable.
These are not rigid categories.
They are ways of thinking.
The objective is to stop treating every technical signal as though it exists under identical conditions.
Timing Cannot Rescue a Bad Setup
It is equally important not to overvalue timing.
A poor setup does not become good simply because it occurs during an active session.
If the structure is weak, location is poor and price behaviour does not support the thesis, the clock does not magically repair the trade.
Timing is context.
It is not a replacement for analysis.
The strongest process combines several meaningful questions:
Where is price?
What is the market doing?
Why does this area matter?
How is price responding?
And what environment is this happening in?
A Practical Timing Framework
Before acting on a setup, consider adding these questions to your normal analysis.
1. What Is the Current Market Environment?
Is price quiet, rotational, expanding or unusually volatile?
2. Is Participation Likely Changing?
Are you approaching a major session transition or another period where activity commonly changes?
3. Is Scheduled News Nearby?
You do not need to predict the result.
Simply know whether an event capable of changing volatility is approaching.
4. How Was the Setup Created?
Did the FVG form during meaningful displacement or inside messy price action?
5. Has the Environment Changed Since Formation?
An older technical area may now be revisited under completely different conditions.
6. Does Current Price Behaviour Support the Thesis?
Time never replaces the actual response of price.
7. Does the Risk Still Make Sense?
Changing volatility can change the practical risk of executing the setup.
Why Patience Can Be Time-Sensitive
Patience is often discussed as though it simply means waiting longer.
But effective patience means waiting for useful information.
There are situations where waiting allows market participation to increase and structure to become clearer.
There are other situations where waiting causes a good location to disappear.
This is why patience must remain connected to context.
The goal is not to delay every trade.
The goal is to avoid forcing trades simply because a technical object exists on the chart.
Where LiquidityLabs FVG PRO Fits
This broader philosophy is relevant to LiquidityLabs FVG PRO for MetaTrader 5.
Fair Value Gaps are most useful when interpreted as part of a developing market rather than as isolated rectangles.
LiquidityLabs FVG PRO is designed to organize imbalance and setup information visually so traders can evaluate those areas alongside the market context unfolding around them.
Its proprietary timeframe architecture, thresholds, formulas, filters and exact confirmation logic are intentionally not disclosed.
The educational principle does not require those details:
An FVG tells you where imbalance occurred. The current market environment helps you decide how much that historical information matters now.
Build a Market Story
Before taking a trade, try explaining the setup in plain language.
Not:
"There is an FVG, so I am buying."
Instead:
"The market has been expanding directionally, price is returning toward an area created during that expansion, current activity remains supportive, and price is beginning to respond."
Or perhaps:
"The FVG exists, but price has returned during a quiet rotational period and there is no convincing response yet, so I am waiting."
The technical object is the same.
The interpretation changes because the surrounding information changes.
That is contextual analysis.
Final Thoughts
Price does not move inside a laboratory.
Markets operate through changing participation, changing volatility and changing information.
The same technical pattern can therefore behave differently depending on when and where it occurs.
This does not mean traders need to predict every session or news event.
It means time should become another piece of context.
Understand the market environment.
Know when participation may be changing.
Be aware of scheduled events capable of altering volatility.
Observe how the FVG was created.
Then watch how price behaves when it returns.
The setup tells you what to watch. Context tells you how to interpret what happens next.
LiquidityLabs FVG PRO for MetaTrader 5:
https://www.mql5.com/en/market/product/189564
Trading-risk disclaimer: Trading Forex, CFDs, cryptocurrencies and other leveraged instruments involves substantial risk and may not be suitable for every trader. Market-session analysis, volatility observations, Fair Value Gaps and technical indicators cannot guarantee future price behaviour or profitable results. Scheduled events can cause rapid changes in volatility and execution conditions. Always evaluate trades independently and use appropriate risk management.




