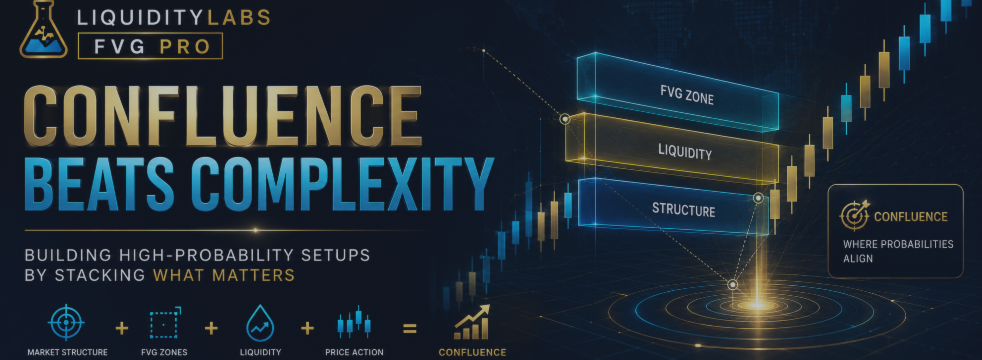
Confluence Beats Complexity: Why More Indicators Don’t Always Mean Better Trades

Open enough trading charts and eventually you will find one covered with moving averages, oscillators, momentum tools, support and resistance levels, volume studies, trend indicators, arrows and colored zones.
The reasoning seems logical.
If one indicator is useful, five indicators should provide more confirmation.
If five are useful, ten should provide even greater confidence.
Unfortunately, technical analysis does not necessarily work that way.
More information is not automatically better information.
In fact, adding too many signals can make it harder to understand the one thing that actually matters:
What is price doing right now, and does the available evidence support a coherent trading idea?
This is where the concept of confluence becomes useful.
What Is Confluence?
Confluence occurs when multiple meaningful pieces of market information support the same general interpretation.
For example, imagine price approaches an important structural area.
At approximately the same location, you also observe evidence of liquidity interaction and a previously created imbalance.
Then price itself begins responding.
Those observations are different, but they may collectively support the same market thesis.
That is confluence.
The important word is different.
If five indicators are essentially measuring the same underlying information, having all five agree may not provide as much independent confirmation as it appears.
Five Indicators Can Sometimes Be One Opinion
Consider several momentum indicators applied to the same chart.
They may use different names, visual styles and formulas.
But if they are all primarily responding to recent price momentum, they may frequently produce similar signals.
Seeing all of them bullish can feel like five independent confirmations.
In reality, you may simply be viewing the same market characteristic through five slightly different calculations.
This creates an illusion of confluence.
True confluence is stronger when the observations describe different aspects of market behaviour.
For example:
Structure can describe how price is progressing.
Liquidity can help identify areas where orders may be concentrated.
Imbalance can highlight how aggressively price previously moved through an area.
Current price action can show how the market is responding now.
These are related, but they are not identical observations.
Start With Market Structure
Before adding indicators, traders should understand the basic structure of price.
Is the market trending?
Is it ranging?
Is price expanding?
Is it compressing?
Are previous highs or lows being respected?
Is the market repeatedly failing to continue?
A sophisticated indicator cannot rescue an analysis that ignores the environment in which the signal appears.
The same indicator signal can behave very differently in a clean directional market compared with a chaotic range.
Structure therefore provides the framework in which other information can be interpreted.
Location Matters
A signal appearing anywhere on a chart is usually less meaningful than a signal appearing at a relevant location.
Imagine receiving an identical bullish signal in two places.
The first occurs in the middle of random price action.
The second occurs after price interacts with a structurally important area.
Even though the indicator output is identical, the surrounding context is different.
This is one reason traders should avoid thinking only in terms of:
Signal = trade.
A better sequence is:
Location → context → behaviour → potential setup.
The signal becomes part of the analysis rather than the entire analysis.
Liquidity Adds Another Layer
Previous highs and lows can attract trading activity because orders often accumulate around visible market extremes.
When price approaches those areas, the reaction can provide useful information.
But liquidity should not become another automatic trading rule.
Price taking a high does not guarantee a reversal.
Price taking a low does not guarantee a rally.
The useful information comes from combining the event with other observations.
Where did the liquidity event occur?
What structure surrounded it?
How did price respond afterward?
Did the market accept the new prices or reject them?
This is how one concept becomes part of a larger confluence rather than an isolated signal.
Where Fair Value Gaps Fit
Fair Value Gaps can identify areas where price moved with enough imbalance that trading activity was comparatively one-sided.
That can make these areas interesting for future analysis.
But an FVG existing on the chart does not automatically create a trade.
Consider two identical-looking imbalances.
One exists in an arbitrary location with little surrounding context.
Another exists near meaningful structure after a significant market event.
Visually they may look similar.
Contextually they are different.
This is why traders benefit from asking:
Why does this FVG matter here?
rather than:
Is there an FVG?
The second question finds rectangles.
The first attempts to understand the market.
Price Action Should Still Have the Final Word
Historical structure can tell you where something important may happen.
Liquidity can identify areas worth watching.
An imbalance can provide another area of interest.
But eventually price arrives there.
At that point, the market begins providing new information.
Does price reject the area?
Does it trade straight through it?
Does momentum accelerate?
Does price hesitate?
Does the expected reaction fail completely?
This current behaviour matters because market conditions are constantly evolving.
A setup that looked excellent before price arrived can weaken once the actual response begins.
Good analysis must allow new information to change the thesis.
More Confirmation Has a Cost
Waiting for additional confirmation can improve selectivity.
But there is always a trade-off.
If a trader demands endless confirmation, the market may already have travelled significantly before every condition finally agrees.
The trader then receives a theoretically excellent signal at a poor location.
This creates an important balancing problem.
Too little confirmation can produce low-quality trades.
Too much confirmation can produce late trades.
The objective is not maximum confirmation.
The objective is useful confirmation.
Avoid the Checklist Trap
Trading checklists can be valuable.
But they can also become misleading when traders simply count conditions.
Imagine a strategy that awards one point for every bullish indicator.
Seven bullish conditions must mean a stronger trade than four, correct?
Not necessarily.
Suppose six of those seven conditions are derived from similar momentum calculations.
Now compare that with another setup containing only four observations:
- meaningful market structure,
- relevant liquidity interaction,
- useful location,
- convincing current price response.
The second setup contains fewer boxes to check, but the information may be much more diverse.
Quality matters more than quantity.
Independent Evidence Is More Valuable
Think about confluence like investigating a question.
If five people repeat information they all heard from the same source, you do not truly have five independent sources.
You have one source repeated five times.
Technical indicators can create the same problem.
If several tools are all derived primarily from recent price movement, their agreement should not automatically be treated as independent evidence.
Better confluence comes from combining observations that answer different questions.
Structure: What is the market doing?
Location: Where is price doing it?
Liquidity: What important orders or extremes may be involved?
Imbalance: How did price previously travel through this area?
Current behaviour: What is price doing now?
Together, these provide a much richer market picture.
Confluence Does Not Mean Certainty
Even an excellent setup can fail.
This needs to be stated clearly.
Confluence does not turn probability into certainty.
A beautiful structure, relevant liquidity event, well-positioned imbalance and convincing price reaction can still lead to a losing trade.
Markets contain uncertainty.
The purpose of confluence is not to eliminate that uncertainty.
It is to create a more structured reason for participating.
That distinction matters because traders who believe confirmation guarantees outcomes often take excessive risk when everything appears aligned.
No setup deserves unlimited confidence.
Risk Still Comes First
A trader can identify excellent confluence and still have an unattractive trade.
Why?
Because the entry location may create poor risk.
Perhaps the market already moved too far.
Perhaps logical invalidation is too distant.
Perhaps volatility makes execution unattractive.
Perhaps the setup simply does not fit the trader's risk plan.
Confluence answers:
Does the market evidence support this idea?
Risk management answers:
Should I actually take this trade from here?
Both questions matter.
Simplicity Makes Decisions Faster
There is another advantage to reducing unnecessary indicators.
Decision-making becomes clearer.
When a chart contains ten conflicting tools, traders can often find evidence supporting whichever position they already want to take.
One indicator says buy.
Another says sell.
A third says overbought.
A fourth says momentum is strong.
A fifth says the trend remains bullish.
The trader can selectively choose whichever signal confirms an existing bias.
A simpler analytical framework makes this harder.
The market either demonstrates the behaviour you require or it does not.
Build a Hierarchy Instead of a Collection
Rather than collecting indicators, consider building an analytical hierarchy.
For example:
1. Market Environment
Determine whether the market is trending, ranging, expanding or transitioning.
2. Structure
Identify the important structural areas around current price.
3. Location
Determine whether price is currently somewhere meaningful.
4. Supporting Context
Evaluate relevant liquidity, imbalance or other independent observations.
5. Current Behaviour
Watch how price actually responds.
6. Risk
Determine where the thesis becomes invalid and whether the potential trade is reasonable.
This approach organizes information instead of simply accumulating it.
When Confluence Becomes Overfitting
There is also a danger in constantly adding new conditions after losing trades.
A strategy loses.
The trader adds another indicator.
It loses again.
Another filter is added.
Eventually the setup requires so many conditions that it almost never appears.
Historical charts may look impressive because the rules have been tailored around previous outcomes.
But future markets may behave differently.
Complexity can create the appearance of precision without actually improving robustness.
Every additional rule should therefore have a clear purpose.
Ask:
What independent information does this condition provide?
If there is no good answer, the condition may not belong in the process.
Where LiquidityLabs FVG PRO Fits
This philosophy is relevant to LiquidityLabs FVG PRO for MetaTrader 5.
The objective is not to encourage traders to treat every visible Fair Value Gap as an automatic trade.
FVGs are more useful when interpreted within broader market context.
LiquidityLabs FVG PRO helps organize imbalance-related information and developing setup context visually while keeping the underlying decision focused on the market rather than on an isolated rectangle.
The proprietary timeframe architecture, thresholds, formulas, filters and exact confirmation logic are intentionally not disclosed.
The important educational concept does not require those details:
An FVG becomes more meaningful when you understand why that area matters within the surrounding market.
A Simple Confluence Test
Before taking a setup, try asking yourself:
Can I explain this trade without naming five indicators?
For example:
“Price is interacting with an important structural area, liquidity around a previous extreme has been tested, an imbalance exists nearby, and current price behaviour is beginning to support my directional thesis.”
That is a coherent explanation.
Now compare it with:
“Indicator A is green, indicator B crossed upward, indicator C is above 50, indicator D flashed an arrow and indicator E changed color.”
The second explanation contains more signals.
The first may contain more understanding.
That difference is worth thinking about.
Final Thoughts
Trading does not become professional simply because the chart becomes complicated.
Complexity and sophistication are not the same thing.
A useful trading process should help answer a small number of important questions:
What is the market doing?
Where is price?
Why does this location matter?
What evidence supports the idea?
What evidence would invalidate it?
Is the risk reasonable?
Confluence helps answer those questions by combining independent observations into a coherent thesis.
But confluence should never become an excuse to cover the chart with endless indicators.
Use structure.
Understand location.
Observe liquidity.
Study imbalance.
Watch current price behaviour.
Then decide whether those pieces actually tell the same story.
Do not collect confirmations. Build an argument.
LiquidityLabs FVG PRO for MetaTrader 5:
https://www.mql5.com/en/market/product/189564
Trading-risk disclaimer: Trading Forex, CFDs, cryptocurrencies and other leveraged instruments involves substantial risk and may not be suitable for every trader. Confluence, price-action analysis, Fair Value Gaps and technical indicators cannot guarantee future market behaviour or profitable results. Always evaluate trades independently and use appropriate risk management.